102 N Fifth St · Edina, MO
Flood risk 1/10 · Minimal
- FEMA flood zone
- X (unshaded)
- Chance of flooding over 30 yrs
- 0.0%
- Est. flood insurance / yr
- $507 – $1,088
Fire risk 3/10 · Minor
- Est. fire insurance / yr
- $1,054 – $1,958
Heat risk 4/10 · Minor
- Hot days now (above 106°F)
- 7 days/yr
- Hot days in 30 yrs
- 16 days/yr
Wind risk 2/10 · Minimal
- Chance of severe wind over 30 yrs
- —
Air-quality risk 2/10 · Minimal
- Unhealthy air days now
- 1 days/yr
- Unhealthy air days in 30 yrs
- 1 days/yr
Risk factors via First Street. Map © Google.
Why this score? — see what drove the C- grade
The composite is a weighted blend of 9 inputs, each scored 0–100. Each bar is that input's sub-score; the figure is the points it added to the 100-point composite (weight × sub-score).
- Cash flow +15.0/30.0
- Appreciation +8.2/10.0
- ARV discount +7.5/15.0
- 1% rule +5.0/10.0
- DSCR +5.0/10.0
- Schools +3.4/10.0
- Livability +3.1/5.0
- Rent growth +2.5/5.0
- Condition / age +2.5/5.0
$12,000
🖨 Deal sheet 📄 Offer letter ✓ Due diligence
Listing remarks
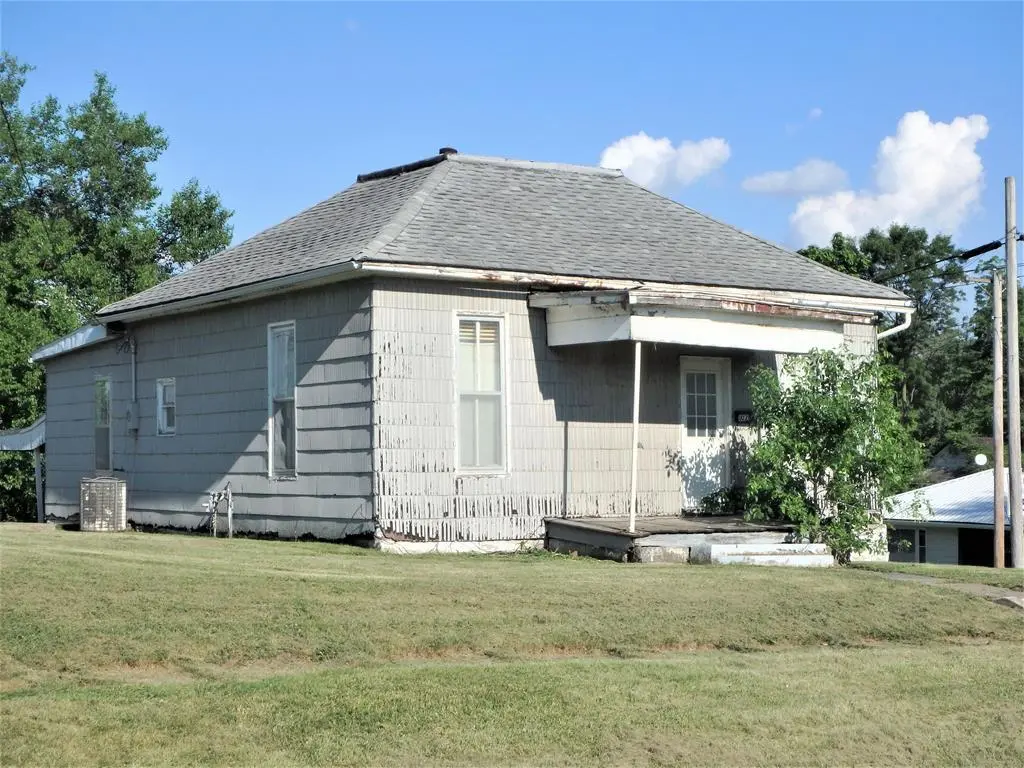
Property is being sold for lot value only. Home has little to no value and is being sold “as-is. ” Per Seller request, the house will not be shown to Buyers. Corner lot located on State Highway 6 East in Edina, MO, conveniently close to downtown amenities, shopping, dining, and community activities. For additional information or to discuss this property further, contact Mark Hunolt at 660-341-0802. #lookwithLEGACYinmind
Key facts
- Community activities
- Shopping
- Dining
Tags
Property features AI
Finance
- Financial info: Annual taxes listed
Exterior
- Utilities: Public water
- Home design: Single Family Residence
- Construction: Built as a single-family dwelling
- Exterior features: Lot approximately 66 x 133
Interior
- Bathrooms: 1 full bathroom
- Interior features: Residential single-family home
Neighborhood map
What this means for you Summary
Snapshot
- This is a 2-bed/1.0-bath single-family listed at $12k.
Deal economics
- At list price, monthly cash flow is $671 ($8k/yr) — positive.
- The deal already cash-flows at list — no discount required.
- Meets the 1% rule at list price ($954 rent vs $12k).
- Recommended offer: $12k (1.5% below list) — sets the bar for market timing.
Location & tenants
- Location reads 61/100 on livability (#412 in MO) — a middle-class / working-renter tenant base. Strengths: cost of living A+, housing A-, crime B+; Watch: schools D, amenities F, commute F.
- Knox County R-I (rural): math 34% / reading 47% proficiency, ranked #154 of 324 in MO (top 48%) — families likely to look elsewhere, expect single-tenant / working-renter base with shorter leases.
- Market conditions: 13 active listings in the ZIP; 3 units permitted in Knox County in 2024 (0 in 5+ unit buildings).
Forward outlook
- In year one you build about $850 of equity ($83 loan paydown + $767 appreciation (6.4% local appreciation)).
- Knox County population projected at -32% by 2050 — secular population decline; favor cash flow + early exit over multi-decade hold.
- At projected returns (6.4% appreciation + 3.0% rent growth), your $3k cash investment doubles in ~1 year — after that, you're playing with house money.
Negotiation context
- It's been on market 15 days — a 2% lower offer ($12k) is reasonable based on typical stale-listing flexibility.
Questions for the listing agent
- Is there a deadline driving the sale (1031 exchange, divorce, estate, relocation)? That informs how much negotiation room exists.
- Schools are D-rated, which usually means shorter tenancies and higher turnover. Who's the typical renter profile here, and what's been the actual vacancy rate?
- What's the average days-on-market for RENTAL listings here right now (not sales)? A rising rental-DOM trend means longer vacancies and softer asking-rent achievability than the comps imply.
- What's the recent tenant-quality profile in this submarket — average credit score on applications, eviction rate, late-payment / NSF rate, and stable-employment percentage? A property-management company in the area should have these aggregated.
- How much new for-sale + rental construction is in the pipeline within 1–3 miles? Heavy new supply typically softens prices + rents 12–24 months out; constrained supply supports both.
Investment metrics
- 1% rule
- 7.95% ✓
- Cap rate
- 73.37%
- Cash-on-cash
- 239.55%
- DSCR
- 11.66
- GRM
- 1.0
CMA / ARV
- ARV (median comp)
- $105,060
- List price
- $12,000
- Delta
- -88.58%
- Verdict
- UNDERPRICED
- Comps
- 8 within 1.0 mi
Show comp detail 3 sales within ~0.75 mi
| Address | Dist | Beds/Ba | Sqft | Sold | Price | $/sf | Match |
|---|---|---|---|---|---|---|---|
| 902 E Morgan St | 0.27mi | 2/1.0 | 1,062 (-3%) | 11mo | $135,000 | $127 | 74 |
| 508 Jackson | 0.17mi | 2/1.5 | 1,170 (+7%) | 11mo | $186,500 | $159 | 69 |
| 600 E Jackson St | 0.18mi | 2/1.0 | 1,056 (-3%) | 23mo | $85,000 | $80 | 67 |
Match score weights: distance 35% · size 25% · config 20% · recency 20%. Top-matched comps best support the ARV.
Projected returns pro-forma
6.39% appreciation · 3.0% rent growth · sell at horizon
- IRR
- —
- Equity multiple
- 14.83×
- Total profit
- $46,477
- Equity at exit
- $7,840
- IRR
- —
- Equity multiple
- 31.72×
- Total profit
- $103,221
- Equity at exit
- $14,480
Cash invested: $3,360 (down + closing). Projections, not guarantees.
Landlord ↔ Tenant lean methodology
- Overall (STATE)
- 81 Strongly Landlord-Friendly
- State Missouri
- 81 Strongly Landlord-Friendly · R+10
- County
- — inherits STATE
- City
- — inherits STATE
ZIP-level market 63537
- Home prices YoY
- 3.3%
- Active inventory
- 13
- Price-to-rent
- 1.0×
Monthly cashflow live
- Estimated rent
- $954 medium interval (Pro) →
- Mortgage (P&I)
- −$63
- Tax est. 1.5%
- −$15 /mo · $180/yr
- Insurance
- −$5
- HOA
- −$0
- Vacancy / Maint / Mgmt
- −$200
- Net cashflow
- $671
Break-even live
UW: 25.0% down · 7.5% · 30yr · 1.5% tax · 5.0% vac · 8.0% maint · 8.0% mgmt
Financing live
Cash to close
- Down payment
- $3,000
- Closing costs
- $360
- Reserves months
- —
- Total cash needed
- —
Loan-product check · same deal, 3 products live
Conventional
25% down · 7.5% · 30yr
- Down + closing
- —
- Monthly P&I
- —
- Monthly cashflow
- —
- DSCR
- —
- Eligible?
- —
Personal DTI + credit; lowest rate.
DSCR
20% down · 8.5% · 30yr
- Down + closing
- —
- Monthly P&I
- —
- Monthly cashflow
- —
- DSCR
- —
- Eligible?
- —
No personal income docs; deal must DSCR.
Hard money
10% down · 12.0% · 12mo
- Down + closing
- —
- Monthly P&I
- —
- Monthly cashflow
- —
- DSCR
- —
- Eligible?
- —
Short-term bridge; refi at stabilization.
Listing history 1 events
-
2026-05-14$12,000 Active 435-char remark
ⓘ Source: listings_history table (triggers on properties + properties_extension) + one-shot
backfill from property_details.listing_events for pre-trigger history.
Climate risk First Street
- Flood 1/10 Low FEMA zone X (unshaded) · 0% chance over 30 yrs
- Wildfire 3/10 Moderate
- Heat 4/10 Moderate 7 d/yr ≥106°F today · 16 d/yr by 30 yrs out
- Wind 2/10 Low
- Air quality 2/10 Low 1 unhealthy d/yr today · 1 by 30 yrs out
Nearby sold comps map
Loading sold comps map…
Walkable amenities ~0.75 mi
Loading nearby amenities…
Taxation est. · year 1
- Rental income
- $11,448
- − Mortgage interest
- −$672
- − Property taxes
- −$180
- − Insurance
- −$60
- − Repairs & maintenance
- −$916
- − Management
- −$916
- − Depreciation
- −$349
- Taxable income
- $8,355
- Est. tax owed @ 24.0%
- −$2,005
- After-tax cash flow
- $6,044/yr
For passive investors: Depreciation is non-cash, so a rental often shows a tax loss while cash-flowing — sheltering income. Rental losses are passive: they offset passive income freely, and up to $25,000/yr can offset ordinary (W-2) income if you actively participate and your MAGI is under $100k (phasing out to $0 by $150k); unused losses carry forward. On sale, claimed depreciation is recaptured at up to 25%, and gains may owe capital-gains tax (a 1031 exchange can defer both). Figures are a year-1 estimate at your 24.0% rate — not tax advice; consult a CPA.
Schools (NCES district)
- District
- Knox County R-I
- NCES district ID
- 2911280
- Math proficiency
- 34% ▼ -9.00%
- Reading proficiency
- 47% ▲ 3.00%
- Median HH income
- $35,777
- Composite
- 33.5/100
- National rank
- #5441
- State rank
- #154 of 324 in MO
Livability — Edina
- Score
- 61/100
- State rank
- #412
- US rank
- #17353
Category grades
Schools grade is shown separately in the Schools card above.
Census & demographics
- Census place
- Edina, MO
- Population (ZIP)
- 2,331
Population outlook (Knox County) Hauer SSP2
- Today (2025)
- 3,387 people
- By 2030
- 3,136 · -7.4%
- By 2040
- 2,686 · -20.7%
- By 2050
- 2,292 · -32.3%
- By 2075
- 1,581 · -53.3%
- By 2100
- 1,027 · -69.7%
Race, ethnicity, and origin ACS 2023
- Neighborhood character
- Predominantly White (93%)
- Race & ethnicity
- White 93% Pacific Islander 3% Two or more races 2%
- Common ancestry
- Lithuanian 3% Scottish 3% Italian 2%
- Foreign-born
- 0%
- Languages at home
- 99% English-only · Spanish 1%
Political lean MEDSL · Knox
- 2024 margin
- Solid R (+64.5) · D 17.2% · R 81.7% · Other 1.1%
- 2008→2024 swing
- -42.2pp toward R · 2008: -22.4pp · 2024: -64.5pp
- All cycles
- 2024: R+64.5 2020: R+61.8 2016: R+55.4 2012: R+25.9 2008: R+22.4
Not yet ingested
- Civics
- —
Market trends
- HPI YoY
- ▲ 6.39%
- Current HPI
- 198.8758
- Rent YoY
- —
- Metro
- —
- State GDP YoY
- ▲ 1.84%
- F500 in state
- 20
Industry mix (Fortune 500 HQ in MO)
| Industry | F500 HQs | Revenue |
|---|---|---|
| Healthcare | 1 | $163B |
|
||
| Insurance | 1 | $21B |
|
||
| Industrial Technology | 1 | $17B |
|
||
| Retail | 1 | $16B |
|
||
| Industrial Distribution | 1 | $10B |
|
||
| Utilities | 1 | $9B |
|
||
Price history
2 events — show timeline
- 2026-05-29 Pending — NECAR
- 2026-05-14 Listed $12,000 NECAR
Cash-flow waterfall
monthlySold comps — $/sqft
last 12 mo · ≤1 miLoading sold comps…