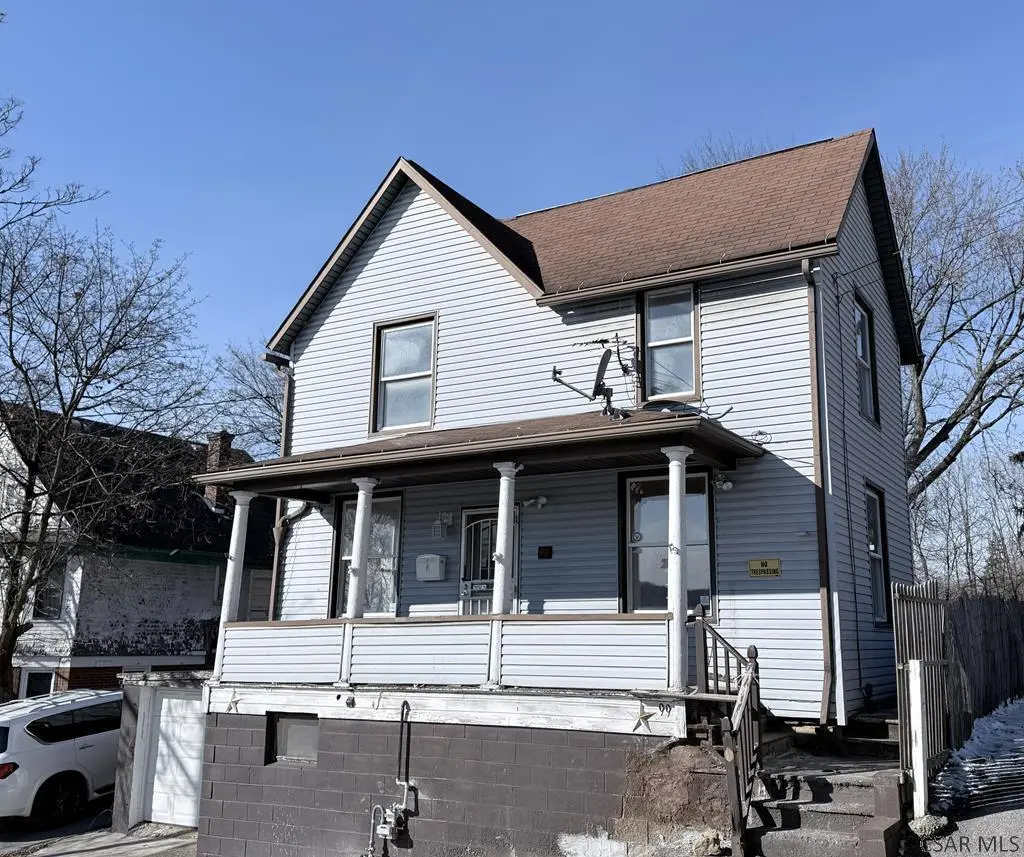
99 Arthur St · Dale, PA
Flood risk 1/10 · Minimal
- FEMA flood zone
- X (unshaded)
- Chance of flooding over 30 yrs
- 0.0%
- Est. flood insurance / yr
- $473 – $860
Fire risk 1/10 · Minimal
- Est. fire insurance / yr
- $511 – $949
Heat risk 3/10 · Minor
- Hot days now (above 93°F)
- 7 days/yr
- Hot days in 30 yrs
- 18 days/yr
Wind risk 2/10 · Minimal
- Chance of severe wind over 30 yrs
- —
Air-quality risk 2/10 · Minimal
- Unhealthy air days now
- 1 days/yr
- Unhealthy air days in 30 yrs
- 2 days/yr
Risk factors via First Street. Map © Google.
Why this score? — see what drove the C+ grade
The composite is a weighted blend of 9 inputs, each scored 0–100. Each bar is that input's sub-score; the figure is the points it added to the 100-point composite (weight × sub-score).
- Cash flow +30.0/30.0
- 1% rule +10.0/10.0
- DSCR +10.0/10.0
- Schools +3.6/10.0
- Livability +3.4/5.0
- Rent growth +2.5/5.0
- Condition / age +2.5/5.0
- ARV discount +0.0/15.0
- Appreciation +0.0/10.0
$42,500
🖨 Deal sheet 📄 Offer letter ✓ Due diligence
Listing remarks MLS
LET'S GET MOVING TO DALE BORO/FERNDALE SCHOOLS. .. this 2 bedroom home is waiting for it's new owner. The home includes living room, dining room, and kitchen on the main floor. The second floor provides 2 bedrooms and full bath with dressing area. Plenty of storage in the unfinished basement. Gas forced air heat, 100 amp electrical, and 2-car tandem garage. Conveniently located to transportation, shopping, medical facilities/hospital, restaurants, and recreational/entertainment venues. Don't miss this opportunity. Call today for all the details, to receive your TOUR PACKET, and to schedule your personal tour!
Key facts
- 100 amp electrical
- Kitchen
- Living room
Tags
Neighborhood map
What this means for you Summary
Snapshot
- This is a 2-bed/1.0-bath single-family listed at $42k.
Deal economics
- At list price, monthly cash flow is $346 ($4k/yr) — positive.
- The deal already cash-flows at list — no discount required.
- Meets the 1% rule at list price ($849 rent vs $42k).
- Recommended offer: $37k (12.0% below list) — sets the bar for market timing.
Location & tenants
- Location reads 68/100 on livability (#873 in PA) — a middle-class / working-renter tenant base. Strengths: crime A+, cost of living A+, housing B+; Watch: amenities F, commute D-, employment F.
- Ferndale Area SD (suburban): math 31% / reading 56% proficiency, ranked #316 of 539 in PA (top 59%) — families likely to look elsewhere, expect single-tenant / working-renter base with shorter leases.
- Market conditions: 64 active listings in the ZIP; 5 comparable units currently listed for rent nearby; rentals lingering (median 44d on market — plan ~5-8 weeks vacancy on turnover, expect pricing pressure); 100% of comp listings sitting > 30 days — soft ceiling on asking rent; lower-income renter base — watch delinquency; 64 units permitted in Cambria County in 2024 (0 in 5+ unit buildings).
Forward outlook
- Local home prices are declining (-3.0%/yr); year-one equity from $294 of loan paydown is wiped out by about $1k of value loss. Plan a longer hold.
- Cambria County population projected at -28% by 2050 — secular population decline; favor cash flow + early exit over multi-decade hold.
- At projected returns (-3.0% appreciation + 3.0% rent growth), your $12k cash investment doubles in ~4 years — after that, you're playing with house money.
Negotiation context
- It's been on market 147 days — a 12% lower offer ($37k) is reasonable based on typical stale-listing flexibility.
- 4 sale attempts since 20y ago with the ask held roughly flat each time — persistent listings suggest the price (not the market) is what's stuck; bring a comps-based counter.
- Current owner paid $3k; list at $42k implies a 1132% gain — meaningful room to come down on a strong offer.
Risks & watch-outs
- Watch-outs: built in 1896 — expect roof / HVAC / electrical / plumbing capex.
Questions for the listing agent
- It's been on market 147 days. Have you received any prior offers? Is the seller open to a 12% concession, seller financing, or rate buy-down credit?
- Built in 1896 — when were the roof, HVAC, electrical panel, plumbing, and water heater last replaced?
- Why hasn't it sold? Are there any deal-killer items the seller is aware of (foundation, flood, title, zoning, code violations)?
- Is there a deadline driving the sale (1031 exchange, divorce, estate, relocation)? That informs how much negotiation room exists.
- What's the average days-on-market for RENTAL listings here right now (not sales)? A rising rental-DOM trend means longer vacancies and softer asking-rent achievability than the comps imply.
- What's the recent tenant-quality profile in this submarket — average credit score on applications, eviction rate, late-payment / NSF rate, and stable-employment percentage? A property-management company in the area should have these aggregated.
- How much new for-sale + rental construction is in the pipeline within 1–3 miles? Heavy new supply typically softens prices + rents 12–24 months out; constrained supply supports both.
Investment metrics
- 1% rule
- 2.00% ✓
- Cap rate
- 16.06%
- Cash-on-cash
- 34.89%
- DSCR
- 2.55
- GRM
- 4.2
CMA / ARV
- ARV (median comp)
- $34,996
- List price
- $42,500
- Delta
- 21.44%
- Verdict
- OVERPRICED
- Comps
- 20 within 1.0 mi
Show comp detail 8 sales within ~0.75 mi
| Address | Dist | Beds/Ba | Sqft | Sold | Price | $/sf | Match |
|---|---|---|---|---|---|---|---|
| 302 Hickory St | 0.18mi | 3/1.0 (+1) | 1,114 (-0%) | 3mo | $75,000 | $67 | 83 |
| 411 Cedar St | 0.10mi | 3/1.0 (+1) | 1,178 (+5%) | 6mo | $75,000 | $64 | 77 |
| 926 Bloom St | 0.41mi | 2/1.0 | 1,148 (+2%) | 5mo | $30,000 | $26 | 72 |
| 103 Cliff St | 0.09mi | 3/1.0 (+1) | 1,152 (+3%) | 20mo | $23,500 | $20 | 69 |
| 741 Mcmillen St | 0.29mi | 2/1.0 | 960 (-14%) | 7mo | $22,000 | $23 | 57 |
| 743 Mcmillen St | 0.29mi | 2/1.0 | 960 (-14%) | 7mo | $28,000 | $29 | 57 |
| 153 Montag St | 0.38mi | 3/1.0 (+1) | 1,243 (+11%) | 4mo | $60,000 | $48 | 56 |
| 1098 Solomon St | 0.69mi | 3/1.5 (+1) | 1,232 (+10%) | 8mo | $35,000 | $28 | 37 |
Match score weights: distance 35% · size 25% · config 20% · recency 20%. Top-matched comps best support the ARV.
Projected returns pro-forma
-3.0% appreciation · 3.0% rent growth · sell at horizon
- IRR
- 30.5%
- Equity multiple
- 2.28×
- Total profit
- $15,184
- Equity at exit
- $6,337
- IRR
- 37.7%
- Equity multiple
- 4.51×
- Total profit
- $41,730
- Equity at exit
- $3,675
Cash invested: $11,900 (down + closing). Projections, not guarantees.
Landlord ↔ Tenant lean methodology
- Overall (STATE)
- 62 Landlord-Friendly
- State Pennsylvania
- 62 Landlord-Friendly · EVEN
- County
- — inherits STATE
- City
- — inherits STATE
ZIP-level market 15902
- Home prices YoY
- -28.8%
- Active inventory
- 64
- Price-to-rent
- 4.2×
Monthly cashflow live
- Estimated rent
- $849 high interval (Pro) →
- Mortgage (P&I)
- −$223
- Tax from tax record
- −$84 /mo · $1,005/yr
- Insurance
- −$18
- HOA
- −$0
- Vacancy / Maint / Mgmt
- −$178
- Net cashflow
- $346
Break-even live
UW: 25.0% down · 7.5% · 30yr · 1.5% tax · 5.0% vac · 8.0% maint · 8.0% mgmt
Financing live
Cash to close
- Down payment
- $10,625
- Closing costs
- $1,275
- Reserves months
- —
- Total cash needed
- —
Loan-product check · same deal, 3 products live
Conventional
25% down · 7.5% · 30yr
- Down + closing
- —
- Monthly P&I
- —
- Monthly cashflow
- —
- DSCR
- —
- Eligible?
- —
Personal DTI + credit; lowest rate.
DSCR
20% down · 8.5% · 30yr
- Down + closing
- —
- Monthly P&I
- —
- Monthly cashflow
- —
- DSCR
- —
- Eligible?
- —
No personal income docs; deal must DSCR.
Hard money
10% down · 12.0% · 12mo
- Down + closing
- —
- Monthly P&I
- —
- Monthly cashflow
- —
- DSCR
- —
- Eligible?
- —
Short-term bridge; refi at stabilization.
Rent comps 5 comps
| Address | Beds | Baths | Sqft | Rent | $/sqft | DOM | Units | Dist |
|---|---|---|---|---|---|---|---|---|
| 412 Oak St Unit 1 Johnstown, PA | 2.0 | 1.0 | 1100 | $900 | $0.82 | 43d | 1 | 0.13mi |
| 906 Lemon St Johnstown, PA | 3.0 | 1.0 | 1128 | $750 | $0.66 | 43d | 1 | 0.30mi |
| 343 Linden Ave Unit 2 Johnstown, PA | 1.0 | 1.0 | 850 | $675 | $0.79 | 43d | 1 | 1.00mi |
| 619 Grove Ave Johnstown, PA | 2.0 | 2.0 | 1100 | $1,050 | $0.95 | 43d | 1 | 1.19mi |
| 129-131 Plainfield Ave Johnstown, PA | 3.0 | 1.0 | 1300 | $850 | $0.65 | 43d | 1 | 1.47mi |
Listing history 23 events
-
2026-06-19days on market $42,500 Active 147 DOM
-
2026-06-18days on market $42,500 Active 146 DOM
-
2026-06-17days on market $42,500 Active 145 DOM
-
2026-06-16days on market $42,500 Active 144 DOM
-
2026-06-15days on market $42,500 Active 143 DOM
-
2026-06-14days on market $42,500 Active 141 DOM
-
2026-06-12days on market $42,500 Active 140 DOM
-
2026-06-09days on market $42,500 Active 137 DOM
-
2026-06-08days on market $42,500 Active 136 DOM
-
2026-06-07days on market $42,500 Active 135 DOM
-
2026-06-05days on market $42,500 Active 132 DOM
-
2026-06-03days on market $42,500 Active 131 DOM
-
2026-06-02days on market $42,500 Active 130 DOM
-
2026-06-01days on market $42,500 Active 129 DOM
-
2026-05-31days on market $42,500 Active 128 DOM
-
2026-05-30days on market $42,500 Active 127 DOM
-
2026-01-23$42,500 Active 616-char remark
Show marketing remark (616 chars)
LET'S GET MOVING TO DALE BORO/FERNDALE SCHOOLS. .. this 2 bedroom home is waiting for it's new owner. The home includes living room, dining room, and kitchen on the main floor. The second floor provides 2 bedrooms and full bath with dressing area. Plenty of storage in the unfinished basement. Gas forced air heat, 100 amp electrical, and 2-car tandem garage. Conveniently located to transportation, shopping, medical facilities/hospital, restaurants, and recreational/entertainment venues. Don't miss this opportunity. Call today for all the details, to receive your TOUR PACKET, and to schedule your personal tour!
-
2024-09-24$34,900 Active
-
2024-06-10soldstatus $3,450
-
2007-09-17soldstatus $8,000
-
2007-05-07$8,500
-
2006-09-21$11,500
-
1990-05-01soldstatus $9,800
ⓘ Source: listings_history table (triggers on properties + properties_extension) + one-shot
backfill from property_details.listing_events for pre-trigger history.
Tax reassessment forecast PA · Partial reset (capped growth)
- Current annual tax
- $1,005 · $84/mo
- Projected year-2 tax
- $1,005 · $84/mo
- Expected delta
- $0/yr ($0/mo · 0.0%)
ⓘ Screening estimate from a state-policy table — verify with the county assessor before closing.
Climate risk First Street
- Flood 1/10 Low FEMA zone X (unshaded) · 0% chance over 30 yrs
- Wildfire 1/10 Low
- Heat 3/10 Moderate 7 d/yr ≥93°F today · 18 d/yr by 30 yrs out
- Wind 2/10 Low
- Air quality 2/10 Low 1 unhealthy d/yr today · 2 by 30 yrs out
Nearby sold comps map
Loading sold comps map…
Walkable amenities ~0.75 mi
Loading nearby amenities…
Taxation est. · year 1
- Rental income
- $10,183
- − Mortgage interest
- −$2,381
- − Property taxes
- −$1,005
- − Insurance
- −$212
- − Repairs & maintenance
- −$815
- − Management
- −$815
- − Depreciation
- −$1,236
- Taxable income
- $3,719
- Est. tax owed @ 24.0%
- −$893
- After-tax cash flow
- $3,260/yr
For passive investors: Depreciation is non-cash, so a rental often shows a tax loss while cash-flowing — sheltering income. Rental losses are passive: they offset passive income freely, and up to $25,000/yr can offset ordinary (W-2) income if you actively participate and your MAGI is under $100k (phasing out to $0 by $150k); unused losses carry forward. On sale, claimed depreciation is recaptured at up to 25%, and gains may owe capital-gains tax (a 1031 exchange can defer both). Figures are a year-1 estimate at your 24.0% rate — not tax advice; consult a CPA.
Schools (NCES district)
- District
- Ferndale Area SD
- NCES district ID
- 4209750
- Math proficiency
- 31% ▼ -13.00%
- Reading proficiency
- 56% ▼ -5.00%
- Median HH income
- $37,748
- Composite
- 36.12/100
- National rank
- #4750
- State rank
- #316 of 539 in PA
Livability — Dale
- Score
- 68/100
- State rank
- #873
- US rank
- #9220
Category grades
Schools grade is shown separately in the Schools card above.
Census & demographics
- Census place
- Dale, PA
- County
- Cambria County · 30,791 people
- Metro
- Johnstown, PA
- Population (ZIP)
- 11,462
- Household income
- $44,215
- Rent vs Own
- Severe rent burden
- 266.0
Population outlook (Cambria County) Hauer SSP2
- Today (2025)
- 122,754 people
- By 2030
- 115,827 · -5.6%
- By 2040
- 101,309 · -17.5%
- By 2050
- 88,379 · -28.0%
- By 2075
- 65,237 · -46.9%
- By 2100
- 46,909 · -61.8%
Race, ethnicity, and origin ACS 2023
- Neighborhood character
- Predominantly White (75%)
- Race & ethnicity
- White 75% Two or more races 14% Black 8% Hispanic / Latino 3%
- Common ancestry
- Romanian 7% Slovak 2% Hungarian 2%
- Foreign-born
- 2% · Canada
- Languages at home
- 97% English-only · Spanish 2%
Political lean MEDSL · Cambria
- 2024 margin
- Solid R (+39.7) · D 29.8% · R 69.5%
- 2008→2024 swing
- -40.4pp toward R · 2008: 0.7pp · 2024: -39.7pp
- All cycles
- 2024: R+39.7 2020: R+37.3 2016: R+37.8 2012: R+17.8 2008: D+0.7
Not yet ingested
- Civics
- —
Market trends
- HPI YoY
- ▼ -43.86%
- Current HPI
- 108.2198
- Rent YoY
- —
- Metro
- Johnstown, PA
- State GDP YoY
- ▲ 1.68%
- F500 in state
- 34
Industry mix (Fortune 500 HQ in PA)
| Industry | F500 HQs | Revenue |
|---|---|---|
| Healthcare | 2 | $309B |
|
||
| Insurance | 2 | $27B |
|
||
| Telecommunications / Media | 1 | $124B |
|
||
| Industrial Distribution | 1 | $22B |
|
||
| Financial Services | 1 | $20B |
|
||
| Chemicals / Materials | 1 | $18B |
|
||
Price history
+333.7% since first listed7 events — show timeline
- 2026-01-23 Listed $42,500 CSMLS
- 2024-09-24 Listed $34,900 CSMLS
- 2024-06-10 Sold (Public Records) $3,450 Public Records
- 2007-09-17 Sold (MLS) $8,000 CSMLS
- 2007-05-07 Listed $8,500 CSMLS
- 2006-09-21 Listed $11,500 CSMLS
- 1990-05-01 Sold (Public Records) $9,800 Public Records
Property tax history
+2.3%/yrLatest (2026): $1,005 · +4.0% YoY. Source: county tax records.
Cash-flow waterfall
monthlySold comps — $/sqft
last 12 mo · ≤1 miLoading sold comps…