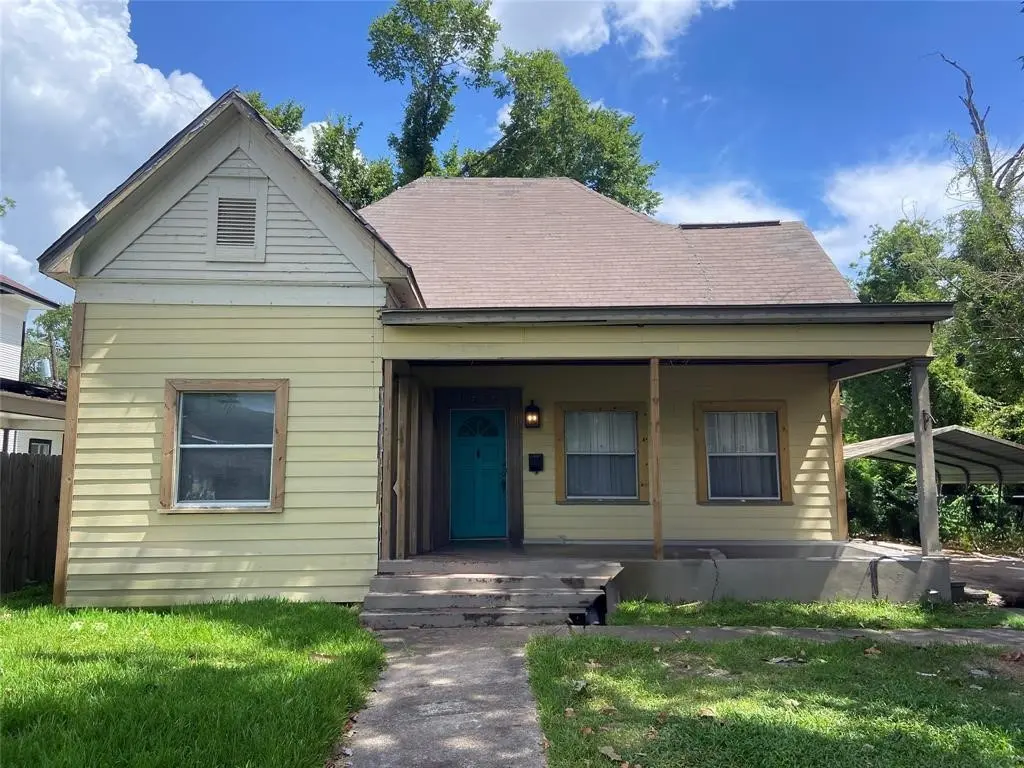
1202 Pine Ave · Orange, TX
Flood risk 7/10 · Major
- FEMA flood zone
- X (shaded)
- Chance of flooding over 30 yrs
- 0.9%
- Est. flood insurance / yr
- $507 – $1,088
Fire risk 3/10 · Minor
- Est. fire insurance / yr
- $1,222 – $2,270
Heat risk 9/10 · Severe
- Hot days now (above 109°F)
- 7 days/yr
- Hot days in 30 yrs
- 24 days/yr
Wind risk 9/10 · Severe
- Chance of severe wind over 30 yrs
- 99.0%
Air-quality risk 3/10 · Minor
- Unhealthy air days now
- 2 days/yr
- Unhealthy air days in 30 yrs
- 3 days/yr
Risk factors via First Street. Map © Google.
Why this score? — see what drove the B grade
The composite is a weighted blend of 9 inputs, each scored 0–100. Each bar is that input's sub-score; the figure is the points it added to the 100-point composite (weight × sub-score).
- Cash flow +30.0/30.0
- 1% rule +10.0/10.0
- DSCR +10.0/10.0
- ARV discount +7.5/15.0
- Appreciation +5.5/10.0
- Rent growth +3.9/5.0
- Livability +3.6/5.0
- Condition / age +2.5/5.0
- Schools +1.6/10.0
$95,000
🖨 Deal sheet (PDF) 📄 Offer letter ✓ Due diligence
Listing remarks MLS
Built in 1936, this 3-bedroom, 2-bath home offers 2,212 sq ft of space, charm, and strong value-add potential in a quiet, established Orange neighborhood. Featuring original hardwood floors, generous room sizes, and a flexible layout, this property provides a solid foundation for renovation or long-term rental income. The spacious living areas and large windows offer excellent natural light, while the classic architectural details reflect the craftsmanship of its era. With some updates already completed and room for further improvements, this property presents an excellent opportunity for investors, flippers, or buyers looking to build equity. Conveniently located near schools, shopping, and everyday amenities, this is a prime chance to transform a historic home into a standout investment.
Key facts
- Large windows
- Flexible layout
- 8,145 sq ft lot
Tags
Neighborhood map
What this means for you Summary
Snapshot
- This is a 3-bed/2.0-bath single-family listed at $95k.
Deal economics
- At list price, monthly cash flow is $388 ($5k/yr) — positive.
- The deal already cash-flows at list — no discount required.
- Meets the 1% rule at list price ($2k rent vs $95k).
- Recommended offer: $84k (12.0% below list) — sets the bar for market timing.
- Cap rate 12.0% vs local median 3.8% in Orange — top-decile yield for the area; either an underpriced asset or a hidden risk that comps aren't pricing in. Stress-test before assuming the spread holds.
Location & tenants
- Location reads 71/100 on livability (#286 in TX) — a middle-class / working-renter tenant base. Strengths: cost of living A+, housing A+, health & safety A+; Watch: crime D+, employment D+, amenities F.
- West Orange-Cove CISD (suburban): math 17% / reading 21% proficiency, ranked #784 of 826 in TX (top 95%) — low school quality limits family demand, transient renter base, plan for 1-2y turnover; 79% free/reduced lunch — lower-income household profile, screen leases tightly.
- Zoned schools: West Orange-Stark El (math 14% / reading 17%, grade F, #3,990 of 4,322 statewide, top 93%, 1,130 students, 94% FRL); West Orange-Stark Middle (math 20% / reading 20%, grade F, #1,428 of 1,662 statewide, top 87%, 505 students, 92% FRL); West Orange-Stark H S (math 19% / reading 31%, grade F, #1,250 of 1,632 statewide, top 77%, 660 students, 88% FRL).
- Market conditions: Rents rising fast (+5.7%/yr); 339 active listings in the ZIP; 2 comparable units currently listed for rent nearby; 235 units permitted in Orange County in 2024 (50 in 5+ unit buildings).
Forward outlook
- In year one you build about $2k of equity ($657 loan paydown + $960 appreciation (1.0% local appreciation)).
- Orange County population projected at +6% by 2050 — modest demand growth; plan on rents tracking national, not racing it.
- At projected returns (1.0% appreciation + 5.7% rent growth), your $27k cash investment doubles in ~4 years — after that, you're playing with house money.
Negotiation context
- It's been on market 123 days — a 12% lower offer ($84k) is reasonable based on typical stale-listing flexibility.
- 5 sale attempts; this cycle's ask has dropped $15k (14%) from the opening price — seller is motivated, your offer sets the floor, not the list.
Risks & watch-outs
- Watch-outs: property tax is 3.1% of price; flood insurance adds $66/mo; built in 1936 — expect roof / HVAC / electrical / plumbing capex.
- Climate carrying-cost: major flood risk; severe wind risk, 99% chance of damaging wind over 30y; extreme-heat days projected 7→24/yr by 2055 (HVAC capex compounding) — expect insurance premiums to compound above CPI over the hold.
Questions for the listing agent
- It's been on market 123 days. Have you received any prior offers? Is the seller open to a 12% concession, seller financing, or rate buy-down credit?
- Built in 1936 — when were the roof, HVAC, electrical panel, plumbing, and water heater last replaced?
- Property tax is high relative to price — has the assessment been appealed recently, and will the sale trigger a re-assessment?
- What's the actual annual flood-insurance premium (NFIP or private), and is the property in a SFHA with mandatory coverage?
- Why hasn't it sold? Are there any deal-killer items the seller is aware of (foundation, flood, title, zoning, code violations)?
- Is there a deadline driving the sale (1031 exchange, divorce, estate, relocation)? That informs how much negotiation room exists.
- Schools are D-rated, which usually means shorter tenancies and higher turnover. Who's the typical renter profile here, and what's been the actual vacancy rate?
- Crime grade is D in this area — have there been break-ins, vandalism, or insurance claims at this property in the last 3 years? What carrier currently insures it and at what premium?
- What's the average days-on-market for RENTAL listings here right now (not sales)? A rising rental-DOM trend means longer vacancies and softer asking-rent achievability than the comps imply.
- What's the recent tenant-quality profile in this submarket — average credit score on applications, eviction rate, late-payment / NSF rate, and stable-employment percentage? A property-management company in the area should have these aggregated.
- How much new for-sale + rental construction is in the pipeline within 1–3 miles? Heavy new supply typically softens prices + rents 12–24 months out; constrained supply supports both.
Investment metrics
- 1% rule
- 1.65% ✓
- Cap rate
- 12.04%
- Cash-on-cash
- 20.52%
- DSCR
- 1.91
- GRM
- 5.1
CMA / ARV
- ARV (median comp)
- $211,239
- List price
- $95,000
- Delta
- -55.03%
- Verdict
- UNDERPRICED
- Comps
- 16 within 1.0 mi
Show comp detail 2 sales within ~0.75 mi
| Address | Dist | Beds/Ba | Sqft | Sold | Price | $/sf | Match |
|---|---|---|---|---|---|---|---|
| 610 8th St | 0.23mi | 4/2.0 (+1) | 2,442 (+10%) | 12mo | $235,000 | $96 | 57 |
| 905 6th St | 0.40mi | 3/1.0 | 1,980 (-10%) | 4mo | $94,990 | $48 | 56 |
Match score weights: distance 35% · size 25% · config 20% · recency 20%. Top-matched comps best support the ARV.
Projected returns pro-forma
1.01% appreciation · 5.71% rent growth · sell at horizon
- IRR
- 22.2%
- Equity multiple
- 2.17×
- Total profit
- $31,085
- Equity at exit
- $32,480
- IRR
- 27.1%
- Equity multiple
- 4.62×
- Total profit
- $96,390
- Equity at exit
- $43,202
Cash invested: $26,600 (down + closing). Projections, not guarantees.
Landlord ↔ Tenant lean methodology
- Overall (STATE)
- 87 Strongly Landlord-Friendly
- State Texas
- 87 Strongly Landlord-Friendly · R+5
- County
- — inherits STATE
- City
- — inherits STATE
ZIP-level market 77630
- Home prices YoY
- 0.4%
- Rents YoY
- 5.7%
- Active inventory
- 339
- Price-to-rent
- 5.1×
Monthly cashflow live
- Estimated rent
- $1,563 medium interval (Pro) →
- Mortgage (P&I)
- −$498
- Tax from tax record
- −$242 /mo · $2,908/yr
- Insurance
- −$40
- Flood insurance flood zone
- −$66 /mo · $798/yr
- HOA
- −$0
- Vacancy / Maint / Mgmt
- −$328
- Net cashflow
- $388
Break-even live
Sensitivity live
| Price | -10% $442 | -5% $415 | +0% $388 | +5% $362 | +10% $335 |
|---|---|---|---|---|---|
| Rent | -10% $265 | -5% $327 | +0% $388 | +5% $450 | +10% $512 |
| Rate | -1.0pp $436 | -0.5pp $413 | base $388 | +0.5pp $364 | +1.0pp $339 |
UW: 25.0% down · 7.5% · 30yr · 1.5% tax · 5.0% vac · 8.0% maint · 8.0% mgmt
Financing live
Cash to close
- Down payment
- $23,750
- Closing costs
- $2,850
- Reserves months
- —
- Total cash needed
- —
Loan-product check · same deal, 3 products live
Conventional
25% down · 7.5% · 30yr
- Down + closing
- —
- Monthly P&I
- —
- Monthly cashflow
- —
- DSCR
- —
- Eligible?
- —
Personal DTI + credit; lowest rate.
DSCR
20% down · 8.5% · 30yr
- Down + closing
- —
- Monthly P&I
- —
- Monthly cashflow
- —
- DSCR
- —
- Eligible?
- —
No personal income docs; deal must DSCR.
Hard money
10% down · 12.0% · 12mo
- Down + closing
- —
- Monthly P&I
- —
- Monthly cashflow
- —
- DSCR
- —
- Eligible?
- —
Short-term bridge; refi at stabilization.
Rent comps 2 comps
| Address | Beds | Baths | Sqft | Rent | $/sqft | DOM | Units | Dist |
|---|---|---|---|---|---|---|---|---|
| 1117 18th St Orange, TX | 4.0 | 2.0 | 1716 | $1,500 | $0.87 | 45d | 1 | 0.70mi |
| 1205 Wrenway Orange, TX | 4.0 | 2.0 | 1551 | $1,775 | $1.14 | 15d | 1 | 1.00mi |
Listing history 26 events
-
2026-06-21days on market $95,000 Active 123 DOM
-
2026-06-18days on market $95,000 Active 120 DOM
-
2026-06-17days on market $95,000 Active 119 DOM
-
2026-06-16days on market $95,000 Active 118 DOM
-
2026-06-15days on market $95,000 Active 117 DOM
-
2026-06-14days on market $95,000 Active 115 DOM
-
2026-06-13days on market $95,000 Active 114 DOM
-
2026-06-10days on market $95,000 Active 112 DOM
-
2026-06-09days on market $95,000 Active 111 DOM
-
2026-06-08days on market $95,000 Active 110 DOM
-
2026-06-07days on market $95,000 Active 109 DOM
-
2026-06-03days on market $95,000 Active 105 DOM
-
2026-06-02days on market $95,000 Active 104 DOM
-
2026-06-01days on market $95,000 Active 103 DOM
-
2026-05-31days on market $95,000 Active 102 DOM
-
2026-05-30days on market $95,000 Active 101 DOM
-
2026-03-25$110,000 Active 800-char remark
Show marketing remark (800 chars)
Built in 1936, this 3-bedroom, 2-bath home offers 2,212 sq ft of space, charm, and strong value-add potential in a quiet, established Orange neighborhood. Featuring original hardwood floors, generous room sizes, and a flexible layout, this property provides a solid foundation for renovation or long-term rental income. The spacious living areas and large windows offer excellent natural light, while the classic architectural details reflect the craftsmanship of its era. With some updates already completed and room for further improvements, this property presents an excellent opportunity for investors, flippers, or buyers looking to build equity. Conveniently located near schools, shopping, and everyday amenities, this is a prime chance to transform a historic home into a standout investment.
-
2026-02-18$110,000 Active 800-char remark
Show marketing remark (800 chars)
Built in 1936, this 3-bedroom, 2-bath home offers 2,212 sq ft of space, charm, and strong value-add potential in a quiet, established Orange neighborhood. Featuring original hardwood floors, generous room sizes, and a flexible layout, this property provides a solid foundation for renovation or long-term rental income. The spacious living areas and large windows offer excellent natural light, while the classic architectural details reflect the craftsmanship of its era. With some updates already completed and room for further improvements, this property presents an excellent opportunity for investors, flippers, or buyers looking to build equity. Conveniently located near schools, shopping, and everyday amenities, this is a prime chance to transform a historic home into a standout investment.
-
2026-02-18$110,000 Active
Show marketing remark (800 chars)
Built in 1936, this 3-bedroom, 2-bath home offers 2,212 sq ft of space, charm, and strong value-add potential in a quiet, established Orange neighborhood. Featuring original hardwood floors, generous room sizes, and a flexible layout, this property provides a solid foundation for renovation or long-term rental income. The spacious living areas and large windows offer excellent natural light, while the classic architectural details reflect the craftsmanship of its era. With some updates already completed and room for further improvements, this property presents an excellent opportunity for investors, flippers, or buyers looking to build equity. Conveniently located near schools, shopping, and everyday amenities, this is a prime chance to transform a historic home into a standout investment.
-
2025-07-31historical
-
2025-07-14$50,000 Active
-
2025-07-09historical
-
2025-07-03price $75,000
-
2025-05-30$99,000 New
-
2011-09-06soldstatus
-
2010-05-27soldstatus
ⓘ Source: listings_history table (triggers on properties + properties_extension) + one-shot
backfill from property_details.listing_events for pre-trigger history.
Tax reassessment forecast TX · Resets to sale price
- Current annual tax
- $2,908 · $242/mo
- Projected year-2 tax
- $2,908 · $242/mo
- Expected delta
- $0/yr ($0/mo · 0.0%)
ⓘ Screening estimate from a state-policy table — verify with the county assessor before closing.
Climate risk First Street
- Flood 7/10 Severe FEMA zone X (shaded) · 90% chance over 30 yrs
- Wildfire 3/10 Moderate
- Heat 9/10 Extreme 7 d/yr ≥109°F today · 24 d/yr by 30 yrs out
- Wind 9/10 Extreme 99% chance of damaging wind over 30 yrs
- Air quality 3/10 Moderate 2 unhealthy d/yr today · 3 by 30 yrs out
Nearby sold comps map
Loading sold comps map…
Walkable amenities ~0.75 mi
Loading nearby amenities…
Taxation est. · year 1
- Rental income
- $18,761
- − Mortgage interest
- −$5,321
- − Property taxes
- −$2,908
- − Insurance
- −$1,272
- − Repairs & maintenance
- −$1,501
- − Management
- −$1,501
- − Depreciation
- −$2,764
- Taxable income
- $3,493
- Est. tax owed @ 24.0%
- −$838
- After-tax cash flow
- $3,824/yr
For passive investors: Depreciation is non-cash, so a rental often shows a tax loss while cash-flowing — sheltering income. Rental losses are passive: they offset passive income freely, and up to $25,000/yr can offset ordinary (W-2) income if you actively participate and your MAGI is under $100k (phasing out to $0 by $150k); unused losses carry forward. On sale, claimed depreciation is recaptured at up to 25%, and gains may owe capital-gains tax (a 1031 exchange can defer both). Figures are a year-1 estimate at your 24.0% rate — not tax advice; consult a CPA.
Schools (NCES district)
- District
- West Orange-Cove CISD
- NCES district ID
- 4845090
- Math proficiency
- 17% ▼ -7.00%
- Reading proficiency
- 21% ▼ -2.00%
- Median HH income
- $37,329
- Composite
- 15.86/100
- National rank
- #9260
- State rank
- #784 of 826 in TX
Livability — Orange
- Score
- 71/100
- State rank
- #286
- US rank
- #6456
Category grades
Schools grade is shown separately in the Schools card above.
Census & demographics
- Census place
- Orange, TX
- County
- Orange County · 87,112 people
- City population
- 22,976
- Metro
- Beaumont-Port Arthur, TX
- Population (ZIP)
- 28,983
- Household income
- $64,373
- Rent vs Own
- Severe rent burden
- 1018.0
Population outlook (Orange County) Hauer SSP2
- Today (2025)
- 88,065 people
- By 2030
- 89,591 · +1.7%
- By 2040
- 91,982 · +4.4%
- By 2050
- 93,023 · +5.6%
- By 2075
- 94,871 · +7.7%
- By 2100
- 88,155 · +0.1%
Race, ethnicity, and origin ACS 2023
- Neighborhood character
- Majority White (64%)
- Race & ethnicity
- White 64% Black 21% Hispanic / Latino 11% Two or more races 9%
- Hispanic origin (detail)
- Mexican 7%
- Common ancestry
- Lithuanian 13% Italian 1% Slovak 1%
- Foreign-born
- 5% · Canada
- Languages at home
- 91% English-only · Spanish 7% French/Haitian/Cajun 1% Other Asian/Pacific 1%
Political lean MEDSL · Orange
- 2024 margin
- Solid R (+66.8) · D 16.4% · R 83.1%
- 2008→2024 swing
- -19.6pp toward R · 2008: -47.1pp · 2024: -66.8pp
- All cycles
- 2024: R+66.8 2020: R+63.4 2016: R+61.9 2012: R+54.3 2008: R+47.1
Not yet ingested
- Civics
- —
Market trends
- HPI YoY
- ▲ 1.01%
- Current HPI
- 264.14
- Rent YoY
- ▲ 5.71%
- Metro
- Beaumont-Port Arthur, TX
- State GDP YoY
- ▲ 3.95%
- F500 in state
- 110
Industry mix (Fortune 500 HQ in TX)
| Industry | F500 HQs | Revenue |
|---|---|---|
| Energy | 16 | $1,198B |
|
||
| Technology | 5 | $198B |
|
||
| Engineering / Construction | 4 | $72B |
|
||
| Energy Services | 3 | $60B |
|
||
| Utilities | 3 | $41B |
|
||
| Healthcare | 2 | $330B |
|
||
Price history
+11.1% since first listed10 events — show timeline
- 2026-03-25 Listed $110,000 BBOR
- 2026-02-18 Listed $110,000 Deep East Texas MLS
- 2026-02-18 Listed $110,000 HARMLS
- 2025-07-31 Listing Removed — HARMLS
- 2025-07-14 Listed $50,000 HARMLS
- 2025-07-09 Listing Removed — LERA
- 2025-07-03 Price Changed $75,000 LERA
- 2025-05-30 Listed $99,000 LERA
- 2011-09-06 Sold (Public Records) — Public Records
- 2010-05-27 Sold (Public Records) — Public Records
Property tax history
+2.9%/yrLatest (2025): $2,908 · +1.8% YoY. Source: county tax records.
Cash-flow waterfall
monthlySold comps — $/sqft
last 12 mo · ≤1 miLoading sold comps…