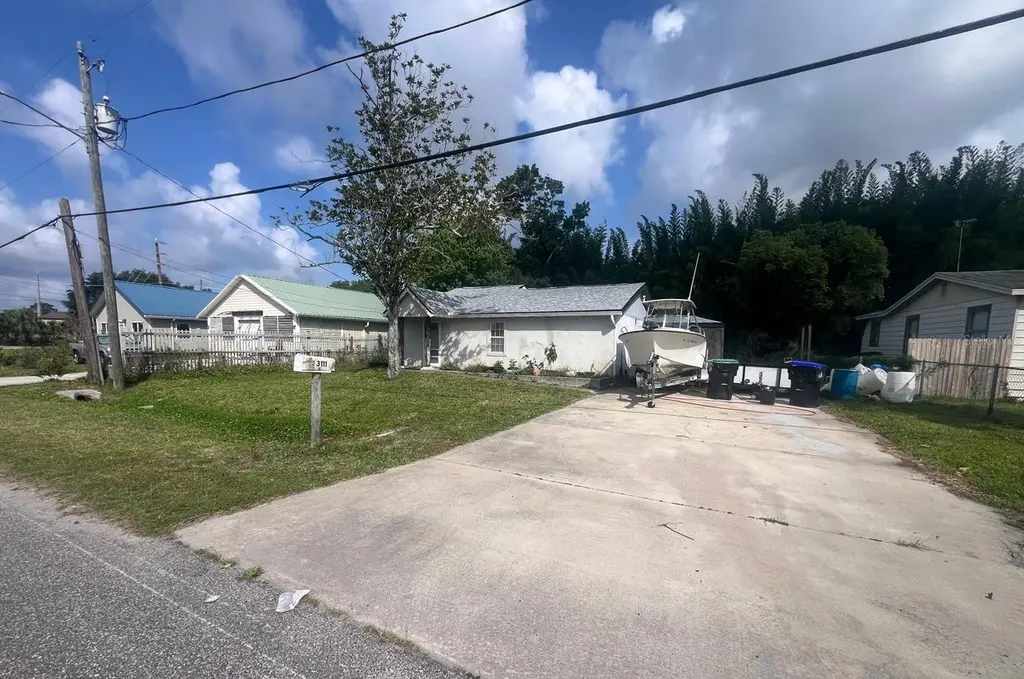
3111 Villa Dr · Lockhart, FL
Flood risk 1/10 · Minimal
- FEMA flood zone
- X (unshaded)
- Chance of flooding over 30 yrs
- 0.0%
- Est. flood insurance / yr
- $507 – $1,088
Fire risk 1/10 · Minimal
- Est. fire insurance / yr
- $947 – $1,759
Heat risk 8/10 · Major
- Hot days now (above 108°F)
- 7 days/yr
- Hot days in 30 yrs
- 22 days/yr
Wind risk 9/10 · Severe
- Chance of severe wind over 30 yrs
- 99.0%
Air-quality risk 2/10 · Minimal
- Unhealthy air days now
- 0 days/yr
- Unhealthy air days in 30 yrs
- 1 days/yr
Risk factors via First Street. Map © Google.
Why this score? — see what drove the C+ grade
The composite is a weighted blend of 9 inputs, each scored 0–100. Each bar is that input's sub-score; the figure is the points it added to the 100-point composite (weight × sub-score).
- Cash flow +22.9/30.0
- ARV discount +15.0/15.0
- DSCR +7.3/10.0
- 1% rule +4.8/10.0
- Schools +4.1/10.0
- Livability +3.8/5.0
- Rent growth +2.6/5.0
- Condition / age +2.5/5.0
- Appreciation +0.0/10.0
$189,000
🖨 Deal sheet (PDF) 📄 Offer letter ✓ Due diligence
Listing remarks MLS
BIG PRICE REDUCTION, BRING YOUR INVESTORS, OWNER SAYS SELL
Key facts
- Newer roof
- A/c
- Functional layout
Tags
Property features AI
Exterior
- Utilities: Public water; Septic sewer; Electricity connected; Water connected
- Home design: Single-family residence; One story; Northeast facing; Residential property
- Construction: Stucco and frame construction; Shingle roof; Crawlspace foundation; Built on one level
- Exterior features: Private mailbox; Storage
Interior
- Kitchen: Dishwasher; Microwave; Range; Refrigerator
- Bedrooms: 2 bedrooms
- Flooring: Carpet; Tile
- Bathrooms: 2 full bathrooms
- Heating & cooling: Central heating; Central air conditioning
- Interior features: Ceiling fans; Open floor plan
- Laundry & utility: Laundry room
Neighborhood map
What this means for you Summary
Snapshot
- This is a 3-bed/2.0-bath single-family listed at $189k.
Deal economics
- At list price, monthly cash flow is $332 ($4k/yr) — positive.
- The deal already cash-flows at list — no discount required.
- To meet the 1% rule (rent ≥ 1% of price), the offer needs to be $186k (1.7% below list).
- Recommended offer: $183k (3.0% below list) — sets the bar for market timing.
- Cap rate 8.4% vs local median 4.6% in Lockhart — top-decile yield for the area; either an underpriced asset or a hidden risk that comps aren't pricing in. Stress-test before assuming the spread holds.
Location & tenants
- Location reads 76/100 on livability (#228 in FL, #3,605 nationally) — a middle-class / working-renter tenant base. Strengths: commute A+, cost of living A+, housing A+; Watch: schools C-, amenities F, health & safety F.
- Orange (suburban): math 46% / reading 51% proficiency, ranked #43 of 73 in FL (top 59%) — families likely to look elsewhere, expect single-tenant / working-renter base with shorter leases.
- Market conditions: Rents flat; 159 active listings in the ZIP; 40 comparable units currently listed for rent nearby; rentals at typical pace (median 16d on market — plan ~3-4 weeks tenant-placement turnaround); 8,053 units permitted in Orange County in 2024 (3,133 in 5+ unit buildings).
- This rent runs 37% of the median local income ($61k/yr) — at the standard rent-burdened threshold; future hikes will face affordability resistance.
Forward outlook
- Local home prices are declining (-3.0%/yr); year-one equity from $1k of loan paydown is wiped out by about $6k of value loss. Plan a longer hold.
- Orange County population projected at +52% by 2050 — long-run rental-demand tailwind backs the buy-and-hold thesis.
Negotiation context
- It's been on market 37 days — a 3% lower offer ($183k) is reasonable based on typical stale-listing flexibility.
- 3 sale attempts since 22y ago with the ask held roughly flat each time — persistent listings suggest the price (not the market) is what's stuck; bring a comps-based counter.
- Current owner paid $112k; list at $189k implies a 69% gain — meaningful room to come down on a strong offer.
Risks & watch-outs
- Watch-outs: built in 1948 — expect roof / HVAC / electrical / plumbing capex.
- Climate carrying-cost: severe wind risk, 99% chance of damaging wind over 30y; extreme-heat days projected 7→22/yr by 2055 (HVAC capex compounding) — expect insurance premiums to compound above CPI over the hold.
Questions for the listing agent
- It's been on market 37 days. Have you received any prior offers? Is the seller open to a 3% concession, seller financing, or rate buy-down credit?
- Built in 1948 — when were the roof, HVAC, electrical panel, plumbing, and water heater last replaced?
- Is there a deadline driving the sale (1031 exchange, divorce, estate, relocation)? That informs how much negotiation room exists.
- What's the average days-on-market for RENTAL listings here right now (not sales)? A rising rental-DOM trend means longer vacancies and softer asking-rent achievability than the comps imply.
- What's the recent tenant-quality profile in this submarket — average credit score on applications, eviction rate, late-payment / NSF rate, and stable-employment percentage? A property-management company in the area should have these aggregated.
- How much new for-sale + rental construction is in the pipeline within 1–3 miles? Heavy new supply typically softens prices + rents 12–24 months out; constrained supply supports both.
Investment metrics
- 1% rule
- 0.98% ✗
- Cap rate
- 8.40%
- Cash-on-cash
- 7.52%
- DSCR
- 1.33
- GRM
- 8.5
CMA / ARV
- ARV (on-the-fly)
- $287,232
- Comps found
- 3
Show comp detail 3 sales within ~0.75 mi
| Address | Dist | Beds/Ba | Sqft | Sold | Price | $/sf | Match |
|---|---|---|---|---|---|---|---|
| 3112 Kathleen Dr | 0.52mi | 3/1.0 | 1,106 (+2%) | 2mo | $220,000 | $199 | 68 |
| 5408 Milan Dr | 0.41mi | 3/2.0 | 1,231 (+13%) | 1mo | $325,000 | $264 | 58 |
| 5706 Satel Dr | 0.55mi | 2/2.0 (-1) | 1,060 (-3%) | 14mo | $410,000 | $387 | 54 |
Match score weights: distance 35% · size 25% · config 20% · recency 20%. Top-matched comps best support the ARV.
Projected returns pro-forma
-3.0% appreciation · 0.5% rent growth · sell at horizon
- IRR
- -7.4%
- Equity multiple
- 0.73×
- Total profit
- $-14,144
- Equity at exit
- $28,181
- IRR
- -1.0%
- Equity multiple
- 0.94×
- Total profit
- $-3,227
- Equity at exit
- $16,341
Cash invested: $52,920 (down + closing). Projections, not guarantees.
Landlord ↔ Tenant lean methodology
- Overall (STATE)
- 87 Strongly Landlord-Friendly
- State Florida
- 87 Strongly Landlord-Friendly · R+3
- County
- — inherits STATE
- City
- — inherits STATE
ZIP-level market 32810
- Home prices YoY
- -18.5%
- Rents YoY
- 0.5%
- Active inventory
- 159
- Price-to-rent
- 8.5×
Monthly cashflow live
- Estimated rent
- $1,857 high interval (Pro) →
- Mortgage (P&I)
- −$991
- Tax from tax record
- −$66 /mo · $791/yr
- Insurance
- −$79
- HOA
- −$0
- Vacancy / Maint / Mgmt
- −$390
- Net cashflow
- $332
Break-even live
Sensitivity live
| Price | -10% $439 | -5% $385 | +0% $332 | +5% $278 | +10% $225 |
|---|---|---|---|---|---|
| Rent | -10% $185 | -5% $258 | +0% $332 | +5% $405 | +10% $478 |
| Rate | -1.0pp $427 | -0.5pp $380 | base $332 | +0.5pp $283 | +1.0pp $233 |
UW: 25.0% down · 7.5% · 30yr · 1.5% tax · 5.0% vac · 8.0% maint · 8.0% mgmt
Financing live
Cash to close
- Down payment
- $47,250
- Closing costs
- $5,670
- Reserves months
- —
- Total cash needed
- —
Loan-product check · same deal, 3 products live
Conventional
25% down · 7.5% · 30yr
- Down + closing
- —
- Monthly P&I
- —
- Monthly cashflow
- —
- DSCR
- —
- Eligible?
- —
Personal DTI + credit; lowest rate.
DSCR
20% down · 8.5% · 30yr
- Down + closing
- —
- Monthly P&I
- —
- Monthly cashflow
- —
- DSCR
- —
- Eligible?
- —
No personal income docs; deal must DSCR.
Hard money
10% down · 12.0% · 12mo
- Down + closing
- —
- Monthly P&I
- —
- Monthly cashflow
- —
- DSCR
- —
- Eligible?
- —
Short-term bridge; refi at stabilization.
Rent comps 40 comps
| Address | Beds | Baths | Sqft | Rent | $/sqft | DOM | Units | Dist |
|---|---|---|---|---|---|---|---|---|
| 7120 Forest City Rd Orlando, FL | 1.0–3.0 | 1.0–2.0 | 912 | $1,499 | $1.64 | 8d | 11 | 0.53mi |
| 5200 N Orange Blossom Trl Orlando, FL | 1.0–3.0 | 1.0–2.0 | 976 | $1,624 | $1.66 | 15d | 1 | 0.71mi |
| 3911 Alpert Dr Orlando, FL | 3.0 | 2.0 | 1278 | $1,795 | $1.40 | 2d | 1 | 0.75mi |
| 3940 Alpert Dr Orlando, FL | 3.0 | 1.5 | 1100 | $1,695 | $1.54 | 15d | 1 | 0.77mi |
| 110 Zora Pl Orlando, FL | 1.0–3.0 | 1.0–2.0 | 1090 | $2,644 | $2.43 | 8d | 9 | 0.77mi |
| 6741 Magnolia Pointe Cir Orlando, FL | 3.0 | 2.0 | 1248 | $1,695 | $1.36 | 24d | 1 | 0.79mi |
| 3908 Magnolia Pointe Ln Orlando, FL | 3.0 | 2.0 | 1208 | $1,795 | $1.49 | 24d | 1 | 0.82mi |
| 5536 Cinderlane Pkwy Orlando, FL | 1.0–2.0 | 1.5–2.0 | 1077 | $1,699 | $1.58 | 2d | 7 | 0.84mi |
| 1700 Van Ness St Orlando, FL | 2.0 | 1.0 | 920 | $1,699 | $1.85 | 13d | 1 | 0.90mi |
| 1700 Van Ness St Unit 5 Orlando, FL | 2.0 | 1.0 | 920 | $1,899 | $2.06 | 20d | 1 | 0.90mi |
| 5300 Cinderlane Pkwy Orlando, FL | 1.0–2.0 | 1.0–2.0 | 824 | $1,880 | $2.28 | 3d | 2 | 0.91mi |
| 7618 Forest City Rd Orlando, FL | 1.0–3.0 | 1.0–2.0 | 937 | $1,662 | $1.77 | 5d | 3 | 0.92mi |
| 2200 Flagler Promenade Way Maitland, FL | 1.0–3.0 | 1.0–2.0 | 1093 | $2,729 | $2.50 | 2d | 24 | 0.92mi |
| 6750 Woodlake Dr Orlando, FL | 1.0–2.0 | 1.0–2.0 | 797 | $1,700 | $2.13 | 3d | 18 | 0.93mi |
| 5205 Eggleston Ave Unit 102 Orlando, FL | 3.0 | 2.0 | 1219 | $1,895 | $1.55 | 15d | 1 | 0.97mi |
| 5175 Cinderlane Pkwy Orlando, FL | 1.0–2.0 | 1.0–2.0 | 751 | $1,565 | $2.08 | 3d | 27 | 0.97mi |
| 5315 Davisson Ave Orlando, FL | 2.0 | 1.0 | 831 | $1,350 | $1.62 | 24d | 1 | 0.97mi |
| 3717 Clubside Pointe Dr Unit 1 Orlando, FL | 3.0 | 3.0 | 1344 | $2,100 | $1.56 | 24d | 1 | 0.98mi |
| 3757 Clubside Pointe Dr Orlando, FL | 3.0 | 2.0 | 1264 | $1,750 | $1.38 | 24d | 1 | 1.00mi |
| 6998 Woodlake Dr Orlando, FL | 2.0 | 2.5 | 1053 | $1,600 | $1.52 | 24d | 1 | 1.01mi |
| 4414 Cluster Dr #4414 Orlando, FL | 2.0 | 2.5 | 1444 | $1,800 | $1.25 | 24d | 1 | 1.04mi |
| 3979 Versailles Dr Orlando, FL | 2.0 | 2.0 | 1183 | $1,450 | $1.23 | 24d | 1 | 1.05mi |
| 1821 Courtland St Orlando, FL | 3.0 | 2.0 | 1428 | $2,299 | $1.61 | 15d | 1 | 1.06mi |
| 4023 Versailles Dr Unit 4023F Orlando, FL | 3.0 | 2.0 | 1348 | $1,750 | $1.30 | 15d | 1 | 1.07mi |
| 4106 Dijon Dr Unit 4106E Orlando, FL | 2.0 | 2.0 | 1165 | $1,395 | $1.20 | 24d | 1 | 1.08mi |
| 4713 Thorpe Ave Orlando, FL | 2.0 | 2.0 | 1000 | $1,950 | $1.95 | 24d | 1 | 1.09mi |
| 4022 Versailles Dr Unit C Orlando, FL | 2.0 | 2.0 | 1165 | $1,350 | $1.16 | 18d | 1 | 1.10mi |
| 3806 Groome Dr Orlando, FL | 3.0 | 2.0 | 1111 | $2,400 | $2.16 | 24d | 1 | 1.11mi |
| 4114 Dijon Dr Unit 4114E Orlando, FL | 2.0 | 2.0 | 1165 | $1,400 | $1.20 | 24d | 1 | 1.12mi |
| 4170 Versailles Dr Orlando, FL | 2.0 | 2.0 | 1165 | $1,199 | $1.03 | 24d | 1 | 1.12mi |
| 4160 Versailles Dr Unit 4160D Orlando, FL | 2.0 | 2.0 | 1165 | $1,450 | $1.24 | 24d | 1 | 1.12mi |
| 4176 Versailles Dr Unit D Orlando, FL | 2.0 | 2.0 | 1165 | $1,350 | $1.16 | 24d | 1 | 1.12mi |
| 5234 Journal Ave Orlando, FL | 2.0 | 1.0 | 720 | $1,600 | $2.22 | 17d | 1 | 1.14mi |
| 1440 Lake Shadow Cir Maitland, FL | 2.0 | 2.0 | 1048 | $1,550 | $1.48 | 15d | 1 | 1.15mi |
| 1375 Lake Shadow Cir Maitland, FL | 2.0 | 1.0 | 884 | $1,550 | $1.75 | 12d | 1 | 1.16mi |
| 1325 Lake Shadow Cir #12104 Maitland, FL | 2.0 | 2.0 | 1048 | $1,550 | $1.48 | 8d | 1 | 1.20mi |
| 5224 Long Rd Orlando, FL | 2.0–4.0 | 1.5–2.5 | 1426 | $1,754 | $1.23 | 3d | 17 | 1.21mi |
| 1475 Lake Shadow Cir Maitland, FL | 2.0 | 2.0 | 1130 | $1,912 | $1.69 | 18d | 3 | 1.21mi |
| 1475 Lake Shadow Cir Maitland, FL | 2.0 | 2.0 | 1130 | $1,912 | $1.69 | 15d | 2 | 1.21mi |
| 1475 Lake Shadow Cir #6202 Maitland, FL | 2.0 | 2.0 | 1150 | $2,300 | $2.00 | 13d | 1 | 1.21mi |
Listing history 20 events
-
2026-06-17status $189,000 Pending 37 DOM
-
2026-06-17days on market $189,000 Active 37 DOM
-
2026-06-16days on market $189,000 Active 36 DOM
-
2026-06-15days on market $189,000 Active 35 DOM
-
2026-06-13days on market $189,000 Active 33 DOM
-
2026-06-13days on market $189,000 Active 32 DOM
-
2026-06-09days on market $189,000 Active 29 DOM
-
2026-06-08days on market $189,000 Active 28 DOM
-
2026-06-07days on market $189,000 Active 27 DOM
-
2026-06-04days on market $189,000 Active 24 DOM
-
2026-06-03days on market $189,000 Active 23 DOM
-
2026-06-02days on market $189,000 Active 22 DOM
-
2026-06-01days on market $189,000 Active 21 DOM
-
2026-05-31days on market $189,000 Active 20 DOM
-
2026-05-11$189,000 Active
-
2006-08-23soldstatus $111,800
-
2006-07-31soldstatus $111,750 58-char remark
Show marketing remark (58 chars)
BIG PRICE REDUCTION, BRING YOUR INVESTORS, OWNER SAYS SELL
-
2006-04-04$114,000 58-char remark
Show marketing remark (58 chars)
BIG PRICE REDUCTION, BRING YOUR INVESTORS, OWNER SAYS SELL
-
2004-10-20historical
-
2004-06-16$95,000
ⓘ Source: listings_history table (triggers on properties + properties_extension) + one-shot
backfill from property_details.listing_events for pre-trigger history.
Tax reassessment forecast FL · Resets to sale price
- Current annual tax
- $791 · $66/mo
- Projected year-2 tax
- $1,569 · $131/mo
- Expected delta
- +$778/yr (+$65/mo · 98.3%)
ⓘ Screening estimate from a state-policy table — verify with the county assessor before closing.
Climate risk First Street
- Flood 1/10 Low FEMA zone X (unshaded) · 0% chance over 30 yrs
- Wildfire 1/10 Low
- Heat 8/10 Severe 7 d/yr ≥108°F today · 22 d/yr by 30 yrs out
- Wind 9/10 Extreme 99% chance of damaging wind over 30 yrs
- Air quality 2/10 Low 0 unhealthy d/yr today · 1 by 30 yrs out
Nearby sold comps map
Loading sold comps map…
Walkable amenities ~0.75 mi
Loading nearby amenities…
Taxation est. · year 1
- Rental income
- $22,289
- − Mortgage interest
- −$10,587
- − Property taxes
- −$791
- − Insurance
- −$945
- − Repairs & maintenance
- −$1,783
- − Management
- −$1,783
- − Depreciation
- −$5,498
- Taxable income
- $902
- Est. tax owed @ 24.0%
- −$216
- After-tax cash flow
- $3,762/yr
For passive investors: Depreciation is non-cash, so a rental often shows a tax loss while cash-flowing — sheltering income. Rental losses are passive: they offset passive income freely, and up to $25,000/yr can offset ordinary (W-2) income if you actively participate and your MAGI is under $100k (phasing out to $0 by $150k); unused losses carry forward. On sale, claimed depreciation is recaptured at up to 25%, and gains may owe capital-gains tax (a 1031 exchange can defer both). Figures are a year-1 estimate at your 24.0% rate — not tax advice; consult a CPA.
Schools (NCES district)
- District
- Orange
- NCES district ID
- 1201440
- Math proficiency
- 46% ▼ -9.00%
- Reading proficiency
- 51% ▼ -2.00%
- Median HH income
- $49,350
- Composite
- 41.47/100
- National rank
- #3461
- State rank
- #43 of 73 in FL
Livability — Lockhart
- Score
- 76/100
- State rank
- #228
- US rank
- #3605
Category grades
Schools grade is shown separately in the Schools card above.
Census & demographics
- Census place
- Lockhart, FL
- County
- Orange County · 1,471,359 people
- City population
- 37,127
- Metro
- Orlando-Kissimmee-Sanford, FL
- Population (ZIP)
- 36,927
- Household income
- $60,799
- Rent vs Own
- Severe rent burden
- 1859.0
Population outlook (Orange County) Hauer SSP2
- Today (2025)
- 1,618,226 people
- By 2030
- 1,787,404 · +10.5%
- By 2040
- 2,125,621 · +31.4%
- By 2050
- 2,454,016 · +51.6%
- By 2075
- 3,173,711 · +96.1%
- By 2100
- 3,607,781 · +122.9%
Race, ethnicity, and origin ACS 2023
- Neighborhood character
- Highly diverse neighborhood (Simpson 0.72)
- Race & ethnicity
- Black 35% Hispanic / Latino 29% White 25% Two or more races 16% Asian 3% Native American 1%
- Hispanic origin (detail)
- Mexican 2% Puerto Rican 17% Cuban 3%
- Common ancestry
- Hispanic 9% Lithuanian 1% Slovak 1%
- Foreign-born
- 19% · Canada, Vietnam, Jamaica
- Languages at home
- 67% English-only · Spanish 21% French/Haitian/Cajun 7% Other Indo-European 1%
Political lean MEDSL · Orange
- 2024 margin
- D (+13.6) · D 56.1% · R 42.5% · Other 1.3%
- 2008→2024 swing
- -5.0pp toward R · 2008: 18.6pp · 2024: 13.6pp
- All cycles
- 2024: D+13.6 2020: D+23.1 2016: D+24.6 2012: D+18.2 2008: D+18.6
Not yet ingested
- Civics
- —
Market trends
- HPI YoY
- ▼ -78.77%
- Current HPI
- 347.7447
- Rent YoY
- ▲ 0.50%
- Metro
- Orlando-Kissimmee-Sanford, FL
- State GDP YoY
- ▲ 3.28%
- F500 in state
- 36
Industry mix (Fortune 500 HQ in FL)
| Industry | F500 HQs | Revenue |
|---|---|---|
| Industrial Technology | 2 | $29B |
|
||
| Insurance | 2 | $17B |
|
||
| Retail | 1 | $60B |
|
||
| Technology Distribution | 1 | $58B |
|
||
| Homebuilding | 1 | $35B |
|
||
| Technology Manufacturing | 1 | $35B |
|
||
Price history
+98.9% since first listed6 events — show timeline
- 2026-05-11 Listed $189,000 Stellar MLS as Distributed by MLS Grid
- 2006-08-23 Sold (Public Records) $111,800 Public Records
- 2006-07-31 Sold (MLS) $111,750 Stellar MLS as Distributed by MLS Grid
- 2006-04-04 Listed $114,000 Stellar MLS as Distributed by MLS Grid
- 2004-10-20 Listing Removed — Stellar MLS as Distributed by MLS Grid
- 2004-06-16 Listed $95,000 Stellar MLS as Distributed by MLS Grid
Property tax history
+2.3%/yrLatest (2025): $791 · +17.8% YoY. Source: county tax records.
Cash-flow waterfall
monthlySold comps — $/sqft
last 12 mo · ≤1 miLoading sold comps…