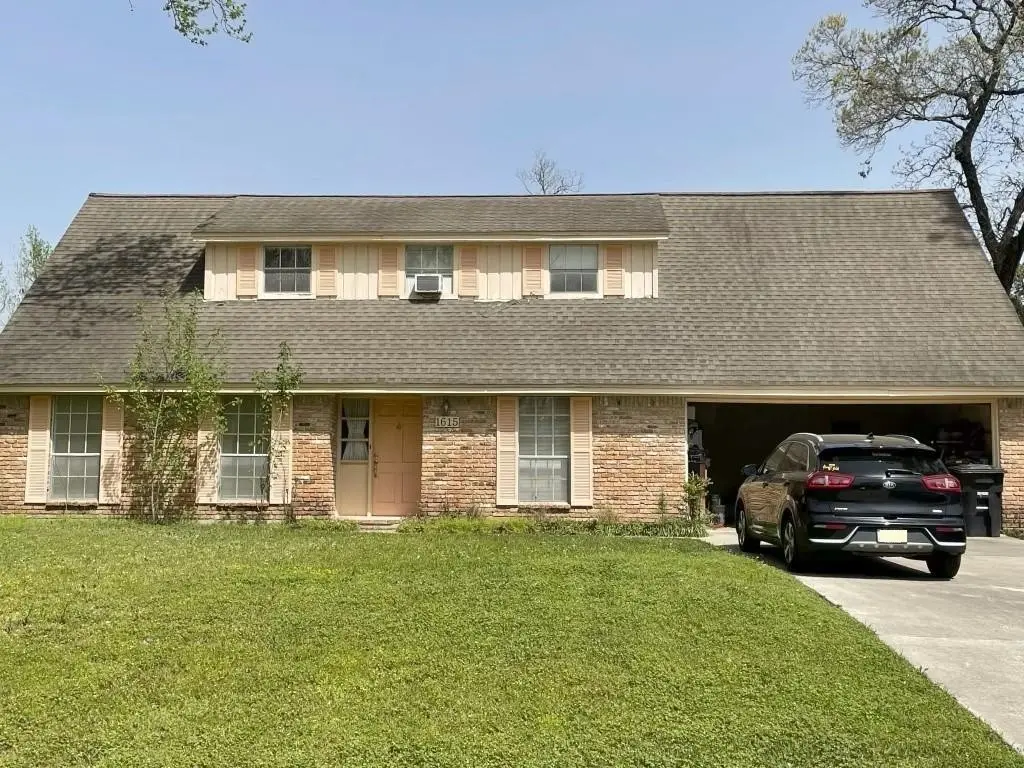
1615 Hill Top Ln · Houston, TX
Flood risk 1/10 · Minimal
- FEMA flood zone
- X (unshaded)
- Chance of flooding over 30 yrs
- 0.0%
- Est. flood insurance / yr
- $507 – $1,088
Fire risk 2/10 · Minimal
- Est. fire insurance / yr
- $1,222 – $2,270
Heat risk 8/10 · Major
- Hot days now (above 110°F)
- 7 days/yr
- Hot days in 30 yrs
- 24 days/yr
Wind risk 9/10 · Severe
- Chance of severe wind over 30 yrs
- 99.0%
Air-quality risk 3/10 · Minor
- Unhealthy air days now
- 3 days/yr
- Unhealthy air days in 30 yrs
- 3 days/yr
Risk factors via First Street. Map © Google.
Why this score? — see what drove the D grade
The composite is a weighted blend of 9 inputs, each scored 0–100. Each bar is that input's sub-score; the figure is the points it added to the 100-point composite (weight × sub-score).
- ARV discount +14.7/15.0
- Cash flow +6.0/30.0
- Appreciation +5.2/10.0
- Schools +3.9/10.0
- Livability +3.7/5.0
- Condition / age +2.5/5.0
- Rent growth +2.4/5.0
- 1% rule +1.6/10.0
- DSCR +0.3/10.0
$340,000
🖨 Deal sheet 📄 Offer letter ✓ Due diligence
Listing remarks MLS
Built in 1965, this spacious 3,010 sq ft home offers 4 bedrooms and 2 bathrooms and is filled with history, character, and lasting craftsmanship. Originally built from the ground up by the homeowner, this residence reflects care, intention, and pride of ownership throughout the years. Known for its strong structure and solid bones, it presents an incredible opportunity for the next owner to bring their vision to life. A unique feature of the property is the tulip tree, planted years ago as a symbol of love and family. Over time, it has stood as a quiet reminder of the life and memories created here. This is more than just a house—it’s a home with a story, ready for its next chapter.
Key facts
- 0.29 acre lot
- 2 garage spots
- Built 1965
Neighborhood map
What this means for you Summary
Snapshot
- This is a 4-bed/2.0-bath single-family listed at $340k.
Deal economics
- At list price, monthly cash flow is $-655 ($-8k/yr) — negative.
- To cash-flow at today's rent, offer at most $224k (34.0% below list).
- To meet the 1% rule (rent ≥ 1% of price), the offer needs to be $225k (33.7% below list).
- Recommended offer: $224k (34.0% below list) — sets the bar for cash-flow.
- Cap rate 4.0% vs local median 3.2% in Houston — meaningfully above typical; check what's discounted (condition, days-on-market, listing class) to confirm the premium yield is real.
Location & tenants
- Location reads 74/100 on livability (#184 in TX, #4,771 nationally) — a middle-class / working-renter tenant base. Strengths: amenities A+, cost of living A+, housing A+; Watch: schools D, crime F.
- Humble ISD (urban): math 38% / reading 44% proficiency, ranked #262 of 826 in TX (top 32%) — families likely to look elsewhere, expect single-tenant / working-renter base with shorter leases.
- Market conditions: Rents soft (-0.6%/yr); 311 active listings in the ZIP; 2 comparable units currently listed for rent nearby; solid renter incomes; 29,883 units permitted in Harris County in 2024 (8,621 in 5+ unit buildings).
- This rent runs 32% of the median local income ($84k/yr) — at the standard rent-burdened threshold; future hikes will face affordability resistance.
Forward outlook
- In year one you build about $4k of equity ($2k loan paydown + $2k appreciation (0.5% local appreciation)).
- Harris County population projected at +47% by 2050 — long-run rental-demand tailwind backs the buy-and-hold thesis.
- By year 8, paydown + projected appreciation supports a ~$35k cash-out refi (75% LTV) — recoverable capital for the next deal without selling this one.
Negotiation context
- It's been on market 65 days — a 6% lower offer ($320k) is reasonable based on typical stale-listing flexibility.
Risks & watch-outs
- Climate carrying-cost: severe wind risk, 99% chance of damaging wind over 30y; extreme-heat days projected 7→24/yr by 2055 (HVAC capex compounding) — expect insurance premiums to compound above CPI over the hold.
Questions for the listing agent
- What do current leases actually rent for vs. the listed asking? Can we see a recent rent roll and the last 12 months of T-12 income?
- It's been on market 65 days. Have you received any prior offers? Is the seller open to a 34% concession, seller financing, or rate buy-down credit?
- Built in 1965 — when were the roof, HVAC, electrical panel, plumbing, and water heater last replaced?
- Why hasn't it sold? Are there any deal-killer items the seller is aware of (foundation, flood, title, zoning, code violations)?
- Is there a deadline driving the sale (1031 exchange, divorce, estate, relocation)? That informs how much negotiation room exists.
- Schools are D-rated, which usually means shorter tenancies and higher turnover. Who's the typical renter profile here, and what's been the actual vacancy rate?
- Crime grade is F in this area — have there been break-ins, vandalism, or insurance claims at this property in the last 3 years? What carrier currently insures it and at what premium?
- The area grade is low — what's the realistic commute time and amenity access for the typical tenant pool here? Any planned neighborhood developments (good or bad) we should know about?
- What's the average days-on-market for RENTAL listings here right now (not sales)? A rising rental-DOM trend means longer vacancies and softer asking-rent achievability than the comps imply.
- What's the recent tenant-quality profile in this submarket — average credit score on applications, eviction rate, late-payment / NSF rate, and stable-employment percentage? A property-management company in the area should have these aggregated.
- How much new for-sale + rental construction is in the pipeline within 1–3 miles? Heavy new supply typically softens prices + rents 12–24 months out; constrained supply supports both.
Investment metrics
- 1% rule
- 0.66% ✗
- Cap rate
- 3.98%
- Cash-on-cash
- -8.26%
- DSCR
- 0.63
- GRM
- 12.6
CMA / ARV
- ARV (median comp)
- $404,746
- List price
- $340,000
- Delta
- -16.00%
- Verdict
- UNDERPRICED
- Comps
- 20 within 1.0 mi
Show comp detail 11 sales within ~0.75 mi
| Address | Dist | Beds/Ba | Sqft | Sold | Price | $/sf | Match |
|---|---|---|---|---|---|---|---|
| 1615 Hill Top Ln | 0.00mi | 4/2.0 | 3,010 (0%) | 0mo | $340,000 | $113 | 100 |
| 1742 Hill Top Ln | 0.22mi | 5/2.5 (+1) | 3,100 (+3%) | 13mo | $425,000 | $137 | 66 |
| 1710 Magnolia Ln | 0.50mi | 4/3.0 | 3,174 (+5%) | 5mo | $654,900 | $206 | 59 |
| 1339 Trailwood Village Dr | 0.57mi | 4/2.5 | 2,728 (-9%) | 12mo | $399,500 | $146 | 46 |
| 1310 Hickory Ln | 0.38mi | 3/3.0 (-1) | 2,652 (-12%) | 10mo | $689,000 | $260 | 45 |
| 2114 Woodstream Dr | 0.62mi | 4/3.5 | 3,193 (+6%) | 12mo | $425,000 | $133 | 44 |
| 1501 Mistletoe Ln | 0.75mi | 4/3.5 | 3,108 (+3%) | 13mo | $890,000 | $286 | 43 |
| 1610 Mistletoe Ln | 0.69mi | 4/3.0 | 3,071 (+2%) | 22mo | $555,000 | $181 | 42 |
| 1303 Trailwood Village Dr | 0.59mi | 3/2.5 (-1) | 2,724 (-10%) | 14mo | $339,900 | $125 | 38 |
| 1431 Magnolia Ln | 0.57mi | 4/4.0 | 2,706 (-10%) | 15mo | $649,900 | $240 | 36 |
| 2027 Woodland Valley Dr | 0.75mi | 5/3.5 (+1) | 2,694 (-10%) | 1mo | $369,000 | $137 | 36 |
Match score weights: distance 35% · size 25% · config 20% · recency 20%. Top-matched comps best support the ARV.
Projected returns pro-forma
0.48% appreciation · 0.0% rent growth · sell at horizon
- IRR
- -11.1%
- Equity multiple
- 0.47×
- Total profit
- $-50,489
- Equity at exit
- $106,912
- IRR
- -6.7%
- Equity multiple
- 0.27×
- Total profit
- $-69,376
- Equity at exit
- $135,243
Cash invested: $95,200 (down + closing). Projections, not guarantees.
Landlord ↔ Tenant lean methodology
- Overall (STATE)
- 87 Strongly Landlord-Friendly
- State Texas
- 87 Strongly Landlord-Friendly · R+5
- County
- — inherits STATE
- City
- — inherits STATE
ZIP-level market 77339
- Home prices YoY
- 0.2%
- Rents YoY
- -0.6%
- Active inventory
- 311
- Price-to-rent
- 12.6×
Monthly cashflow live
- Estimated rent
- $2,253 medium interval (Pro) →
- Mortgage (P&I)
- −$1,783
- Tax from tax record
- −$510 /mo · $6,125/yr
- Insurance
- −$142
- HOA
- −$0
- Vacancy / Maint / Mgmt
- −$473
- Net cashflow
- $-655
Break-even live
UW: 25.0% down · 7.5% · 30yr · 1.5% tax · 5.0% vac · 8.0% maint · 8.0% mgmt
Financing live
Cash to close
- Down payment
- $85,000
- Closing costs
- $10,200
- Reserves months
- —
- Total cash needed
- —
Loan-product check · same deal, 3 products live
Conventional
25% down · 7.5% · 30yr
- Down + closing
- —
- Monthly P&I
- —
- Monthly cashflow
- —
- DSCR
- —
- Eligible?
- —
Personal DTI + credit; lowest rate.
DSCR
20% down · 8.5% · 30yr
- Down + closing
- —
- Monthly P&I
- —
- Monthly cashflow
- —
- DSCR
- —
- Eligible?
- —
No personal income docs; deal must DSCR.
Hard money
10% down · 12.0% · 12mo
- Down + closing
- —
- Monthly P&I
- —
- Monthly cashflow
- —
- DSCR
- —
- Eligible?
- —
Short-term bridge; refi at stabilization.
Rent comps 2 comps
| Address | Beds | Baths | Sqft | Rent | $/sqft | DOM | Units | Dist |
|---|---|---|---|---|---|---|---|---|
| 2003 Ridgeway Park Dr Kingwood, TX | 4.0 | 2.5 | 2477 | $1,850 | $0.75 | 44d | 1 | 1.20mi |
| 1735 Wilderness Park Ct Kingwood, TX | 3.0 | 2.5 | 2172 | $2,319 | $1.07 | 24d | 1 | 1.27mi |
Listing history 8 events
-
2026-06-07statusdays on market $340,000 Pending 65 DOM
-
2026-06-04days on market $340,000 Active 62 DOM
-
2026-06-03days on market $340,000 Active 61 DOM
-
2026-06-02days on market $340,000 Active 60 DOM
-
2026-06-01days on market $340,000 Active 59 DOM
-
2026-05-31days on market $340,000 Active 58 DOM
-
2026-04-03$340,000 Active 706-char remark
Show marketing remark (706 chars)
Built in 1965, this spacious 3,010 sq ft home offers 4 bedrooms and 2 bathrooms and is filled with history, character, and lasting craftsmanship. Originally built from the ground up by the homeowner, this residence reflects care, intention, and pride of ownership throughout the years. Known for its strong structure and solid bones, it presents an incredible opportunity for the next owner to bring their vision to life. A unique feature of the property is the tulip tree, planted years ago as a symbol of love and family. Over time, it has stood as a quiet reminder of the life and memories created here. This is more than just a house—it’s a home with a story, ready for its next chapter.
-
1988-01-02soldstatus
ⓘ Source: listings_history table (triggers on properties + properties_extension) + one-shot
backfill from property_details.listing_events for pre-trigger history.
Tax reassessment forecast TX · Resets to sale price
- Current annual tax
- $6,125 · $510/mo
- Projected year-2 tax
- $6,222 · $518/mo
- Expected delta
- +$97/yr (+$8/mo · 1.6%)
ⓘ Screening estimate from a state-policy table — verify with the county assessor before closing.
Climate risk First Street
- Flood 1/10 Low FEMA zone X (unshaded) · 0% chance over 30 yrs
- Wildfire 2/10 Low
- Heat 8/10 Severe 7 d/yr ≥110°F today · 24 d/yr by 30 yrs out
- Wind 9/10 Extreme 99% chance of damaging wind over 30 yrs
- Air quality 3/10 Moderate 3 unhealthy d/yr today · 3 by 30 yrs out
Nearby sold comps map
Loading sold comps map…
Walkable amenities ~0.75 mi
Loading nearby amenities…
Taxation est. · year 1
- Rental income
- $27,039
- − Mortgage interest
- −$19,045
- − Property taxes
- −$6,125
- − Insurance
- −$1,700
- − Repairs & maintenance
- −$2,163
- − Management
- −$2,163
- − Depreciation
- −$9,891
- Taxable loss
- −$14,049
- Est. tax savings @ 24.0%
- +$3,372
- After-tax cash flow
- $-4,489/yr
For passive investors: Depreciation is non-cash, so a rental often shows a tax loss while cash-flowing — sheltering income. Rental losses are passive: they offset passive income freely, and up to $25,000/yr can offset ordinary (W-2) income if you actively participate and your MAGI is under $100k (phasing out to $0 by $150k); unused losses carry forward. On sale, claimed depreciation is recaptured at up to 25%, and gains may owe capital-gains tax (a 1031 exchange can defer both). Figures are a year-1 estimate at your 24.0% rate — not tax advice; consult a CPA.
Schools (NCES district)
- District
- Humble ISD
- NCES district ID
- 4823910
- Math proficiency
- 38% ▼ -11.00%
- Reading proficiency
- 44% ▼ -7.00%
- Median HH income
- $83,946
- Composite
- 38.55/100
- National rank
- #4171
- State rank
- #262 of 826 in TX
Livability — Houston
- Score
- 74/100
- State rank
- #184
- US rank
- #4771
Category grades
Schools grade is shown separately in the Schools card above.
Census & demographics
- Census place
- Houston, TX
- County
- Harris County · 4,702,590 people
- City population
- 3,226,434
- Metro
- Houston-The Woodlands-Sugar Land, TX
- Population (ZIP)
- 44,538
- Household income
- $84,102
- Rent vs Own
- Severe rent burden
- 2198.0
Population outlook (Harris County) Hauer SSP2
- Today (2025)
- 5,571,493 people
- By 2030
- 6,089,821 · +9.3%
- By 2040
- 7,142,806 · +28.2%
- By 2050
- 8,185,864 · +46.9%
- By 2075
- 10,574,329 · +89.8%
- By 2100
- 12,109,958 · +117.4%
Race, ethnicity, and origin ACS 2023
- Neighborhood character
- Diverse neighborhood (Simpson 0.58)
- Race & ethnicity
- White 59% Hispanic / Latino 24% Two or more races 13% Black 5% Asian 5%
- Hispanic origin (detail)
- Mexican 17%
- Common ancestry
- Lithuanian 3% Slovak 2% Portuguese 2%
- Foreign-born
- 12% · Canada, China, Jamaica
- Languages at home
- 77% English-only · Spanish 17% Other Indo-European 2% Vietnamese 1%
Political lean MEDSL · Harris
- 2024 margin
- Lean D (+5.5) · D 52.0% · R 46.4% · Other 1.6%
- 2008→2024 swing
- +3.9pp toward D · 2008: 1.6pp · 2024: 5.5pp
- All cycles
- 2024: D+5.5 2020: D+13.3 2016: D+12.4 2012: D+0.1 2008: D+1.6
Not yet ingested
- Civics
- —
Market trends
- HPI YoY
- ▲ 0.48%
- Current HPI
- 233.4147
- Rent YoY
- ▼ -0.59%
- Metro
- Houston-The Woodlands-Sugar Land, TX
- State GDP YoY
- ▲ 3.95%
- F500 in state
- 110
Industry mix (Fortune 500 HQ in TX)
| Industry | F500 HQs | Revenue |
|---|---|---|
| Energy | 16 | $1,198B |
|
||
| Technology | 5 | $198B |
|
||
| Engineering / Construction | 4 | $72B |
|
||
| Energy Services | 3 | $60B |
|
||
| Utilities | 3 | $41B |
|
||
| Healthcare | 2 | $330B |
|
||
Price history
2 events — show timeline
- 2026-04-03 Listed $340,000 HARMLS
- 1988-01-02 Sold (Public Records) — Public Records
Property tax history
+6.0%/yrLatest (2025): $6,125 · +10.9% YoY. Source: county tax records.
Cash-flow waterfall
monthlySold comps — $/sqft
last 12 mo · ≤1 miLoading sold comps…