220 Manhattan Ave Unit 1F · New York, NY
Flood risk 1/10 · Minimal
- FEMA flood zone
- X (unshaded)
- Chance of flooding over 30 yrs
- 0.0%
- Est. flood insurance / yr
- $507 – $1,088
Fire risk 1/10 · Minimal
- Est. fire insurance / yr
- $691 – $1,283
Heat risk 6/10 · Moderate
- Hot days now (above 99°F)
- 7 days/yr
- Hot days in 30 yrs
- 15 days/yr
Wind risk 6/10 · Moderate
- Chance of severe wind over 30 yrs
- 27.0%
Air-quality risk 4/10 · Minor
- Unhealthy air days now
- 5 days/yr
- Unhealthy air days in 30 yrs
- 6 days/yr
Risk factors via First Street. Map © Google.
Why this score? — see what drove the D grade
The composite is a weighted blend of 9 inputs, each scored 0–100. Each bar is that input's sub-score; the figure is the points it added to the 100-point composite (weight × sub-score).
- Appreciation +7.6/10.0
- Cash flow +7.5/30.0
- ARV discount +7.5/15.0
- Schools +5.0/10.0
- Livability +3.8/5.0
- 1% rule +3.4/10.0
- Rent growth +3.1/5.0
- Condition / age +2.5/5.0
- DSCR +1.6/10.0
$649,000
🖨 Deal sheet 📄 Offer letter ✓ Due diligence
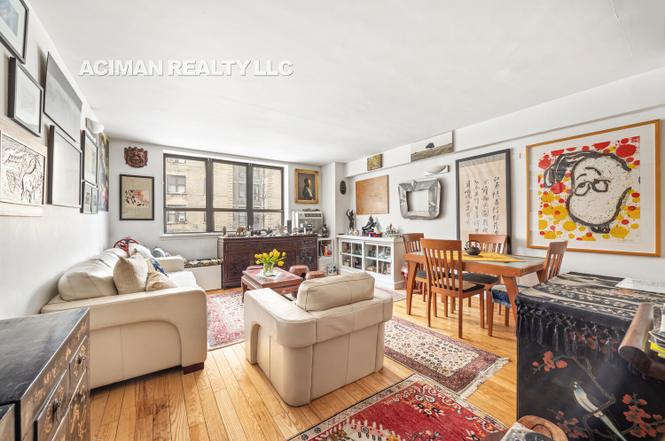
Listing remarks
Enjoy the vivid richness of an active life near Central Park and Morningside Park. Welcome to Towers on the Park Condominium. Apartment #1F is a renovated, very spacious, bright and quiet 1-bedroom apartment in impeccable move in condition. A rare gem that must be seen! And, an excellent value! This charming apartment perfectly meets the needs and expectations of today's buyers seeking value, growth and comfort--whether you're looking to entertain guests or working from home. In a thriving and exciting location on Manhattan's Upper West Side, Apartment #1F has low monthly common charges and very tasteful finishes throughout. The kitchen and bathroom were beautifully upgraded, as were the w
Key facts
- Upgraded bathroom
- Live in super
- Wood floors
Tags
Property features AI
Finance
- Other: Building has 342 total units
- HOA & community: Monthly association fee of $576; Building amenities include bike storage and a game room; Pets allowed (cats permitted)
Exterior
- Parking: Has garage
- Home design: Apartment/Condominium in an 8-story building; Building name: Towers On The Park; Zoning: C1-9
- Construction: Construction details not provided
- Exterior features: No notable exterior features listed; West-facing exposure; Entry at level 1
Interior
- Kitchen: Dishwasher
- Bedrooms: Information not provided
- Bathrooms: 1 full bathroom
- Interior features: Has basement; Total of 3 rooms; Has view
- Laundry & utility: Building laundry
Neighborhood map
What this means for you Summary
Snapshot
- This is a 1-bed/1.0-bath condo listed at $649k.
Deal economics
- At list price, monthly cash flow is $-813 ($-10k/yr) — negative.
- To cash-flow at today's rent, offer at most $505k (22.1% below list).
- To meet the 1% rule (rent ≥ 1% of price), the offer needs to be $545k (16.1% below list).
- Recommended offer: $505k (22.1% below list) — sets the bar for cash-flow.
- Cap rate 4.8% vs local median 2.6% in New York — top-decile yield for the area; either an underpriced asset or a hidden risk that comps aren't pricing in. Stress-test before assuming the spread holds.
Location & tenants
- Location reads 75/100 on livability (#268 in NY, #4,188 nationally) — a middle-class / working-renter tenant base. Strengths: amenities A+, commute A+, health & safety A; Watch: crime F, cost of living F.
- Market conditions: Rents rising (+2.5%/yr); 96 active listings in the ZIP; 27 comparable units currently listed for rent nearby; rentals leasing fast (median 4d on market — plan ~1-2 weeks tenant-placement turnaround); solid renter incomes; 4,467 units permitted in New York County in 2024 (4,463 in 5+ unit buildings).
- At $5,447/mo this rent would consume 80% of the median local household income ($81k/yr) (locally 2685% of renters already pay >50% of income on rent) — very limited rent-growth headroom before tenants either downsize or default.
Forward outlook
- In year one you build about $39k of equity ($4k loan paydown + $34k appreciation (5.3% local appreciation)).
- New York County population projected at +21% by 2050 — long-run rental-demand tailwind backs the buy-and-hold thesis.
- By year 2, paydown + projected appreciation supports a ~$62k cash-out refi (75% LTV) — recoverable capital for the next deal without selling this one.
Negotiation context
- It's been on market 125 days — a 12% lower offer ($571k) is reasonable based on typical stale-listing flexibility.
- Current owner paid $388k; list at $649k implies a 67% gain — meaningful room to come down on a strong offer.
Risks & watch-outs
- Climate carrying-cost: major wind risk, 27% chance of damaging wind over 30y; extreme-heat days projected 7→15/yr by 2055 (HVAC capex compounding) — expect insurance premiums to compound above CPI over the hold.
Questions for the listing agent
- What do current leases actually rent for vs. the listed asking? Can we see a recent rent roll and the last 12 months of T-12 income?
- It's been on market 125 days. Have you received any prior offers? Is the seller open to a 22% concession, seller financing, or rate buy-down credit?
- What does the HOA fee cover, when was the last increase, and are there any pending special assessments or reserve-fund shortfalls?
- Any open or pending special assessments — roof, HVAC, plumbing, elevator, façade? What's the per-unit balance and payoff schedule, and is the seller paying it off at close or rolling it to the buyer?
- Why hasn't it sold? Are there any deal-killer items the seller is aware of (foundation, flood, title, zoning, code violations)?
- Is there a deadline driving the sale (1031 exchange, divorce, estate, relocation)? That informs how much negotiation room exists.
- Schools are B-rated — typically a magnet for longer-tenancy family renters. What's the average tenant stay here, and is there a school-zone premium baked into asking?
- Crime grade is F in this area — have there been break-ins, vandalism, or insurance claims at this property in the last 3 years? What carrier currently insures it and at what premium?
- The area grade is low — what's the realistic commute time and amenity access for the typical tenant pool here? Any planned neighborhood developments (good or bad) we should know about?
- What's the average days-on-market for RENTAL listings here right now (not sales)? A rising rental-DOM trend means longer vacancies and softer asking-rent achievability than the comps imply.
- What's the recent tenant-quality profile in this submarket — average credit score on applications, eviction rate, late-payment / NSF rate, and stable-employment percentage? A property-management company in the area should have these aggregated.
- How much new apartment / multifamily construction is in the pipeline within 1–3 miles? Heavy new supply (>2% of stock underway) typically softens rents 12–24 months out; light construction supports rent growth.
Investment metrics
- 1% rule
- 0.84% ✗
- Cap rate
- 4.79%
- Cash-on-cash
- -5.37%
- DSCR
- 0.76
- GRM
- 9.9
CMA / ARV
No comps found within radius.
Projected returns pro-forma
5.26% appreciation · 2.46% rent growth · sell at horizon
- IRR
- 8.9%
- Equity multiple
- 1.58×
- Total profit
- $104,927
- Equity at exit
- $377,999
- IRR
- 10.3%
- Equity multiple
- 2.94×
- Total profit
- $353,022
- Equity at exit
- $660,984
Cash invested: $181,720 (down + closing). Projections, not guarantees.
Landlord ↔ Tenant lean methodology
- Overall (CITY)
- 0 Strongly Tenant-Friendly
- State New York
- 15 Strongly Tenant-Friendly · D+10
- County
- — inherits STATE
- City New York
- 0 Strongly Tenant-Friendly · D+34
ZIP-level market 10026
- Home prices YoY
- 1.6%
- Rents YoY
- 2.5%
- Active inventory
- 96
- Price-to-rent
- 9.9×
Monthly cashflow live
- Estimated rent
- $5,447 high interval (Pro) →
- Mortgage (P&I)
- −$3,403
- Tax from tax record
- −$867 /mo · $10,401/yr
- Insurance
- −$270
- HOA
- −$576
- Vacancy / Maint / Mgmt
- −$1,144
- Net cashflow
- $-813
Break-even live
UW: 25.0% down · 7.5% · 30yr · 1.5% tax · 5.0% vac · 8.0% maint · 8.0% mgmt
Financing live
Cash to close
- Down payment
- $162,250
- Closing costs
- $19,470
- Reserves months
- —
- Total cash needed
- —
Loan-product check · same deal, 3 products live
Conventional
25% down · 7.5% · 30yr
- Down + closing
- —
- Monthly P&I
- —
- Monthly cashflow
- —
- DSCR
- —
- Eligible?
- —
Personal DTI + credit; lowest rate.
DSCR
20% down · 8.5% · 30yr
- Down + closing
- —
- Monthly P&I
- —
- Monthly cashflow
- —
- DSCR
- —
- Eligible?
- —
No personal income docs; deal must DSCR.
Hard money
10% down · 12.0% · 12mo
- Down + closing
- —
- Monthly P&I
- —
- Monthly cashflow
- —
- DSCR
- —
- Eligible?
- —
Short-term bridge; refi at stabilization.
Rent comps 27 comps
| Address | Beds | Baths | Sqft | Rent | $/sqft | DOM | Units | Dist |
|---|---|---|---|---|---|---|---|---|
| 1 Morningside Dr New York, NY | 3.0 | 1.0–2.0 | 1655 | $6,310 | $3.81 | 1d | 1 | 0.17mi |
| 30 Morningside Dr #2096 New York, NY | 1.0–2.0 | 1.0–2.0 | 780 | $5,550 | $7.11 | 3d | 2 | 0.25mi |
| 202 W 102nd St Unit 1053014P New York, NY | 2.0 | 2.0 | 538 | $10,000 | $18.59 | 22d | 1 | 0.52mi |
| 308 W 107th St Unit 1239985P New York, NY | 1.0 | 1.0 | 559 | $8,500 | $15.21 | 22d | 1 | 0.53mi |
| 915 W End Ave #1020 New York, NY | 1.0–3.0 | 1.0–2.0 | 851 | $6,210 | $7.30 | 1d | 2 | 0.55mi |
| 814 Amsterdam Ave #1019 New York, NY | 1.0–2.0 | 1.0–2.0 | 800 | $4,800 | $6.00 | 24d | 2 | 0.60mi |
| 808 Columbus Ave New York, NY | 2.0 | 1.0–2.0 | 773 | $6,906 | $8.93 | 1d | 31 | 0.60mi |
| 788 Columbus Ave #1323 New York, NY | 1.0–3.0 | 1.0–1.5 | 900 | $3,660 | $4.07 | 24d | 2 | 0.62mi |
| 70 W 95th St New York, NY | 1.0–4.0 | 1.0–2.0 | 1095 | $9,999 | $9.13 | 17d | 1 | 0.78mi |
| 266 W 96th St #2030 New York, NY | 1.0 | 1.0 | 512 | $5,800 | $11.33 | 6d | 1 | 0.83mi |
| 255 W 94th St #686 New York, NY | 1.0–2.0 | 1.0–2.0 | 750 | $6,300 | $8.40 | 1d | 2 | 0.88mi |
| 122 E 102nd St Unit 1021896P New York, NY | 2.0 | 1.0 | 742 | $5,429 | $7.32 | 16d | 1 | 0.95mi |
| 212 W 91st St New York, NY | 1.0–2.0 | 1.0–2.0 | 825 | $4,725 | $5.73 | 2d | 3 | 1.03mi |
| 212 W 91st St New York, NY | 1.0–2.0 | 1.0–2.0 | 825 | $4,695 | $5.69 | 3d | 4 | 1.03mi |
| 212 W 91st St #416 New York, NY | 1.0–2.0 | 1.0–2.0 | 825 | $6,270 | $7.60 | 6d | 2 | 1.03mi |
| 189 W 89th St New York, NY | 2.0 | 1.0–2.0 | 716 | $6,414 | $8.95 | 1d | 13 | 1.06mi |
| 1501 Lexington Ave #932 New York, NY | 1.0 | 1.0 | 583 | $5,580 | $9.56 | 3d | 2 | 1.11mi |
| 210 W 89th St #165 New York, NY | 1.0 | 1.0 | 675 | $7,520 | $11.14 | 1d | 2 | 1.12mi |
| 175 E 96th St Unit 1251683P New York, NY | 2.0 | 1.0 | 600 | $5,305 | $8.84 | 2d | 2 | 1.17mi |
| 132 W 134th St New York, NY | 2.0 | 1.0 | 750 | $4,500 | $6.00 | 24d | 1 | 1.22mi |
| 215 E 96th St Unit 688 New York, NY | 1.0 | 1.0 | 717 | $7,960 | $11.10 | 3d | 1 | 1.23mi |
| 43 W 85th St Unit 1470323P New York, NY | 1.0 | 1.0 | 699 | $6,466 | $9.25 | 5d | 1 | 1.25mi |
| 215 E 95th St #1293 New York, NY | 1.0–2.0 | 1.0–1.5 | 740 | $5,520 | $7.46 | 1d | 2 | 1.27mi |
| 160 E 88th St #1332 New York, NY | 1.0 | 1.0 | 560 | $5,670 | $10.12 | 6d | 1 | 1.44mi |
| 45 W 81st St Unit 2011 New York, NY | 1.0 | 1.0 | 450 | $4,710 | $10.47 | 24d | 1 | 1.45mi |
| 200 E 89th St Unit 12G New York, NY | 1.0 | 1.0 | 650 | $5,000 | $7.69 | 17d | 1 | 1.46mi |
| 345 E 94th St #1470 New York, NY | 2.0 | 1.0–2.0 | 710 | $5,645 | $7.95 | 3d | 3 | 1.46mi |
HOA detail condo
- Monthly dues
- $576 · $6,912/yr
- Likely covers
- cable
- Assessments
- None detected in remarks — confirm with the listing agent.
Listing history 12 events
-
2026-06-18days on market $649,000 Active 125 DOM
-
2026-06-17days on market $649,000 Active 124 DOM
-
2026-06-15days on market $649,000 Active 122 DOM
-
2026-06-13days on market $649,000 Active 120 DOM
-
2026-06-10days on market $649,000 Active 116 DOM
-
2026-06-08days on market $649,000 Active 115 DOM
-
2026-06-04days on market $649,000 Active 111 DOM
-
2026-06-03days on market $649,000 Active 110 DOM
-
2026-06-01days on market $649,000 Active 108 DOM
-
2026-05-31days on market $649,000 Active 107 DOM
-
2026-02-13$649,000 Active
-
2007-04-16soldstatus $387,500
ⓘ Source: listings_history table (triggers on properties + properties_extension) + one-shot
backfill from property_details.listing_events for pre-trigger history.
Tax reassessment forecast NY · Partial reset (capped growth)
- Current annual tax
- $10,401 · $867/mo
- Projected year-2 tax
- $10,685 · $890/mo
- Expected delta
- +$283/yr (+$24/mo · 2.7%)
ⓘ Screening estimate from a state-policy table — verify with the county assessor before closing.
Climate risk First Street
- Flood 1/10 Low FEMA zone X (unshaded) · 0% chance over 30 yrs
- Wildfire 1/10 Low
- Heat 6/10 Major 7 d/yr ≥99°F today · 15 d/yr by 30 yrs out
- Wind 6/10 Major 27% chance of damaging wind over 30 yrs
- Air quality 4/10 Moderate 5 unhealthy d/yr today · 6 by 30 yrs out
Nearby sold comps map
Loading sold comps map…
Walkable amenities ~0.75 mi
Loading nearby amenities…
Taxation est. · year 1
- Rental income
- $65,369
- − Mortgage interest
- −$36,354
- − Property taxes
- −$10,401
- − Insurance
- −$3,245
- − Repairs & maintenance
- −$5,230
- − Management
- −$5,230
- − HOA
- −$6,912
- − Depreciation
- −$18,880
- Taxable loss
- −$20,882
- Est. tax savings @ 24.0%
- +$5,012
- After-tax cash flow
- $-4,746/yr
For passive investors: Depreciation is non-cash, so a rental often shows a tax loss while cash-flowing — sheltering income. Rental losses are passive: they offset passive income freely, and up to $25,000/yr can offset ordinary (W-2) income if you actively participate and your MAGI is under $100k (phasing out to $0 by $150k); unused losses carry forward. On sale, claimed depreciation is recaptured at up to 25%, and gains may owe capital-gains tax (a 1031 exchange can defer both). Figures are a year-1 estimate at your 24.0% rate — not tax advice; consult a CPA.
Schools (NCES district)
No district data.
Livability — New York
- Score
- 75/100
- State rank
- #268
- US rank
- #4188
Category grades
Schools grade is shown separately in the Schools card above.
Census & demographics
- Census place
- New York, NY
- County
- New York County · 1,599,927 people
- City population
- 7,731,280
- Metro
- New York-Newark-Jersey City, NY-NJ-PA
- Population (ZIP)
- 37,123
- Household income
- $81,244
- Rent vs Own
- Severe rent burden
- 2685.0
Population outlook (New York County) Hauer SSP2
- Today (2025)
- 1,825,725 people
- By 2030
- 1,904,611 · +4.3%
- By 2040
- 2,052,719 · +12.4%
- By 2050
- 2,206,601 · +20.9%
- By 2075
- 2,509,427 · +37.4%
- By 2100
- 2,702,933 · +48.0%
Race, ethnicity, and origin ACS 2023
- Neighborhood character
- Diverse neighborhood (Simpson 0.69)
- Race & ethnicity
- Black 45% White 25% Hispanic / Latino 18% Two or more races 11% Asian 6%
- Hispanic origin (detail)
- Mexican 1% Puerto Rican 4% Dominican 8%
- Common ancestry
- Lithuanian 2% Hispanic 2% Scotch-Irish 1%
- Foreign-born
- 27% · Canada, China, Vietnam
- Languages at home
- 67% English-only · Spanish 14% French/Haitian/Cajun 8% Other Indo-European 2%
Political lean MEDSL · New York
- 2024 margin
- Solid D (+64.8) · D 82.4% · R 17.6%
- 2008→2024 swing
- -7.4pp toward R · 2008: 72.2pp · 2024: 64.8pp
- All cycles
- 2024: D+64.8 2020: D+74.5 2016: D+77.2 2012: D+69.6 2008: D+72.2
Not yet ingested
- Civics
- —
Market trends
- HPI YoY
- ▲ 5.26%
- Current HPI
- 330.628
- Rent YoY
- ▲ 2.46%
- Metro
- New York-Newark-Jersey City, NY-NJ-PA
- State GDP YoY
- ▲ 2.60%
- F500 in state
- 92
Industry mix (Fortune 500 HQ in NY)
| Industry | F500 HQs | Revenue |
|---|---|---|
| Financial Services | 10 | $950B |
|
||
| Consumer Goods | 9 | $162B |
|
||
| Insurance | 4 | $225B |
|
||
| Telecommunications | 2 | $144B |
|
||
| Pharmaceuticals | 2 | $112B |
|
||
| Media / Entertainment | 2 | $69B |
|
||
Price history
+67.5% since first listed2 events — show timeline
- 2026-02-13 Listed $649,000 RLS at REBNY
- 2007-04-16 Sold (Public Records) $387,500 Public Records
Property tax history
+3.2%/yrLatest (2025): $10,401 · +4.4% YoY. Source: county tax records.
Cash-flow waterfall
monthlySold comps — $/sqft
last 12 mo · ≤1 miLoading sold comps…