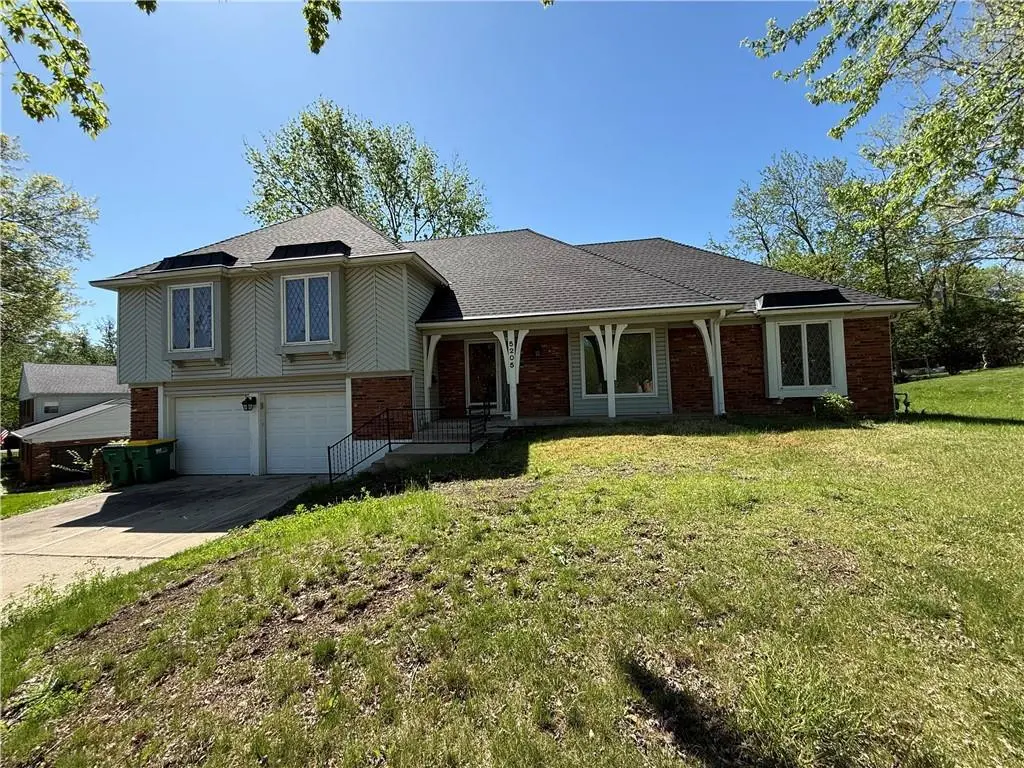
5205 W 99th St · Overland Park, KS
Flood risk 1/10 · Minimal
- FEMA flood zone
- X (unshaded)
- Chance of flooding over 30 yrs
- 0.0%
- Est. flood insurance / yr
- $473 – $860
Fire risk 1/10 · Minimal
- Est. fire insurance / yr
- $1,154 – $2,142
Heat risk 4/10 · Minor
- Hot days now (above 107°F)
- 7 days/yr
- Hot days in 30 yrs
- 17 days/yr
Wind risk 2/10 · Minimal
- Chance of severe wind over 30 yrs
- —
Air-quality risk 3/10 · Minor
- Unhealthy air days now
- 3 days/yr
- Unhealthy air days in 30 yrs
- 3 days/yr
Risk factors via First Street. Map © Google.
Why this score? — see what drove the C grade
The composite is a weighted blend of 9 inputs, each scored 0–100. Each bar is that input's sub-score; the figure is the points it added to the 100-point composite (weight × sub-score).
- Cash flow +18.8/30.0
- ARV discount +15.0/15.0
- DSCR +5.9/10.0
- 1% rule +4.2/10.0
- Livability +4.0/5.0
- Schools +3.8/10.0
- Rent growth +3.7/5.0
- Condition / age +2.5/5.0
- Appreciation +0.0/10.0
$394,900
🖨 Deal sheet (PDF) 📄 Offer letter ✓ Due diligence
Listing remarks
Amazing opportunity in one of the nicest areas of Kansas City. This large property is located halfway between Nall and Roe, making commuting a breeze. SUPER desirable square footage, layout, features and HUGE . 4 acre lot. Rehabbed homes identical to this one are selling for over $600k. I am happy to share the comps! This property is an amazing investment for a rehabber looking to make a large profit, or for a very handy homeowner who can overhaul the house themselves. Parts of the home are already gutted and ready for renovation! PLUS, many of the high end finishes are salvageable-- such as kitchen cabinets and hardwood floors. This is a special one you dont want to miss out on.
Key facts
- 4 acre lot
- High end finishes
- Hardwood floors
Tags
Property features AI
Finance
- HOA & community: No association fees
Exterior
- Parking: Attached front-facing garage; 2-car garage
- Utilities: Public water; Public sewer
- Home design: Single family residence; Residential property; Side/side split floor plan
- Construction: Brick/mortar construction; Composition roof; Basement: concrete, inside entrance, unfinished
- Exterior features: Patio; City lot; Paved road with public maintenance
Interior
- Kitchen: Dishwasher; Disposal; Microwave
- Bedrooms: 4 bedrooms (some located on second/upper levels)
- Flooring: Concrete; Tile; Wood
- Bathrooms: 2 full bathrooms; 1 half bathroom
- Heating & cooling: Natural gas heating; Electric cooling (central air)
- Interior features: Kitchen island; Pantry; Stained cabinets; Formal dining area; Den/Study; Formal living room; Family room on main level; Subbasement
- Laundry & utility: Laundry on bedroom level; Laundry on lower level; Additional laundry area on lower level
Neighborhood map
What this means for you Summary
Snapshot
- This is a 4-bed/2.5-bath single-family listed at $395k.
Deal economics
- At list price, monthly cash flow is $395 ($5k/yr) — positive.
- The deal already cash-flows at list — no discount required.
- To meet the 1% rule (rent ≥ 1% of price), the offer needs to be $362k (8.3% below list).
- Recommended offer: $362k (8.3% below list) — sets the bar for 1% rule.
- Cap rate 7.5% vs local median 3.9% in Overland Park — top-decile yield for the area; either an underpriced asset or a hidden risk that comps aren't pricing in. Stress-test before assuming the spread holds.
Location & tenants
- Location reads 80/100 on livability (#16 in KS, #1,851 nationally) — a professional / high-income tenant draw. Strengths: employment A+, housing A+, schools B+; Watch: health & safety C-, commute D+.
- Shawnee Mission Pub Schools (suburban): math 38% / reading 46% proficiency, ranked #22 of 169 in KS (top 13%) — families likely to look elsewhere, expect single-tenant / working-renter base with shorter leases.
- Market conditions: Rents rising fast (+4.7%/yr); 64 active listings in the ZIP; 3 comparable units currently listed for rent nearby; rentals at typical pace (median 23d on market — plan ~3-4 weeks tenant-placement turnaround); high-income renter base; 2,969 units permitted in Johnson County in 2024 (1,066 in 5+ unit buildings).
- This rent runs 35% of the median local income ($125k/yr) — at the standard rent-burdened threshold; future hikes will face affordability resistance.
Forward outlook
- Local home prices are declining (-3.0%/yr); year-one equity from $3k of loan paydown is wiped out by about $12k of value loss. Plan a longer hold.
- Johnson County population projected at +27% by 2050 — long-run rental-demand tailwind backs the buy-and-hold thesis.
Negotiation context
- Only 7 days on market — expect competitive offers; lowballing is unlikely to land.
- Current owner paid $290k; 36% above their basis — modest negotiation headroom, anchor on the comps not their cost.
Questions for the listing agent
- Built in 1969 — when were the roof, HVAC, electrical panel, plumbing, and water heater last replaced?
- Is there a deadline driving the sale (1031 exchange, divorce, estate, relocation)? That informs how much negotiation room exists.
- Schools are B-rated — typically a magnet for longer-tenancy family renters. What's the average tenant stay here, and is there a school-zone premium baked into asking?
- What's the average days-on-market for RENTAL listings here right now (not sales)? A rising rental-DOM trend means longer vacancies and softer asking-rent achievability than the comps imply.
- What's the recent tenant-quality profile in this submarket — average credit score on applications, eviction rate, late-payment / NSF rate, and stable-employment percentage? A property-management company in the area should have these aggregated.
- How much new for-sale + rental construction is in the pipeline within 1–3 miles? Heavy new supply typically softens prices + rents 12–24 months out; constrained supply supports both.
Investment metrics
- 1% rule
- 0.92% ✗
- Cap rate
- 7.49%
- Cash-on-cash
- 4.28%
- DSCR
- 1.19
- GRM
- 9.1
CMA / ARV
- ARV (on-the-fly)
- $527,076
- Comps found
- 12
Show comp detail 12 sales within ~0.75 mi
| Address | Dist | Beds/Ba | Sqft | Sold | Price | $/sf | Match |
|---|---|---|---|---|---|---|---|
| 5205 W 99th St | 0.00mi | 4/2.5 | 2,662 (0%) | 1mo | $394,900 | $148 | 99 |
| 5415 W 99th Ter | 0.17mi | 3/2.5 (-1) | 2,658 (-0%) | 2mo | $449,995 | $169 | 85 |
| 5300 W 101 Ter | 0.25mi | 4/2.5 | 2,592 (-3%) | 1mo | $799,000 | $308 | 84 |
| 10006 Cedar St | 0.25mi | 5/3.5 (+1) | 2,670 (+0%) | 4mo | $575,000 | $215 | 76 |
| 10206 Linden St | 0.47mi | 4/2.5 | 2,660 (-0%) | 3mo | $575,000 | $216 | 75 |
| 5616 W 98th St | 0.35mi | 4/3.0 | 2,570 (-4%) | 7mo | $499,000 | $194 | 70 |
| 10013 Briar Dr | 0.23mi | 4/3.5 | 2,332 (-12%) | 3mo | $540,000 | $232 | 62 |
| 9516 Linden St | 0.50mi | 4/3.0 | 2,849 (+7%) | 2mo | $850,000 | $298 | 61 |
| 9724 Outlook Dr | 0.44mi | 4/2.5 | 2,308 (-13%) | 1mo | $450,000 | $195 | 56 |
| 6101 W 99 th St | 0.56mi | 4/2.5 | 2,964 (+11%) | 5mo | $489,000 | $165 | 51 |
| 10200 Granada Ln | 0.56mi | 4/2.5 | 3,037 (+14%) | 6mo | $600,000 | $198 | 45 |
| 9501 El Monte St | 0.73mi | 3/3.0 (-1) | 2,462 (-8%) | 6mo | $475,000 | $193 | 41 |
Match score weights: distance 35% · size 25% · config 20% · recency 20%. Top-matched comps best support the ARV.
Projected returns pro-forma
-3.0% appreciation · 4.68% rent growth · sell at horizon
- IRR
- -7.9%
- Equity multiple
- 0.70×
- Total profit
- $-32,724
- Equity at exit
- $58,881
- IRR
- 3.5%
- Equity multiple
- 1.27×
- Total profit
- $29,893
- Equity at exit
- $34,144
Cash invested: $110,572 (down + closing). Projections, not guarantees.
Landlord ↔ Tenant lean methodology
- Overall (STATE)
- 83 Strongly Landlord-Friendly
- State Kansas
- 83 Strongly Landlord-Friendly · R+10
- County
- — inherits STATE
- City
- — inherits STATE
ZIP-level market 66207
- Rents YoY
- 4.7%
- Active inventory
- 64
- Price-to-rent
- 9.1×
Monthly cashflow live
- Estimated rent
- $3,623 medium interval (Pro) →
- Mortgage (P&I)
- −$2,071
- Tax from tax record
- −$232 /mo · $2,780/yr
- Insurance
- −$165
- HOA
- −$0
- Vacancy / Maint / Mgmt
- −$761
- Net cashflow
- $395
Break-even live
Sensitivity live
| Price | -10% $618 | -5% $507 | +0% $395 | +5% $283 | +10% $171 |
|---|---|---|---|---|---|
| Rent | -10% $109 | -5% $252 | +0% $395 | +5% $538 | +10% $681 |
| Rate | -1.0pp $594 | -0.5pp $495 | base $395 | +0.5pp $292 | +1.0pp $188 |
UW: 25.0% down · 7.5% · 30yr · 1.5% tax · 5.0% vac · 8.0% maint · 8.0% mgmt
Financing live
Cash to close
- Down payment
- $98,725
- Closing costs
- $11,847
- Reserves months
- —
- Total cash needed
- —
Loan-product check · same deal, 3 products live
Conventional
25% down · 7.5% · 30yr
- Down + closing
- —
- Monthly P&I
- —
- Monthly cashflow
- —
- DSCR
- —
- Eligible?
- —
Personal DTI + credit; lowest rate.
DSCR
20% down · 8.5% · 30yr
- Down + closing
- —
- Monthly P&I
- —
- Monthly cashflow
- —
- DSCR
- —
- Eligible?
- —
No personal income docs; deal must DSCR.
Hard money
10% down · 12.0% · 12mo
- Down + closing
- —
- Monthly P&I
- —
- Monthly cashflow
- —
- DSCR
- —
- Eligible?
- —
Short-term bridge; refi at stabilization.
Rent comps 3 comps
| Address | Beds | Baths | Sqft | Rent | $/sqft | DOM | Units | Dist |
|---|---|---|---|---|---|---|---|---|
| 4120 W 98th Ter Overland Park, KS | 4.0 | 3.5 | 2980 | $5,000 | $1.68 | 24d | 1 | 0.67mi |
| 9827 Mission Rd Leawood, KS | 4.0 | 2.5 | 1978 | $2,481 | $1.25 | 22d | 1 | 0.87mi |
| 4120 W 94th Ter Prairie Village, KS | 1.0–3.0 | 1.0–2.0 | 1345 | $2,830 | $2.10 | 2d | 17 | 0.93mi |
Listing history 3 events
-
2026-05-08status Pending
-
2026-05-01$394,900 Active
-
2026-04-17soldstatus $290,000
ⓘ Source: listings_history table (triggers on properties + properties_extension) + one-shot
backfill from property_details.listing_events for pre-trigger history.
Tax reassessment forecast KS · Resets to sale price
- Current annual tax
- $2,780 · $232/mo
- Projected year-2 tax
- $5,568 · $464/mo
- Expected delta
- +$2,788/yr (+$232/mo · 100.3%)
ⓘ Screening estimate from a state-policy table — verify with the county assessor before closing.
Climate risk First Street
- Flood 1/10 Low FEMA zone X (unshaded) · 0% chance over 30 yrs
- Wildfire 1/10 Low
- Heat 4/10 Moderate 7 d/yr ≥107°F today · 17 d/yr by 30 yrs out
- Wind 2/10 Low
- Air quality 3/10 Moderate 3 unhealthy d/yr today · 3 by 30 yrs out
Nearby sold comps map
Loading sold comps map…
Walkable amenities ~0.75 mi
Loading nearby amenities…
Taxation est. · year 1
- Rental income
- $43,472
- − Mortgage interest
- −$22,121
- − Property taxes
- −$2,780
- − Insurance
- −$1,974
- − Repairs & maintenance
- −$3,478
- − Management
- −$3,478
- − Depreciation
- −$11,488
- Taxable loss
- −$1,846
- Est. tax savings @ 24.0%
- +$443
- After-tax cash flow
- $5,181/yr
For passive investors: Depreciation is non-cash, so a rental often shows a tax loss while cash-flowing — sheltering income. Rental losses are passive: they offset passive income freely, and up to $25,000/yr can offset ordinary (W-2) income if you actively participate and your MAGI is under $100k (phasing out to $0 by $150k); unused losses carry forward. On sale, claimed depreciation is recaptured at up to 25%, and gains may owe capital-gains tax (a 1031 exchange can defer both). Figures are a year-1 estimate at your 24.0% rate — not tax advice; consult a CPA.
Schools (NCES district)
- District
- Shawnee Mission Pub Schools
- NCES district ID
- 2011640
- Math proficiency
- 38% ▼ -6.00%
- Reading proficiency
- 46% ▼ -2.00%
- Median HH income
- $64,923
- Composite
- 37.55/100
- National rank
- #4391
- State rank
- #22 of 169 in KS
Livability — Overland Park
- Score
- 80/100
- State rank
- #16
- US rank
- #1851
Category grades
Schools grade is shown separately in the Schools card above.
Census & demographics
- Census place
- Overland Park, KS
- County
- Johnson County · 574,662 people
- City population
- 180,138
- Metro
- Kansas City, MO-KS
- Population (ZIP)
- 15,739
- Household income
- $125,153
- Rent vs Own
- Severe rent burden
- 305.0
Population outlook (Johnson County) Hauer SSP2
- Today (2025)
- 663,396 people
- By 2030
- 702,585 · +5.9%
- By 2040
- 775,386 · +16.9%
- By 2050
- 841,772 · +26.9%
- By 2075
- 994,137 · +49.9%
- By 2100
- 1,073,036 · +61.7%
Race, ethnicity, and origin ACS 2023
- Neighborhood character
- Predominantly White (91%)
- Race & ethnicity
- White 91% Hispanic / Latino 6% Two or more races 5%
- Hispanic origin (detail)
- Mexican 2% Cuban 1%
- Common ancestry
- Italian 4% Slovak 3% Lithuanian 3%
- Foreign-born
- 3% · Canada, China
- Languages at home
- 97% English-only · Spanish 2% Chinese 1%
Political lean MEDSL · Johnson
- 2024 margin
- Lean D (+8.5) · D 53.4% · R 44.9% · Other 1.8%
- 2008→2024 swing
- +17.5pp toward D · 2008: -9.0pp · 2024: 8.5pp
- All cycles
- 2024: D+8.5 2020: D+8.2 2016: R+2.7 2012: R+17.8 2008: R+9.0
Not yet ingested
- Civics
- —
Market trends
- HPI YoY
- ▼ -286.42%
- Current HPI
- 274.6822
- Rent YoY
- ▲ 4.68%
- Metro
- Kansas City, MO-KS
- State GDP YoY
- —
- F500 in state
- 0
Price history
+36.2% since first listed3 events — show timeline
- 2026-05-08 Pending — Heartland MLS as Distributed by MLS Grid
- 2026-05-01 Listed $394,900 Heartland MLS as Distributed by MLS Grid
- 2026-04-17 Sold (Public Records) $290,000 Public Records
Property tax history
+3.0%/yrLatest (2025): $2,780 · +4.5% YoY. Source: county tax records.
Cash-flow waterfall
monthlySold comps — $/sqft
last 12 mo · ≤1 miLoading sold comps…