 🏗️ New Construction
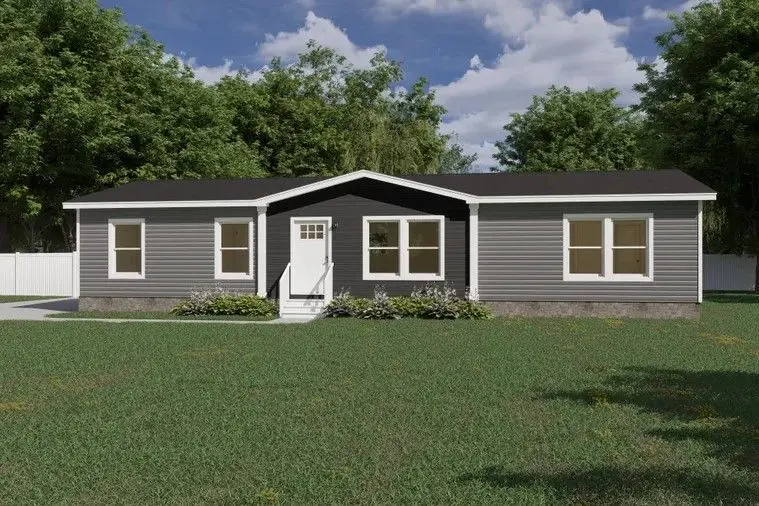
Clayton Crazy Eights Plan · Princeton, TX
Flood risk 1/10 · Minimal
- FEMA flood zone
- X (unshaded)
- Chance of flooding over 30 yrs
- 0.0%
- Est. flood insurance / yr
- $507 – $1,088
Fire risk 5/10 · Moderate
- Est. fire insurance / yr
- $1,222 – $2,270
Heat risk 8/10 · Major
- Hot days now (above 111°F)
- 8 days/yr
- Hot days in 30 yrs
- 27 days/yr
Wind risk 6/10 · Moderate
- Chance of severe wind over 30 yrs
- 27.0%
Air-quality risk 3/10 · Minor
- Unhealthy air days now
- 3 days/yr
- Unhealthy air days in 30 yrs
- 3 days/yr
Risk factors via First Street. Map © Google.
Why this score? — see what drove the F grade
The composite is a weighted blend of 9 inputs, each scored 0–100. Each bar is that input's sub-score; the figure is the points it added to the 100-point composite (weight × sub-score).
- ARV discount +7.5/15.0
- Schools +4.2/10.0
- 1% rule +3.7/10.0
- Livability +3.1/5.0
- Cash flow +2.7/30.0
- Rent growth +2.2/5.0
- Condition / age +2.2/5.0
- DSCR +0.0/10.0
- Appreciation +0.0/10.0
$117,995
🖨 Deal sheet (PDF) 📄 Offer letter ✓ Due diligence
Listing remarks MLS
The Clayton Crazy Eights offers a thoughtfully designed living space with 4 bedrooms and 2 bathrooms, encompassing approximately 1,475 square feet. Its open-concept layout seamlessly connects the living, dining, and kitchen areas, creating an inviting atmosphere for family gatherings and entertaining. The split-bedroom design ensures privacy, with the primary suite featuring a spacious ensuite bathroom and a generous walk-in closet.
Key facts
- Listed 210 days
Neighborhood map
What this means for you Summary
Snapshot
- This is a 4-bed/2.0-bath manufactured listed at $118k. Condition is rated fair.
Deal economics
- At list price, monthly cash flow is $-880 ($-11k/yr) — negative.
- The deal already cash-flows at list — no discount required.
- Meets the 1% rule at list price ($2k rent vs $118k).
- Recommended offer: $104k (12.0% below list) — sets the bar for market timing.
- Cap rate 2.2% vs local median 4.5% in Princeton — below-typical yield; the buyer is paying a premium for something (appreciation thesis, condition, location) that the cap rate doesn't capture.
Location & tenants
- Location reads 62/100 on livability (#969 in TX) — a middle-class / working-renter tenant base. Strengths: employment A+, housing A+, cost of living A; Watch: schools C-, amenities F, commute F.
- Princeton ISD (suburban): math 51% / reading 47% proficiency, ranked #188 of 826 in TX (top 23%) — families likely to look elsewhere, expect single-tenant / working-renter base with shorter leases.
- Market conditions: Rents soft (-1.0%/yr); 1409 active listings in the ZIP; 31 comparable units currently listed for rent nearby; rentals at typical pace (median 20d on market — plan ~3-4 weeks tenant-placement turnaround); solid renter incomes; 19,194 units permitted in Collin County in 2024 (3,988 in 5+ unit buildings).
Forward outlook
- Local home prices are declining (-3.0%/yr); year-one equity from $2k of loan paydown is wiped out by about $8k of value loss. Plan a longer hold.
- Collin County population projected at +60% by 2050 — long-run rental-demand tailwind backs the buy-and-hold thesis.
Negotiation context
- It's been on market 211 days — a 12% lower offer ($104k) is reasonable based on typical stale-listing flexibility.
Risks & watch-outs
- Watch-outs: property tax is 3.3% of price; HOA is 38% of rent.
- Climate carrying-cost: major wind risk, 27% chance of damaging wind over 30y; moderate wildfire risk; extreme-heat days projected 8→27/yr by 2055 (HVAC capex compounding) — expect insurance premiums to compound above CPI over the hold.
Questions for the listing agent
- What do current leases actually rent for vs. the listed asking? Can we see a recent rent roll and the last 12 months of T-12 income?
- It's been on market 211 days. Have you received any prior offers? Is the seller open to a 12% concession, seller financing, or rate buy-down credit?
- Have any recent inspections been done? Can we get a copy of the seller's disclosures and any deferred-maintenance estimates?
- Property tax is high relative to price — has the assessment been appealed recently, and will the sale trigger a re-assessment?
- What does the HOA fee cover, when was the last increase, and are there any pending special assessments or reserve-fund shortfalls?
- Why hasn't it sold? Are there any deal-killer items the seller is aware of (foundation, flood, title, zoning, code violations)?
- Is there a deadline driving the sale (1031 exchange, divorce, estate, relocation)? That informs how much negotiation room exists.
- The area grade is low — what's the realistic commute time and amenity access for the typical tenant pool here? Any planned neighborhood developments (good or bad) we should know about?
- What's the average days-on-market for RENTAL listings here right now (not sales)? A rising rental-DOM trend means longer vacancies and softer asking-rent achievability than the comps imply.
- What's the recent tenant-quality profile in this submarket — average credit score on applications, eviction rate, late-payment / NSF rate, and stable-employment percentage? A property-management company in the area should have these aggregated.
- How much new for-sale + rental construction is in the pipeline within 1–3 miles? Heavy new supply typically softens prices + rents 12–24 months out; constrained supply supports both.
Investment metrics
- 1% rule
- 0.87% ✗
- Cap rate
- 2.22%
- Cash-on-cash
- -14.54%
- DSCR
- 0.35
- GRM
- 9.6
CMA / ARV
- ARV (median comp)
- $259,239
- List price
- $117,995
- Delta
- -54.48%
- Verdict
- UNDERPRICED
- Comps
- 7 within 2.0 mi
Show comp detail 2 sales within ~0.75 mi
| Address | Dist | Beds/Ba | Sqft | Sold | Price | $/sf | Match |
|---|---|---|---|---|---|---|---|
| 9511 Olive St | 0.56mi | 3/2.0 (-1) | 1,678 (+7%) | 15mo | $265,000 | $158 | 44 |
| 9083 County Road 864 | 0.56mi | 3/2.0 (-1) | 1,344 (-14%) | 12mo | $265,000 | $197 | 35 |
Match score weights: distance 35% · size 25% · config 20% · recency 20%. Top-matched comps best support the ARV.
Projected returns pro-forma
-3.0% appreciation · 0.0% rent growth · sell at horizon
- IRR
- -49.8%
- Equity multiple
- -0.43×
- Total profit
- $-104,066
- Equity at exit
- $38,653
- IRR
- —
- Equity multiple
- -1.56×
- Total profit
- $-185,945
- Equity at exit
- $22,414
Cash invested: $72,587 (down + closing). Projections, not guarantees.
Landlord ↔ Tenant lean methodology
- Overall (STATE)
- 87 Strongly Landlord-Friendly
- State Texas
- 87 Strongly Landlord-Friendly · R+5
- County
- — inherits STATE
- City
- — inherits STATE
ZIP-level market 75407
- Home prices YoY
- -30.3%
- Rents YoY
- -1.0%
- Active inventory
- 1409
- Price-to-rent
- 4.4×
Monthly cashflow live
- Estimated rent
- $2,249 high interval (Pro) →
- Mortgage (P&I)
- −$1,359
- Tax est. 1.5%
- −$324 /mo · $3,889/yr
- Insurance
- −$108
- HOA
- −$865
- Vacancy / Maint / Mgmt
- −$472
- Net cashflow
- $-880
Break-even live
Sensitivity live
| Price | -10% $-701 | -5% $-790 | +0% $-880 | +5% $-969 | +10% $-1,059 |
|---|---|---|---|---|---|
| Rent | -10% $-1,057 | -5% $-969 | +0% $-880 | +5% $-791 | +10% $-702 |
| Rate | -1.0pp $-749 | -0.5pp $-814 | base $-880 | +0.5pp $-947 | +1.0pp $-1,015 |
UW: 25.0% down · 7.5% · 30yr · 1.5% tax · 5.0% vac · 8.0% maint · 8.0% mgmt
Financing live
Cash to close
- Down payment
- $64,810
- Closing costs
- $7,777
- Reserves months
- —
- Total cash needed
- —
Loan-product check · same deal, 3 products live
Conventional
25% down · 7.5% · 30yr
- Down + closing
- —
- Monthly P&I
- —
- Monthly cashflow
- —
- DSCR
- —
- Eligible?
- —
Personal DTI + credit; lowest rate.
DSCR
20% down · 8.5% · 30yr
- Down + closing
- —
- Monthly P&I
- —
- Monthly cashflow
- —
- DSCR
- —
- Eligible?
- —
No personal income docs; deal must DSCR.
Hard money
10% down · 12.0% · 12mo
- Down + closing
- —
- Monthly P&I
- —
- Monthly cashflow
- —
- DSCR
- —
- Eligible?
- —
Short-term bridge; refi at stabilization.
Rent comps 31 comps
| Address | Beds | Baths | Sqft | Rent | $/sqft | DOM | Units | Dist |
|---|---|---|---|---|---|---|---|---|
| 341 Wild Rose Way Princeton, TX | 4.0 | 3.0 | 2090 | $2,150 | $1.03 | 45d | 1 | 0.25mi |
| 501 Yellow Rose Rd Princeton, TX | 3.0 | 2.0 | 1294 | $2,000 | $1.55 | 45d | 1 | 0.33mi |
| 3918 Applewood Trl Princeton, TX | 3.0 | 2.0 | 1294 | $1,850 | $1.43 | 0d | 1 | 0.39mi |
| 4013 Pinebluff Ln Princeton, TX | 4.0 | 2.0 | 2184 | $2,075 | $0.95 | 25d | 1 | 0.44mi |
| 4115 Mountain Dr Princeton, TX | 4.0 | 2.0 | 1796 | $2,200 | $1.22 | 20d | 1 | 0.52mi |
| 837 Wild Rose Way Princeton, TX | 3.0 | 2.0 | 1456 | $1,920 | $1.32 | 0d | 1 | 0.74mi |
| 841 Wild Rose Way Princeton, TX | 4.0 | 3.0 | 2090 | $2,550 | $1.22 | 0d | 1 | 0.75mi |
| 845 Wild Rose Way Unit NA Princeton, TX | 4.0 | 2.0 | 1797 | $2,000 | $1.11 | 14d | 1 | 0.76mi |
| 849 Wild Rose Way Princeton, TX | 4.0 | 2.0 | 1836 | $2,250 | $1.23 | 0d | 1 | 0.77mi |
| 6589 FM 546 Princeton, TX | 3.0 | 2.0 | 1568 | $1,350 | $0.86 | 25d | 1 | 0.82mi |
| 4812 Sagerun Dr Princeton, TX | 4.0 | 2.0 | 1838 | $2,099 | $1.14 | 4d | 1 | 1.01mi |
| 501 Merriam Dr Princeton, TX | 4.0 | 2.0 | 1838 | $2,500 | $1.36 | 20d | 1 | 1.02mi |
| 705 Alden Dr Princeton, TX | 3.0 | 2.0 | 1596 | $2,100 | $1.32 | 45d | 1 | 1.07mi |
| 605 Merriam Dr Princeton, TX | 3.0 | 2.0 | 1596 | $2,250 | $1.41 | 45d | 1 | 1.07mi |
| 524 Hackney Dr Princeton, TX | 3.0 | 2.0 | 1600 | $1,900 | $1.19 | 25d | 1 | 1.07mi |
| 252 Ardsley Ln Princeton, TX | 4.0 | 2.0 | 1838 | $2,000 | $1.09 | 18d | 1 | 1.08mi |
| 252 Ardsley Ln Princeton, TX | 4.0 | 2.0 | 1838 | $2,000 | $1.09 | 4d | 1 | 1.08mi |
| 725 Alden Dr Princeton, TX | 3.0 | 2.0 | 1596 | $2,099 | $1.32 | 12d | 1 | 1.09mi |
| 4912 Ascot Way Princeton, TX | 3.0 | 2.0 | 1801 | $2,050 | $1.14 | 45d | 1 | 1.10mi |
| 5001 Greywing Dr Princeton, TX | 4.0 | 2.0 | 1994 | $2,195 | $1.10 | 45d | 1 | 1.11mi |
| 5105 Greywing Dr Princeton, TX | 3.0 | 2.0 | 1438 | $1,895 | $1.32 | 18d | 1 | 1.19mi |
| 5119 Winterberry Dr Princeton, TX | 4.0 | 2.0 | 1838 | $2,135 | $1.16 | 45d | 1 | 1.21mi |
| 108 Wyndemere Ln Princeton, TX | 3.0 | 2.0 | 1438 | $2,100 | $1.46 | 45d | 1 | 1.34mi |
| 126 Autumn Sage Ln Princeton, TX | 3.0 | 2.0 | 2120 | $2,110 | $1.00 | 8d | 1 | 1.38mi |
| 126 Autumn Sage Ln Princeton, TX | 3.0 | 2.0 | 2120 | $2,336 | $1.10 | 23d | 1 | 1.38mi |
| 5217 Rockrose Ln Princeton, TX | 4.0 | 2.0 | 1627 | $1,700 | $1.04 | 8d | 1 | 1.39mi |
| 5217 Rockrose Ln Princeton, TX | 4.0 | 2.0 | 1627 | $2,186 | $1.34 | 23d | 1 | 1.39mi |
| 5213 Longshadow Dr Princeton, TX | 3.0 | 2.0 | 1260 | $1,985 | $1.58 | 0d | 1 | 1.42mi |
| 510 Olmstead Dr Princeton, TX | 3.0 | 2.0 | 1260 | $2,395 | $1.90 | 6d | 1 | 1.45mi |
| 412 Crossvine Way Princeton, TX | 4.0 | 2.0 | 1996 | $2,795 | $1.40 | 45d | 1 | 1.48mi |
| 122 Lemongrass Dr Princeton, TX | 4.0 | 2.0 | 1674 | $1,955 | $1.17 | 6d | 1 | 1.49mi |
HOA detail
- Monthly dues
- $865 · $10,380/yr
Listing history 9 events
-
2026-06-09days on market $117,995 Active 211 DOM
-
2026-06-08days on market $117,995 Active 210 DOM
-
2026-06-07days on market $117,995 Active 209 DOM
-
2026-06-04days on market $117,995 Active 206 DOM
-
2026-06-03days on market $117,995 Active 205 DOM
-
2026-06-02days on market $117,995 Active 204 DOM
-
2026-06-01days on market $117,995 Active 203 DOM
-
2026-05-31days on market $117,995 Active 202 DOM
-
2025-11-11$117,995 Active 436-char remark
Show marketing remark (436 chars)
The Clayton Crazy Eights offers a thoughtfully designed living space with 4 bedrooms and 2 bathrooms, encompassing approximately 1,475 square feet. Its open-concept layout seamlessly connects the living, dining, and kitchen areas, creating an inviting atmosphere for family gatherings and entertaining. The split-bedroom design ensures privacy, with the primary suite featuring a spacious ensuite bathroom and a generous walk-in closet.
ⓘ Source: listings_history table (triggers on properties + properties_extension) + one-shot
backfill from property_details.listing_events for pre-trigger history.
Climate risk First Street
- Flood 1/10 Low FEMA zone X (unshaded) · 0% chance over 30 yrs
- Wildfire 5/10 Major
- Heat 8/10 Severe 8 d/yr ≥111°F today · 27 d/yr by 30 yrs out
- Wind 6/10 Major 27% chance of damaging wind over 30 yrs
- Air quality 3/10 Moderate 3 unhealthy d/yr today · 3 by 30 yrs out
Nearby sold comps map
Loading sold comps map…
Walkable amenities ~0.75 mi
Loading nearby amenities…
Taxation est. · year 1
- Rental income
- $26,989
- − Mortgage interest
- −$14,521
- − Property taxes
- −$3,889
- − Insurance
- −$1,296
- − Repairs & maintenance
- −$2,159
- − Management
- −$2,159
- − HOA
- −$10,380
- − Depreciation
- −$7,542
- Taxable loss
- −$14,957
- Est. tax savings @ 24.0%
- +$3,590
- After-tax cash flow
- $-6,967/yr
For passive investors: Depreciation is non-cash, so a rental often shows a tax loss while cash-flowing — sheltering income. Rental losses are passive: they offset passive income freely, and up to $25,000/yr can offset ordinary (W-2) income if you actively participate and your MAGI is under $100k (phasing out to $0 by $150k); unused losses carry forward. On sale, claimed depreciation is recaptured at up to 25%, and gains may owe capital-gains tax (a 1031 exchange can defer both). Figures are a year-1 estimate at your 24.0% rate — not tax advice; consult a CPA.
Condition & rehab AI · 0 photos
The home requires moderate repairs and updates to improve its condition and value. Painting, refinishing, HVAC upgrade, and landscaping are key areas to focus on for both resale and rental value.
Repairs flagged
- Moderate Kitchen cabinets — Signs of wear and tear.
- Moderate Bathroom fixtures — Visible signs of wear and tear.
- Moderate Exterior siding — Discoloration and wear.
- Moderate Hardwood floors — Worn and could benefit from refinishing.
- Moderate Paint — Faded in some areas.
- Moderate Windows — Frames show signs of wear.
- Moderate HVAC unit — Appears old and may need maintenance.
- Moderate Landscaping — Minimal and could benefit from updates to enhance curb appeal.
Value-add opportunities
- Both Painting and refinishing — Enhances both resale and rental value by improving the home's appearance.
- Both HVAC upgrade — Improves comfort and energy efficiency, attracting more buyers and renters.
- Both Landscaping and curb appeal — Enhances the home's curb appeal and can attract more buyers and renters.
- Both Kitchen and bathroom updates — Improves functionality and aesthetics, attracting more buyers and renters.
- Both Exterior siding and foundation repairs — Enhances the home's overall appearance and structural integrity, attracting more buyers and renters.
Renovation cost estimate screening
| Repair item | Severity | Est. cost |
|---|---|---|
| Kitchen cabinets · Signs of wear and tear. | Moderate | $3,000–15,000 |
| Bathroom fixtures · Visible signs of wear and tear. | Moderate | $3,000–15,000 |
| Exterior siding · Discoloration and wear. | Moderate | $3,000–15,000 |
| Hardwood floors · Worn and could benefit from refinishing. | Moderate | $3,000–15,000 |
| Paint · Faded in some areas. | Moderate | $3,000–15,000 |
| Windows · Frames show signs of wear. | Moderate | $3,000–15,000 |
| HVAC unit · Appears old and may need maintenance. | Moderate | $3,000–15,000 |
| Landscaping · Minimal and could benefit from updates to enhance curb appeal. | Moderate | $3,000–15,000 |
| Total estimated repair cost · 8 items | $24,000–120,000 |
Value-add ROI direction
- Both Painting and refinishing — Enhances both resale and rental value by improving the home's appearance. ↑
- Both HVAC upgrade — Improves comfort and energy efficiency, attracting more buyers and renters. ↑
- Both Landscaping and curb appeal — Enhances the home's curb appeal and can attract more buyers and renters. ↑
- Both Kitchen and bathroom updates — Improves functionality and aesthetics, attracting more buyers and renters. ↑
- Both Exterior siding and foundation repairs — Enhances the home's overall appearance and structural integrity, attracting more buyers and renters. ↑
ⓘ Cost ranges are severity-bucket heuristics (US national rule-of-thumb). Get contractor quotes + a written scope before underwriting a rehab budget.
Schools (NCES district)
- District
- Princeton ISD
- NCES district ID
- 4835850
- Math proficiency
- 51% ▼ -8.00%
- Reading proficiency
- 47% ▬ 0.00%
- Median HH income
- $54,827
- Composite
- 42.44/100
- National rank
- #3226
- State rank
- #188 of 826 in TX
Livability — Princeton
- Score
- 62/100
- State rank
- #969
- US rank
- #17215
Category grades
Schools grade is shown separately in the Schools card above.
Census & demographics
- County
- Collin County · 1,159,394 people
- City population
- 34,171
- Metro
- Dallas-Fort Worth-Arlington, TX
- Population (ZIP)
- 34,171
- Household income
- $100,037
- Rent vs Own
- Severe rent burden
- 368.0
Population outlook (Collin County) Hauer SSP2
- Today (2025)
- 1,210,074 people
- By 2030
- 1,358,201 · +12.2%
- By 2040
- 1,654,061 · +36.7%
- By 2050
- 1,937,359 · +60.1%
- By 2075
- 2,567,039 · +112.1%
- By 2100
- 2,952,048 · +144.0%
Race, ethnicity, and origin ACS 2023
- Neighborhood character
- Diverse neighborhood (Simpson 0.66)
- Race & ethnicity
- White 47% Hispanic / Latino 30% Black 17% Two or more races 10% Asian 4% Native American 1%
- Hispanic origin (detail)
- Mexican 26%
- Common ancestry
- Lithuanian 2% Romanian 1% Russian 1%
- Foreign-born
- 15% · Canada, China, Mexico
- Languages at home
- 70% English-only · Spanish 22% Other Indo-European 2% Other Asian/Pacific 1%
Political lean MEDSL · Collin
- 2024 margin
- R (+11.1) · D 43.1% · R 54.3% · Other 2.6%
- 2008→2024 swing
- +14.4pp toward D · 2008: -25.6pp · 2024: -11.1pp
- All cycles
- 2024: R+11.1 2020: R+4.3 2016: R+17.0 2012: R+31.6 2008: R+25.6
Not yet ingested
- Civics
- —
Market trends
- HPI YoY
- ▼ -103.99%
- Current HPI
- 238.9373
- Rent YoY
- ▼ -1.02%
- Metro
- Dallas-Fort Worth-Arlington, TX
- State GDP YoY
- ▲ 3.95%
- F500 in state
- 110
Industry mix (Fortune 500 HQ in TX)
| Industry | F500 HQs | Revenue |
|---|---|---|
| Energy | 16 | $1,198B |
|
||
| Technology | 5 | $198B |
|
||
| Engineering / Construction | 4 | $72B |
|
||
| Energy Services | 3 | $60B |
|
||
| Utilities | 3 | $41B |
|
||
| Healthcare | 2 | $330B |
|
||
Price history
1 event — show timeline
- 2025-11-11 Listed $117,995 Zillow
Cash-flow waterfall
monthlySold comps — $/sqft
last 12 mo · ≤1 miLoading sold comps…