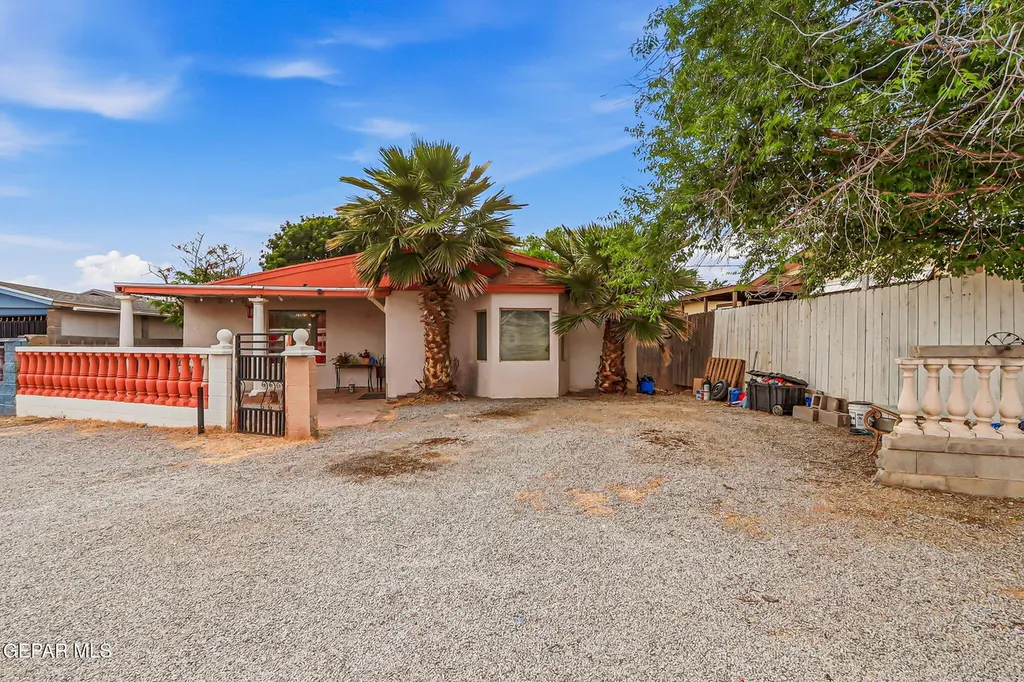
7335 Buckhorn St · Canutillo, TX
Flood risk 1/10 · Minimal
- FEMA flood zone
- —
- Chance of flooding over 30 yrs
- 0.0%
- Est. flood insurance / yr
- —
Fire risk 4/10 · Minor
- Est. fire insurance / yr
- $1,222 – $2,270
Heat risk 6/10 · Moderate
- Hot days now (above 101°F)
- 6 days/yr
- Hot days in 30 yrs
- 23 days/yr
Wind risk 1/10 · Minimal
- Chance of severe wind over 30 yrs
- —
Air-quality risk 2/10 · Minimal
- Unhealthy air days now
- 1 days/yr
- Unhealthy air days in 30 yrs
- 1 days/yr
Risk factors via First Street. Map © Google.
Why this score? — see what drove the C grade
The composite is a weighted blend of 9 inputs, each scored 0–100. Each bar is that input's sub-score; the figure is the points it added to the 100-point composite (weight × sub-score).
- Cash flow +17.6/30.0
- Appreciation +10.0/10.0
- ARV discount +7.5/15.0
- 1% rule +6.0/10.0
- DSCR +5.5/10.0
- Schools +2.9/10.0
- Livability +2.9/5.0
- Rent growth +2.5/5.0
- Condition / age +2.5/5.0
$199,999
🖨 Deal sheet 📄 Offer letter ✓ Due diligence
Key facts
- 5,720 sq ft lot
- Built 2006
- Listed 42 days
Property features AI
Exterior
- Utilities: Septic tank
- Home design: Single family residence
- Construction: Concrete, stucco, and block construction; Shingle roof
- Exterior features: Walled front
Interior
- Kitchen: Gas cooktop
- Flooring: Tile flooring; Laminate flooring
- Bathrooms: Two 3/4 bathrooms
- Heating & cooling: Central heating; Refrigerated cooling; Ceiling fans
- Interior features: See remarks; No window treatments
Neighborhood map
What this means for you Summary
Snapshot
- This is a 3-bed/2.0-bath manufactured listed at $200k.
Deal economics
- At list price, monthly cash flow is $158 ($2k/yr) — positive.
- The deal already cash-flows at list — no discount required.
- Meets the 1% rule at list price ($2k rent vs $200k).
- Recommended offer: $194k (3.0% below list) — sets the bar for market timing.
Location & tenants
- Location reads 57/100 on livability (#1,277 in TX) — a working-class tenant base; expect higher turnover. Strengths: cost of living A+, housing A+; Watch: crime C-, amenities F, commute F.
- Canutillo ISD (other): math 28% / reading 39% proficiency, ranked #542 of 826 in TX (top 66%) — families likely to look elsewhere, expect single-tenant / working-renter base with shorter leases; 71% free/reduced lunch — lower-income household profile, screen leases tightly.
- Zoned schools: Canutillo El (math 22% / reading 32%, grade F, #2,791 of 4,322 statewide, top 68%, 519 students, 82% FRL); Canutillo Middle (math 21% / reading 34%, grade F, #1,156 of 1,662 statewide, top 71%, 700 students, 64% FRL); Canutillo H S (math 36% / reading 41%, grade F, #866 of 1,632 statewide, top 54%, 1,642 students, 65% FRL) — zoned schools at 70% FRL track the district average.
- Market conditions: 38 active listings in the ZIP; 1 comparable units currently listed for rent nearby; 2,196 units permitted in El Paso County in 2024 (143 in 5+ unit buildings).
Forward outlook
- In year one you build about $21k of equity ($1k loan paydown + $20k appreciation (10.0% local appreciation)).
- El Paso County population projected at +10% by 2050 — modest demand growth; plan on rents tracking national, not racing it.
- At projected returns (10.0% appreciation + 3.0% rent growth), your $56k cash investment doubles in ~3 years — after that, you're playing with house money.
- By year 2, paydown + projected appreciation supports a ~$34k cash-out refi (75% LTV) — recoverable capital for the next deal without selling this one.
Negotiation context
- It's been on market 42 days — a 3% lower offer ($194k) is reasonable based on typical stale-listing flexibility.
Risks & watch-outs
- Watch-outs: property tax is 2.7% of price.
- Climate carrying-cost: extreme-heat days projected 6→23/yr by 2055 (HVAC capex compounding) — expect insurance premiums to compound above CPI over the hold.
Questions for the listing agent
- It's been on market 42 days. Have you received any prior offers? Is the seller open to a 3% concession, seller financing, or rate buy-down credit?
- Property tax is high relative to price — has the assessment been appealed recently, and will the sale trigger a re-assessment?
- Is there a deadline driving the sale (1031 exchange, divorce, estate, relocation)? That informs how much negotiation room exists.
- Schools are F-rated, which usually means shorter tenancies and higher turnover. Who's the typical renter profile here, and what's been the actual vacancy rate?
- What's the average days-on-market for RENTAL listings here right now (not sales)? A rising rental-DOM trend means longer vacancies and softer asking-rent achievability than the comps imply.
- What's the recent tenant-quality profile in this submarket — average credit score on applications, eviction rate, late-payment / NSF rate, and stable-employment percentage? A property-management company in the area should have these aggregated.
- How much new for-sale + rental construction is in the pipeline within 1–3 miles? Heavy new supply typically softens prices + rents 12–24 months out; constrained supply supports both.
Investment metrics
- 1% rule
- 1.10% ✓
- Cap rate
- 7.24%
- Cash-on-cash
- 3.39%
- DSCR
- 1.15
- GRM
- 7.6
CMA / ARV
No comps found within radius.
Projected returns pro-forma
10.0% appreciation · 3.0% rent growth · sell at horizon
- IRR
- 26.8%
- Equity multiple
- 3.13×
- Total profit
- $119,149
- Equity at exit
- $180,175
- IRR
- 23.4%
- Equity multiple
- 7.13×
- Total profit
- $343,262
- Equity at exit
- $388,554
Cash invested: $56,000 (down + closing). Projections, not guarantees.
Landlord ↔ Tenant lean methodology
- Overall (STATE)
- 87 Strongly Landlord-Friendly
- State Texas
- 87 Strongly Landlord-Friendly · R+5
- County
- — inherits STATE
- City
- — inherits STATE
ZIP-level market 79835
- Home prices YoY
- 7.3%
- Active inventory
- 38
- Price-to-rent
- 7.6×
Monthly cashflow live
- Estimated rent
- $2,200 medium interval (Pro) →
- Mortgage (P&I)
- −$1,049
- Tax from tax record
- −$448 /mo · $5,373/yr
- Insurance
- −$83
- HOA
- −$0
- Vacancy / Maint / Mgmt
- −$462
- Net cashflow
- $158
Break-even live
UW: 25.0% down · 7.5% · 30yr · 1.5% tax · 5.0% vac · 8.0% maint · 8.0% mgmt
Financing live
Cash to close
- Down payment
- $50,000
- Closing costs
- $6,000
- Reserves months
- —
- Total cash needed
- —
Loan-product check · same deal, 3 products live
Conventional
25% down · 7.5% · 30yr
- Down + closing
- —
- Monthly P&I
- —
- Monthly cashflow
- —
- DSCR
- —
- Eligible?
- —
Personal DTI + credit; lowest rate.
DSCR
20% down · 8.5% · 30yr
- Down + closing
- —
- Monthly P&I
- —
- Monthly cashflow
- —
- DSCR
- —
- Eligible?
- —
No personal income docs; deal must DSCR.
Hard money
10% down · 12.0% · 12mo
- Down + closing
- —
- Monthly P&I
- —
- Monthly cashflow
- —
- DSCR
- —
- Eligible?
- —
Short-term bridge; refi at stabilization.
Rent comps 1 comps
| Address | Beds | Baths | Sqft | Rent | $/sqft | DOM | Units | Dist |
|---|---|---|---|---|---|---|---|---|
| 7409 Scarlet Oak Pl Canutillo, TX | 4.0 | 3.0 | 1920 | $2,200 | $1.15 | 43d | 1 | 1.44mi |
Listing history 18 events
-
2026-06-18days on market $199,999 Active 42 DOM
-
2026-06-17days on market $199,999 Active 41 DOM
-
2026-06-16days on market $199,999 Active 40 DOM
-
2026-06-15days on market $199,999 Active 39 DOM
-
2026-06-13days on market $199,999 Active 37 DOM
-
2026-06-10days on market $199,999 Active 34 DOM
-
2026-06-09days on market $199,999 Active 33 DOM
-
2026-06-08days on market $199,999 Active 32 DOM
-
2026-06-07days on market $199,999 Active 31 DOM
-
2026-06-05days on market $199,999 Active 28 DOM
-
2026-06-03days on market $199,999 Active 27 DOM
-
2026-06-03days on market $199,999 Active 26 DOM
-
2026-06-01days on market $199,999 Active 25 DOM
-
2026-05-31days on market $199,999 Active 24 DOM
-
2026-05-07$225,000 Active 625-char remark
-
2013-05-24soldstatus
-
1992-10-27soldstatus
-
1992-10-27soldstatus
ⓘ Source: listings_history table (triggers on properties + properties_extension) + one-shot
backfill from property_details.listing_events for pre-trigger history.
Tax reassessment forecast TX · Resets to sale price
- Current annual tax
- $5,373 · $448/mo
- Projected year-2 tax
- $5,373 · $448/mo
- Expected delta
- $0/yr ($0/mo · 0.0%)
ⓘ Screening estimate from a state-policy table — verify with the county assessor before closing.
Climate risk First Street
- Flood 1/10 Low 0% chance over 30 yrs
- Wildfire 4/10 Moderate
- Heat 6/10 Major 6 d/yr ≥101°F today · 23 d/yr by 30 yrs out
- Wind 1/10 Low
- Air quality 2/10 Low 1 unhealthy d/yr today · 1 by 30 yrs out
Nearby sold comps map
Loading sold comps map…
Walkable amenities ~0.75 mi
Loading nearby amenities…
Taxation est. · year 1
- Rental income
- $26,400
- − Mortgage interest
- −$11,203
- − Property taxes
- −$5,373
- − Insurance
- −$1,000
- − Repairs & maintenance
- −$2,112
- − Management
- −$2,112
- − Depreciation
- −$5,818
- Taxable loss
- −$1,218
- Est. tax savings @ 24.0%
- +$292
- After-tax cash flow
- $2,190/yr
For passive investors: Depreciation is non-cash, so a rental often shows a tax loss while cash-flowing — sheltering income. Rental losses are passive: they offset passive income freely, and up to $25,000/yr can offset ordinary (W-2) income if you actively participate and your MAGI is under $100k (phasing out to $0 by $150k); unused losses carry forward. On sale, claimed depreciation is recaptured at up to 25%, and gains may owe capital-gains tax (a 1031 exchange can defer both). Figures are a year-1 estimate at your 24.0% rate — not tax advice; consult a CPA.
Schools (NCES district)
- District
- Canutillo ISD
- NCES district ID
- 4812780
- Math proficiency
- 28% ▼ -23.00%
- Reading proficiency
- 39% ▼ -7.00%
- Median HH income
- $48,327
- Composite
- 28.91/100
- National rank
- #6636
- State rank
- #542 of 826 in TX
Livability — Canutillo
- Score
- 57/100
- State rank
- #1277
- US rank
- #22193
Category grades
Schools grade is shown separately in the Schools card above.
Census & demographics
- Census place
- Canutillo, TX
- Population (ZIP)
- 12,289
Population outlook (El Paso County) Hauer SSP2
- Today (2025)
- 897,899 people
- By 2030
- 922,694 · +2.8%
- By 2040
- 960,492 · +7.0%
- By 2050
- 982,919 · +9.5%
- By 2075
- 997,266 · +11.1%
- By 2100
- 900,630 · +0.3%
Race, ethnicity, and origin ACS 2023
- Neighborhood character
- Predominantly Hispanic (93%)
- Race & ethnicity
- Hispanic / Latino 93% Two or more races 25% White 5% Asian 1%
- Hispanic origin (detail)
- Mexican 87%
- Common ancestry
- Serbian 2%
- Foreign-born
- 32% · Canada, Vietnam
- Languages at home
- 23% English-only · Spanish 76% Vietnamese 1%
Political lean MEDSL · El Paso
- 2024 margin
- D (+15.1) · D 57.0% · R 41.8% · Other 1.2%
- 2008→2024 swing
- -17.4pp toward R · 2008: 32.5pp · 2024: 15.1pp
- All cycles
- 2024: D+15.1 2020: D+35.1 2016: D+43.2 2012: D+32.6 2008: D+32.5
Not yet ingested
- Civics
- —
Market trends
- HPI YoY
- ▲ 13.05%
- Current HPI
- 191.76
- Rent YoY
- —
- Metro
- —
- State GDP YoY
- ▲ 3.95%
- F500 in state
- 110
Industry mix (Fortune 500 HQ in TX)
| Industry | F500 HQs | Revenue |
|---|---|---|
| Energy | 16 | $1,198B |
|
||
| Technology | 5 | $198B |
|
||
| Engineering / Construction | 4 | $72B |
|
||
| Energy Services | 3 | $60B |
|
||
| Utilities | 3 | $41B |
|
||
| Healthcare | 2 | $330B |
|
||
Price history
-11.1% since first listed5 events — show timeline
- 2026-05-29 Price Changed $199,999 GEPARMLS
- 2026-05-07 Listed $225,000 GEPARMLS
- 2013-05-24 Sold (Public Records) — Public Records
- 1992-10-27 Sold (Public Records) — Public Records
- 1992-10-27 Sold (Public Records) — Public Records
Property tax history
+15.7%/yrLatest (2025): $5,373 · +34.0% YoY. Source: county tax records.
Cash-flow waterfall
monthlySold comps — $/sqft
last 12 mo · ≤1 miLoading sold comps…