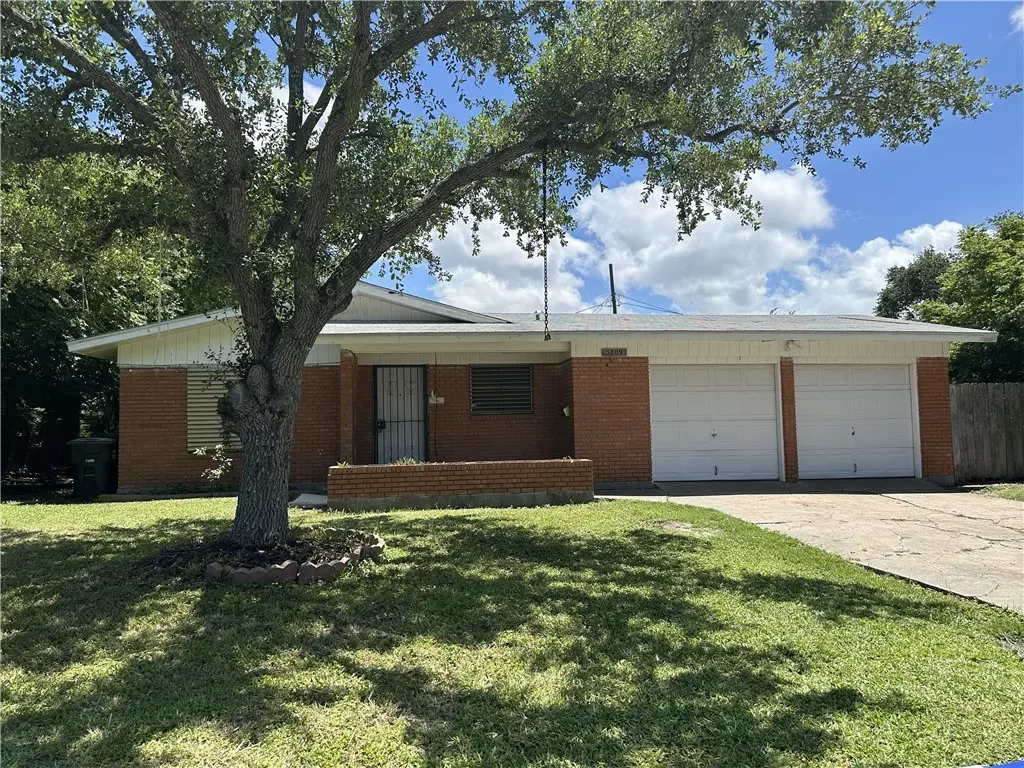
5809 Shamrock Dr · Corpus Christi, TX
Flood risk 7/10 · Major
- FEMA flood zone
- X (unshaded)
- Chance of flooding over 30 yrs
- 0.99%
- Est. flood insurance / yr
- $507 – $1,088
Fire risk 1/10 · Minimal
- Est. fire insurance / yr
- $1,222 – $2,270
Heat risk 10/10 · Severe
- Hot days now (above 107°F)
- 7 days/yr
- Hot days in 30 yrs
- 27 days/yr
Wind risk 9/10 · Severe
- Chance of severe wind over 30 yrs
- 99.0%
Air-quality risk 1/10 · Minimal
- Unhealthy air days now
- 0 days/yr
- Unhealthy air days in 30 yrs
- 0 days/yr
Risk factors via First Street. Map © Google.
Why this score? — see what drove the B- grade
The composite is a weighted blend of 9 inputs, each scored 0–100. Each bar is that input's sub-score; the figure is the points it added to the 100-point composite (weight × sub-score).
- Cash flow +25.8/30.0
- ARV discount +15.0/15.0
- DSCR +8.6/10.0
- 1% rule +8.2/10.0
- Livability +3.9/5.0
- Schools +2.8/10.0
- Condition / age +2.5/5.0
- Rent growth +2.1/5.0
- Appreciation +0.0/10.0
$120,000
🖨 Deal sheet 📄 Offer letter ✓ Due diligence
Listing remarks
Charming 3-bedroom, 1-bath home located in a highly desired neighborhood near beautiful Corpus Christi Bay! This property features a spacious 2-car garage, a large backyard with endless possibilities, and a location that offers convenience to shopping, schools, and local attractions. Perfect for investors or buyers looking to add value and make it their own, this home is full of potential and opportunity. Property is being sold as-is, making it an excellent chance for investors, flippers, or buyers wanting to customize and create their vision. Don’t miss this opportunity to own a home in a sought-after area with great upside potential!
Key facts
- 7,645 sq ft lot
- 2 garage spots
- Built 1957
Property features AI
Exterior
- Parking: Front-entry 2-car garage; Asphalt driveway; 2 total parking spaces (2 covered)
- Utilities: Public water; Public sewer; Separate meters
- Home design: Single-story home; Brick veneer construction; Shingle roof; Slab foundation
- Construction: Brick and veneer construction; Shingle roof; Slab foundation; Built with 1 story
- Exterior features: Covered patio; Patio; Chain link fencing; Landscaped lot
Interior
- Flooring: Hardwood floors; Laminate floors
- Bathrooms: 1 full bathroom
- Heating & cooling: Central heating (electric); Central air conditioning
- Interior features: No additional interior features listed
- Laundry & utility: Washer hookup; Dryer hookup
Neighborhood map
What this means for you Summary
Snapshot
- This is a 3-bed/1.0-bath single-family listed at $120k.
Deal economics
- At list price, monthly cash flow is $224 ($3k/yr) — positive.
- The deal already cash-flows at list — no discount required.
- Meets the 1% rule at list price ($2k rent vs $120k).
- Cap rate 9.2% vs local median 3.6% in Corpus Christi — top-decile yield for the area; either an underpriced asset or a hidden risk that comps aren't pricing in. Stress-test before assuming the spread holds.
Location & tenants
- Location reads 78/100 on livability (#66 in TX, #2,404 nationally) — a middle-class / working-renter tenant base. Strengths: commute A+, cost of living A+, housing A+; Watch: crime F.
- Corpus Christi ISD (urban): math 31% / reading 35% proficiency, ranked #562 of 826 in TX (top 68%) — families likely to look elsewhere, expect single-tenant / working-renter base with shorter leases; 63% free/reduced lunch — lower-income household profile, screen leases tightly.
- Market conditions: Rents soft (-1.5%/yr); 207 active listings in the ZIP; 34 comparable units currently listed for rent nearby; rentals at typical pace (median 21d on market — plan ~3-4 weeks tenant-placement turnaround); 41% of comp listings sitting > 30 days — soft ceiling on asking rent; 1,397 units permitted in Nueces County in 2024 (47 in 5+ unit buildings).
- This rent runs 31% of the median local income ($61k/yr) — at the standard rent-burdened threshold; future hikes will face affordability resistance.
Forward outlook
- Local home prices are declining (-3.0%/yr); year-one equity from $830 of loan paydown is wiped out by about $4k of value loss. Plan a longer hold.
- Nueces County population projected at +36% by 2050 — long-run rental-demand tailwind backs the buy-and-hold thesis.
Negotiation context
- Only 2 days on market — expect competitive offers; lowballing is unlikely to land.
Risks & watch-outs
- Watch-outs: property tax is 2.9% of price; flood insurance adds $66/mo; built in 1957 — expect roof / HVAC / electrical / plumbing capex.
- Climate carrying-cost: major flood risk; severe wind risk, 99% chance of damaging wind over 30y; extreme-heat days projected 7→27/yr by 2055 (HVAC capex compounding) — expect insurance premiums to compound above CPI over the hold.
Questions for the listing agent
- Built in 1957 — when were the roof, HVAC, electrical panel, plumbing, and water heater last replaced?
- Property tax is high relative to price — has the assessment been appealed recently, and will the sale trigger a re-assessment?
- What's the actual annual flood-insurance premium (NFIP or private), and is the property in a SFHA with mandatory coverage?
- Is there a deadline driving the sale (1031 exchange, divorce, estate, relocation)? That informs how much negotiation room exists.
- Crime grade is F in this area — have there been break-ins, vandalism, or insurance claims at this property in the last 3 years? What carrier currently insures it and at what premium?
- What's the average days-on-market for RENTAL listings here right now (not sales)? A rising rental-DOM trend means longer vacancies and softer asking-rent achievability than the comps imply.
- What's the recent tenant-quality profile in this submarket — average credit score on applications, eviction rate, late-payment / NSF rate, and stable-employment percentage? A property-management company in the area should have these aggregated.
- How much new for-sale + rental construction is in the pipeline within 1–3 miles? Heavy new supply typically softens prices + rents 12–24 months out; constrained supply supports both.
Investment metrics
- 1% rule
- 1.32% ✓
- Cap rate
- 9.19%
- Cash-on-cash
- 10.36%
- DSCR
- 1.46
- GRM
- 6.3
CMA / ARV
- ARV (on-the-fly)
- $182,376
- Comps found
- 12
Show comp detail 12 sales within ~0.75 mi
| Address | Dist | Beds/Ba | Sqft | Sold | Price | $/sf | Match |
|---|---|---|---|---|---|---|---|
| 5809 Shamrock Dr | 0.00mi | 3/1.0 | 1,341 (0%) | 1mo | $120,000 | $89 | 100 |
| 830 Crestview Dr | 0.23mi | 3/1.5 | 1,348 (+0%) | 1mo | $149,900 | $111 | 85 |
| 1022 Whitaker Dr | 0.47mi | 3/1.0 | 1,312 (-2%) | 1mo | $179,000 | $136 | 74 |
| 517 Handover Dr | 0.58mi | 3/2.0 | 1,340 (-0%) | 3mo | $235,000 | $175 | 67 |
| 1102 Bradshaw Dr | 0.40mi | 3/2.0 | 1,426 (+6%) | 1mo | $219,000 | $154 | 66 |
| 1025 Monette Dr | 0.57mi | 3/2.0 | 1,300 (-3%) | 1mo | $225,000 | $173 | 64 |
| 1122 Bernice Dr | 0.67mi | 3/2.0 | 1,345 (+0%) | 6mo | $179,900 | $134 | 59 |
| 1126 Stratton | 0.42mi | 2/1.5 (-1) | 1,452 (+8%) | 4mo | $165,000 | $114 | 56 |
| 729 Chase Dr | 0.70mi | 3/1.0 | 1,254 (-6%) | 6mo | $169,900 | $135 | 51 |
| 1222 Salem Dr | 0.45mi | 3/2.0 | 1,186 (-12%) | 6mo | $195,000 | $164 | 50 |
| 6118 Burr Dr | 0.54mi | 2/1.0 (-1) | 1,192 (-11%) | 2mo | $165,000 | $138 | 50 |
| 722 Chase Dr | 0.73mi | 4/1.0 (+1) | 1,211 (-10%) | 6mo | $110,000 | $91 | 40 |
Match score weights: distance 35% · size 25% · config 20% · recency 20%. Top-matched comps best support the ARV.
Projected returns pro-forma
-3.0% appreciation · 0.0% rent growth · sell at horizon
- IRR
- -8.1%
- Equity multiple
- 0.71×
- Total profit
- $-9,712
- Equity at exit
- $17,892
- IRR
- -4.0%
- Equity multiple
- 0.78×
- Total profit
- $-7,514
- Equity at exit
- $10,375
Cash invested: $33,600 (down + closing). Projections, not guarantees.
Landlord ↔ Tenant lean methodology
- Overall (STATE)
- 87 Strongly Landlord-Friendly
- State Texas
- 87 Strongly Landlord-Friendly · R+5
- County
- — inherits STATE
- City
- — inherits STATE
ZIP-level market 78412
- Rents YoY
- -1.5%
- Active inventory
- 207
- Price-to-rent
- 6.3×
Monthly cashflow live
- Estimated rent
- $1,589 high interval (Pro) →
- Mortgage (P&I)
- −$629
- Tax from tax record
- −$286 /mo · $3,433/yr
- Insurance
- −$50
- Flood insurance flood zone
- −$66 /mo · $798/yr
- HOA
- −$0
- Vacancy / Maint / Mgmt
- −$334
- Net cashflow
- $224
Break-even live
UW: 25.0% down · 7.5% · 30yr · 1.5% tax · 5.0% vac · 8.0% maint · 8.0% mgmt
Financing live
Cash to close
- Down payment
- $30,000
- Closing costs
- $3,600
- Reserves months
- —
- Total cash needed
- —
Loan-product check · same deal, 3 products live
Conventional
25% down · 7.5% · 30yr
- Down + closing
- —
- Monthly P&I
- —
- Monthly cashflow
- —
- DSCR
- —
- Eligible?
- —
Personal DTI + credit; lowest rate.
DSCR
20% down · 8.5% · 30yr
- Down + closing
- —
- Monthly P&I
- —
- Monthly cashflow
- —
- DSCR
- —
- Eligible?
- —
No personal income docs; deal must DSCR.
Hard money
10% down · 12.0% · 12mo
- Down + closing
- —
- Monthly P&I
- —
- Monthly cashflow
- —
- DSCR
- —
- Eligible?
- —
Short-term bridge; refi at stabilization.
Rent comps 34 comps
| Address | Beds | Baths | Sqft | Rent | $/sqft | DOM | Units | Dist |
|---|---|---|---|---|---|---|---|---|
| 5825 Hugo Dr Corpus Christi, TX | 3.0 | 1.0 | 970 | $1,550 | $1.60 | 13d | 1 | 0.07mi |
| 946 Lum Ave Corpus Christi, TX | 3.0 | 1.0 | 1045 | $1,300 | $1.24 | 44d | 1 | 0.14mi |
| 857 Belmeade Dr Corpus Christi, TX | 3.0 | 2.0 | 1573 | $1,800 | $1.14 | 44d | 1 | 0.24mi |
| 5921 Riley Dr Corpus Christi, TX | 3.0 | 1.0 | 1134 | $1,795 | $1.58 | 21d | 1 | 0.28mi |
| 1033 Bradshaw Dr Corpus Christi, TX | 3.0 | 2.0 | 1194 | $1,750 | $1.47 | 44d | 1 | 0.38mi |
| 1106 Stratton Dr Corpus Christi, TX | 2.0 | 1.0 | 1509 | $1,300 | $0.86 | 13d | 1 | 0.39mi |
| 1218 Vance Dr Corpus Christi, TX | 4.0 | 1.5 | 1200 | $1,895 | $1.58 | 44d | 1 | 0.48mi |
| 1137 Bradshaw Dr Corpus Christi, TX | 3.0 | 2.0 | 1424 | $1,900 | $1.33 | 13d | 1 | 0.48mi |
| 4848 S Alameda St Corpus Christi, TX | 2.0 | 1.0 | 1085 | $975 | $0.90 | 44d | 1 | 0.68mi |
| 749 Ashland Dr Corpus Christi, TX | 3.0 | 1.0 | 1179 | $1,550 | $1.31 | 44d | 1 | 0.76mi |
| 1206 Rickey Dr Corpus Christi, TX | 3.0 | 1.0 | 1131 | $1,100 | $0.97 | 13d | 1 | 0.88mi |
| 5002 Bevly Dr Unit A Corpus Christi, TX | 3.0 | 2.0 | 1400 | $1,499 | $1.07 | 21d | 1 | 0.91mi |
| 722 Collingswood Dr Corpus Christi, TX | 3.0 | 1.5 | 1318 | $1,595 | $1.21 | 13d | 1 | 0.96mi |
| 4801 Lansdown Dr Corpus Christi, TX | 3.0 | 2.0 | 1242 | $1,525 | $1.23 | 13d | 1 | 0.97mi |
| 5750 Curtis Clark Dr Corpus Christi, TX | 2.0 | 1.0–2.0 | 756 | $1,560 | $2.06 | 13d | 20 | 1.01mi |
| 4422 S Alameda St Corpus Christi, TX | 1.0–3.0 | 1.0–2.0 | 820 | $1,000 | $1.22 | 13d | 1 | 1.04mi |
| 5808 S Alameda St Corpus Christi, TX | 1.0–2.0 | 1.0 | 803 | $1,199 | $1.49 | 13d | 2 | 1.19mi |
| 5808 S Alameda St Unit 5822A Corpus Christi, TX | 2.0 | 1.0 | 931 | $1,199 | $1.29 | 21d | 1 | 1.19mi |
| 4657 Ocean Dr Corpus Christi, TX | 1.0–2.0 | 1.0–2.0 | 931 | $1,890 | $2.03 | 13d | 7 | 1.22mi |
| 4645 Ocean Dr Corpus Christi, TX | 2.0 | 1.0–2.0 | 760 | $1,320 | $1.74 | 13d | 1 | 1.24mi |
| 417 Whitehall Dr Corpus Christi, TX | 3.0 | 1.0 | 969 | $1,395 | $1.44 | 44d | 1 | 1.25mi |
| 1622 Woodlawn Dr Corpus Christi, TX | 3.0 | 2.0 | 1152 | $1,895 | $1.64 | 13d | 1 | 1.29mi |
| 4602 Ocean Dr Corpus Christi, TX | 1.0–2.0 | 1.0–2.0 | 972 | $3,671 | $3.77 | 13d | 30 | 1.31mi |
| 2006 Melisa Ln Corpus Christi, TX | 3.0 | 1.0 | 1324 | $1,450 | $1.10 | 21d | 1 | 1.33mi |
| 2006 Melisa Ln Corpus Christi, TX | 3.0 | 1.0 | 1324 | $1,450 | $1.10 | 13d | 1 | 1.33mi |
| 802 Barry St Corpus Christi, TX | 2.0 | 1.5 | 1102 | $1,529 | $1.39 | 44d | 1 | 1.34mi |
| 309 Whitehall Dr Corpus Christi, TX | 3.0 | 1.0 | 1159 | $1,500 | $1.29 | 44d | 1 | 1.36mi |
| 6433 Aspenwood Dr Corpus Christi, TX | 3.0 | 2.0 | 1465 | $1,750 | $1.19 | 44d | 1 | 1.38mi |
| 6136 Hidden Cv Corpus Christi, TX | 2.0 | 1.5 | 1047 | $1,450 | $1.38 | 44d | 1 | 1.40mi |
| 6118 Hidden Cv Corpus Christi, TX | 2.0 | 1.0 | 991 | $1,050 | $1.06 | 44d | 1 | 1.40mi |
| 4201 Junior Ter Corpus Christi, TX | 3.0 | 1.0 | 1016 | $1,600 | $1.57 | 44d | 1 | 1.40mi |
| 2002 Airline Rd Corpus Christi, TX | 1.0–3.0 | 1.0–2.0 | 794 | $1,440 | $1.81 | 13d | 19 | 1.41mi |
| 2058 Hidden Lk Corpus Christi, TX | 2.0 | 1.0 | 991 | $1,200 | $1.21 | 21d | 1 | 1.43mi |
| 4110 Grossman Dr Unit B Corpus Christi, TX | 3.0 | 2.0 | 1228 | $1,500 | $1.22 | 44d | 1 | 1.49mi |
Listing history 2 events
-
2026-05-25$120,000 Active
-
2012-09-21soldstatus
ⓘ Source: listings_history table (triggers on properties + properties_extension) + one-shot
backfill from property_details.listing_events for pre-trigger history.
Tax reassessment forecast TX · Resets to sale price
- Current annual tax
- $3,433 · $286/mo
- Projected year-2 tax
- $3,433 · $286/mo
- Expected delta
- $0/yr ($0/mo · 0.0%)
ⓘ Screening estimate from a state-policy table — verify with the county assessor before closing.
Climate risk First Street
- Flood 7/10 Severe FEMA zone X (unshaded) · 99% chance over 30 yrs
- Wildfire 1/10 Low
- Heat 10/10 Extreme 7 d/yr ≥107°F today · 27 d/yr by 30 yrs out
- Wind 9/10 Extreme 99% chance of damaging wind over 30 yrs
- Air quality 1/10 Low 0 unhealthy d/yr today · 0 by 30 yrs out
Nearby sold comps map
Loading sold comps map…
Walkable amenities ~0.75 mi
Loading nearby amenities…
Taxation est. · year 1
- Rental income
- $19,070
- − Mortgage interest
- −$6,722
- − Property taxes
- −$3,433
- − Insurance
- −$1,398
- − Repairs & maintenance
- −$1,526
- − Management
- −$1,526
- − Depreciation
- −$3,491
- Taxable income
- $976
- Est. tax owed @ 24.0%
- −$234
- After-tax cash flow
- $2,449/yr
For passive investors: Depreciation is non-cash, so a rental often shows a tax loss while cash-flowing — sheltering income. Rental losses are passive: they offset passive income freely, and up to $25,000/yr can offset ordinary (W-2) income if you actively participate and your MAGI is under $100k (phasing out to $0 by $150k); unused losses carry forward. On sale, claimed depreciation is recaptured at up to 25%, and gains may owe capital-gains tax (a 1031 exchange can defer both). Figures are a year-1 estimate at your 24.0% rate — not tax advice; consult a CPA.
Schools (NCES district)
- District
- Corpus Christi ISD
- NCES district ID
- 4815270
- Math proficiency
- 31% ▼ -18.00%
- Reading proficiency
- 35% ▼ -7.00%
- Median HH income
- $45,672
- Composite
- 28.27/100
- National rank
- #6793
- State rank
- #562 of 826 in TX
Livability — Corpus Christi
- Score
- 78/100
- State rank
- #66
- US rank
- #2404
Category grades
Schools grade is shown separately in the Schools card above.
Census & demographics
- Census place
- Corpus Christi, TX
- County
- Nueces County · 296,836 people
- City population
- 296,836
- Metro
- Corpus Christi, TX
- Population (ZIP)
- 38,631
- Household income
- $61,215
- Rent vs Own
- Severe rent burden
- 1932.0
Population outlook (Nueces County) Hauer SSP2
- Today (2025)
- 418,037 people
- By 2030
- 447,123 · +7.0%
- By 2040
- 505,911 · +21.0%
- By 2050
- 567,522 · +35.8%
- By 2075
- 729,686 · +74.6%
- By 2100
- 847,087 · +102.6%
Race, ethnicity, and origin ACS 2023
- Neighborhood character
- Diverse neighborhood (Simpson 0.56)
- Race & ethnicity
- Hispanic / Latino 57% White 34% Two or more races 29% Asian 4% Black 3%
- Hispanic origin (detail)
- Mexican 52%
- Common ancestry
- Slovak 2% Romanian 1% Lithuanian 1%
- Foreign-born
- 8% · Canada, China, Vietnam
- Languages at home
- 74% English-only · Spanish 22% Other Indo-European 1% Vietnamese 1%
Political lean MEDSL · Nueces
- 2024 margin
- R (+11.5) · D 43.8% · R 55.3%
- 2008→2024 swing
- -7.1pp toward R · 2008: -4.4pp · 2024: -11.5pp
- All cycles
- 2024: R+11.5 2020: R+2.9 2016: R+1.5 2012: R+3.2 2008: R+4.4
Not yet ingested
- Civics
- —
Market trends
- HPI YoY
- ▼ -255.29%
- Current HPI
- 177.36
- Rent YoY
- ▼ -1.53%
- Metro
- Corpus Christi, TX
- State GDP YoY
- ▲ 3.95%
- F500 in state
- 110
Industry mix (Fortune 500 HQ in TX)
| Industry | F500 HQs | Revenue |
|---|---|---|
| Energy | 16 | $1,198B |
|
||
| Technology | 5 | $198B |
|
||
| Engineering / Construction | 4 | $72B |
|
||
| Energy Services | 3 | $60B |
|
||
| Utilities | 3 | $41B |
|
||
| Healthcare | 2 | $330B |
|
||
Price history
2 events — show timeline
- 2026-05-25 Listed $120,000 CBMLS
- 2012-09-21 Sold (Public Records) — Public Records
Property tax history
+3.6%/yrLatest (2025): $3,433 · -0.7% YoY. Source: county tax records.
Cash-flow waterfall
monthlySold comps — $/sqft
last 12 mo · ≤1 miLoading sold comps…