 Multi-family
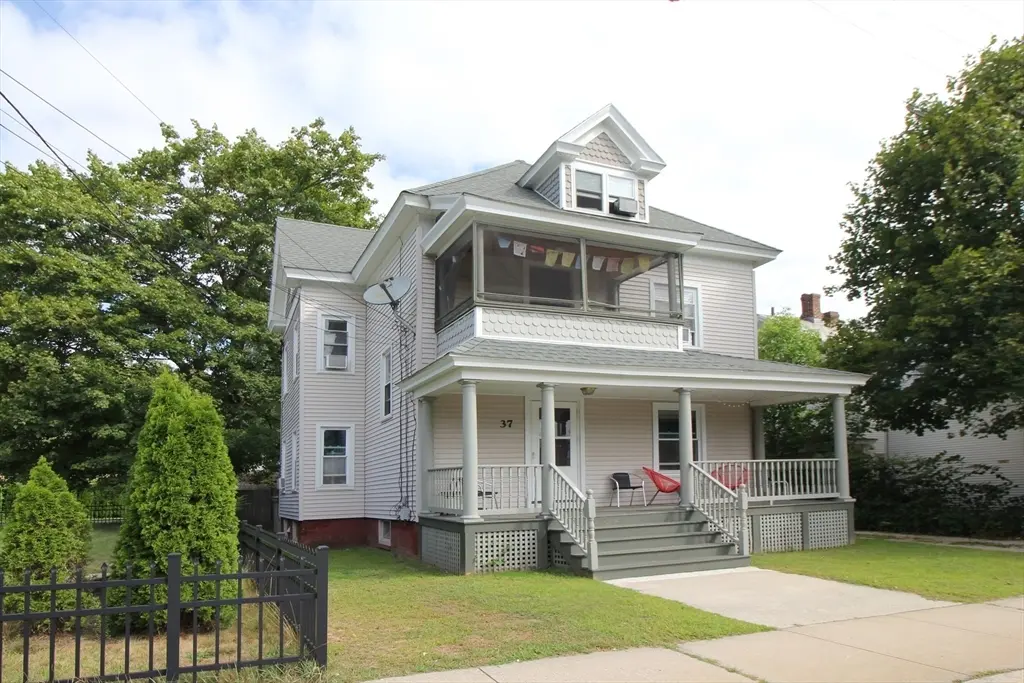
37 Finn St · Northampton, MA
Flood risk 1/10 · Minimal
- FEMA flood zone
- X
- Chance of flooding over 30 yrs
- 0.0%
- Est. flood insurance / yr
- $473 – $860
Fire risk 1/10 · Minimal
- Est. fire insurance / yr
- $915 – $1,699
Heat risk 4/10 · Minor
- Hot days now (above 97°F)
- 7 days/yr
- Hot days in 30 yrs
- 16 days/yr
Wind risk 4/10 · Minor
- Chance of severe wind over 30 yrs
- 18.0%
Air-quality risk 2/10 · Minimal
- Unhealthy air days now
- 1 days/yr
- Unhealthy air days in 30 yrs
- 1 days/yr
Risk factors via First Street. Map © Google.
Why this score? — see what drove the C grade
The composite is a weighted blend of 9 inputs, each scored 0–100. Each bar is that input's sub-score; the figure is the points it added to the 100-point composite (weight × sub-score).
- Cash flow +23.9/30.0
- DSCR +7.7/10.0
- 1% rule +5.5/10.0
- ARV discount +4.9/15.0
- Rent growth +4.0/5.0
- Schools +3.9/10.0
- Livability +3.9/5.0
- Condition / age +2.5/5.0
- Appreciation +0.0/10.0
$735,000
🖨 Deal sheet 📄 Offer letter ✓ Due diligence
Multi-family units
County records classify this as Multi-Family (2-4 Unit). Listing-text estimate: 1 unit. estimate disagrees with records
Listing remarks MLS
Downtown 2 apartments with 3rd income option / walk to downtown & easy commute highway access / well maintained, inside & out / large 1st floor front porch & 2nd floor has a private porch as well / common laundry in basement./ (attic unit is 1 open space that has K, Bdrm, Lvrm, Bath / Great appeal for 1st time buyer or long term investment.
Key facts
- Private porch
- Walk to downtown
- 3,720 sq ft lot
Tags
Neighborhood map
What this means for you Summary
Snapshot
- This is a 3-bed/2.0-bath multifamily listed at $735k.
Deal economics
- At list price, monthly cash flow is $1k ($17k/yr) — positive.
- The deal already cash-flows at list — no discount required.
- Meets the 1% rule at list price ($8k rent vs $735k).
- Recommended offer: $647k (12.0% below list) — sets the bar for market timing.
- Cap rate 8.6% vs local median 2.2% in Northampton — top-decile yield for the area; either an underpriced asset or a hidden risk that comps aren't pricing in. Stress-test before assuming the spread holds.
Location & tenants
- Location reads 78/100 on livability (#49 in MA, #2,534 nationally) — a middle-class / working-renter tenant base. Strengths: commute A+, health & safety A+, employment A; Watch: crime D+, amenities F, cost of living F.
- Northampton (suburban): math 36% / reading 53% proficiency, ranked #175 of 302 in MA (top 58%) — families likely to look elsewhere, expect single-tenant / working-renter base with shorter leases.
- Market conditions: Rents rising fast (+5.9%/yr); 41 active listings in the ZIP; solid renter incomes; 349 units permitted in Hampshire County in 2024 (185 in 5+ unit buildings).
- At $7,700/mo this rent would consume 120% of the median local household income ($77k/yr) (locally 1269% of renters already pay >50% of income on rent) — very limited rent-growth headroom before tenants either downsize or default.
Forward outlook
- Local home prices are declining (-3.0%/yr); year-one equity from $5k of loan paydown is wiped out by about $22k of value loss. Plan a longer hold.
- Hampshire County population projected at +5% by 2050 — modest demand growth; plan on rents tracking national, not racing it.
- At projected returns (-3.0% appreciation + 5.9% rent growth), your $206k cash investment doubles in ~9 years — after that, you're playing with house money.
Negotiation context
- It's been on market 290 days — a 12% lower offer ($647k) is reasonable based on typical stale-listing flexibility.
- 2 sale attempts with the ask held roughly flat each time — persistent listings suggest the price (not the market) is what's stuck; bring a comps-based counter.
- Current owner paid $249k; list at $735k implies a 196% gain — meaningful room to come down on a strong offer.
Risks & watch-outs
- Watch-outs: built in 1900 — expect roof / HVAC / electrical / plumbing capex.
Questions for the listing agent
- It's been on market 290 days. Have you received any prior offers? Is the seller open to a 12% concession, seller financing, or rate buy-down credit?
- Built in 1900 — when were the roof, HVAC, electrical panel, plumbing, and water heater last replaced?
- Why hasn't it sold? Are there any deal-killer items the seller is aware of (foundation, flood, title, zoning, code violations)?
- Is there a deadline driving the sale (1031 exchange, divorce, estate, relocation)? That informs how much negotiation room exists.
- Crime grade is D in this area — have there been break-ins, vandalism, or insurance claims at this property in the last 3 years? What carrier currently insures it and at what premium?
- What's the average days-on-market for RENTAL listings here right now (not sales)? A rising rental-DOM trend means longer vacancies and softer asking-rent achievability than the comps imply.
- What's the recent tenant-quality profile in this submarket — average credit score on applications, eviction rate, late-payment / NSF rate, and stable-employment percentage? A property-management company in the area should have these aggregated.
- How much new apartment / multifamily construction is in the pipeline within 1–3 miles? Heavy new supply (>2% of stock underway) typically softens rents 12–24 months out; light construction supports rent growth.
Investment metrics
- 1% rule
- 1.05% ✓
- Cap rate
- 8.62%
- Cash-on-cash
- 8.33%
- DSCR
- 1.37
- GRM
- 8.0
CMA / ARV
- ARV (median comp)
- $694,836
- List price
- $735,000
- Delta
- 5.78%
- Verdict
- FAIR
- Comps
- 20 within 1.0 mi
Show comp detail 5 sales within ~0.75 mi
| Address | Dist | Beds/Ba | Sqft | Sold | Price | $/sf | Match |
|---|---|---|---|---|---|---|---|
| 12 Day Ave | 0.62mi | 4/2.0 (+1) | 2,406 (+4%) | 10mo | $625,000 | $260 | 50 |
| 61 Old South St | 0.73mi | 4/2.0 (+1) | 2,486 (+8%) | 0mo | $433,000 | $174 | 48 |
| 30 Grant Ave | 0.52mi | 4/3.0 (+1) | 2,376 (+3%) | 17mo | $550,000 | $231 | 48 |
| 52 Elizabeth St | 0.46mi | 4/2.0 (+1) | 2,036 (-12%) | 9mo | $600,000 | $295 | 47 |
| 38 Walnut St | 0.35mi | 4/2.0 (+1) | 2,028 (-12%) | 21mo | $490,000 | $242 | 42 |
Match score weights: distance 35% · size 25% · config 20% · recency 20%. Top-matched comps best support the ARV.
Projected returns pro-forma
-3.0% appreciation · 5.87% rent growth · sell at horizon
- IRR
- -0.7%
- Equity multiple
- 0.97×
- Total profit
- $-5,423
- Equity at exit
- $109,591
- IRR
- 11.6%
- Equity multiple
- 2.03×
- Total profit
- $211,359
- Equity at exit
- $63,549
Cash invested: $205,800 (down + closing). Projections, not guarantees.
Landlord ↔ Tenant lean methodology
- Overall (STATE)
- 20 Strongly Tenant-Friendly
- State Massachusetts
- 20 Strongly Tenant-Friendly · D+15
- County
- — inherits STATE
- City
- — inherits STATE
ZIP-level market 01060
- Rents YoY
- 5.9%
- Active inventory
- 41
- Price-to-rent
- 23.9×
Monthly cashflow live
- Estimated rent
- $7,700 medium interval (Pro) →
- Mortgage (P&I)
- −$3,854
- Tax from tax record
- −$494 /mo · $5,932/yr
- Insurance
- −$306
- HOA
- −$0
- Vacancy / Maint / Mgmt
- −$1,617
- Net cashflow
- $1,428
Break-even live
3-unit breakdown (identical units grouped — click to expand)
| Units | Beds | Baths | Est. rent |
|---|---|---|---|
| 3× units | 3 | 1 | $7,701 |
| #1 | 3 | 1 | $2,567 |
| #2 | 3 | 1 | $2,567 |
| #3 | 3 | 1 | $2,567 |
| Total (3 units) | $7,700 | ||
UW: 25.0% down · 7.5% · 30yr · 1.5% tax · 5.0% vac · 8.0% maint · 8.0% mgmt
Financing live
Cash to close
- Down payment
- $183,750
- Closing costs
- $22,050
- Reserves months
- —
- Total cash needed
- —
Loan-product check · same deal, 3 products live
Conventional
25% down · 7.5% · 30yr
- Down + closing
- —
- Monthly P&I
- —
- Monthly cashflow
- —
- DSCR
- —
- Eligible?
- —
Personal DTI + credit; lowest rate.
DSCR
20% down · 8.5% · 30yr
- Down + closing
- —
- Monthly P&I
- —
- Monthly cashflow
- —
- DSCR
- —
- Eligible?
- —
No personal income docs; deal must DSCR.
Hard money
10% down · 12.0% · 12mo
- Down + closing
- —
- Monthly P&I
- —
- Monthly cashflow
- —
- DSCR
- —
- Eligible?
- —
Short-term bridge; refi at stabilization.
Listing history 20 events
-
2026-06-18days on market $735,000 Active 290 DOM
-
2026-06-17days on market $735,000 Active 289 DOM
-
2026-06-16days on market $735,000 Active 288 DOM
-
2026-06-15days on market $735,000 Active 287 DOM
-
2026-06-14days on market $735,000 Active 285 DOM
-
2026-06-13days on market $735,000 Active 284 DOM
-
2026-06-10days on market $735,000 Active 282 DOM
-
2026-06-09days on market $735,000 Active 281 DOM
-
2026-06-08days on market $735,000 Active 280 DOM
-
2026-06-07days on market $735,000 Active 279 DOM
-
2026-06-05days on market $735,000 Active 276 DOM
-
2026-06-03days on market $735,000 Active 275 DOM
-
2026-06-02days on market $735,000 Active 274 DOM
-
2026-06-01days on market $735,000 Active 273 DOM
-
2026-05-31days on market $735,000 Active 272 DOM
-
2026-05-30days on market $735,000 Active 271 DOM
-
2026-04-02status Reactivated 356-char remark
Show marketing remark (356 chars)
Downtown 2 apartments with 3rd income option / walk to downtown & easy commute highway access / well maintained, inside & out / large 1st floor front porch & 2nd floor has a private porch as well / common laundry in basement./ (attic unit is 1 open space that has K, Bdrm, Lvrm, Bath / Great appeal for 1st time buyer or long term investment.
-
2026-03-31historical 356-char remark
Show marketing remark (356 chars)
Downtown 2 apartments with 3rd income option / walk to downtown & easy commute highway access / well maintained, inside & out / large 1st floor front porch & 2nd floor has a private porch as well / common laundry in basement./ (attic unit is 1 open space that has K, Bdrm, Lvrm, Bath / Great appeal for 1st time buyer or long term investment.
-
2025-08-30$735,000 New 356-char remark
Show marketing remark (356 chars)
Downtown 2 apartments with 3rd income option / walk to downtown & easy commute highway access / well maintained, inside & out / large 1st floor front porch & 2nd floor has a private porch as well / common laundry in basement./ (attic unit is 1 open space that has K, Bdrm, Lvrm, Bath / Great appeal for 1st time buyer or long term investment.
-
2005-08-11soldstatus $248,725
ⓘ Source: listings_history table (triggers on properties + properties_extension) + one-shot
backfill from property_details.listing_events for pre-trigger history.
Tax reassessment forecast MA · Partial reset (capped growth)
- Current annual tax
- $5,932 · $494/mo
- Projected year-2 tax
- $7,486 · $624/mo
- Expected delta
- +$1,554/yr (+$130/mo · 26.2%)
ⓘ Screening estimate from a state-policy table — verify with the county assessor before closing.
Climate risk First Street
- Flood 1/10 Low FEMA zone X · 0% chance over 30 yrs
- Wildfire 1/10 Low
- Heat 4/10 Moderate 7 d/yr ≥97°F today · 16 d/yr by 30 yrs out
- Wind 4/10 Moderate 18% chance of damaging wind over 30 yrs
- Air quality 2/10 Low 1 unhealthy d/yr today · 1 by 30 yrs out
Nearby sold comps map
Loading sold comps map…
Walkable amenities ~0.75 mi
Loading nearby amenities…
Taxation est. · year 1
- Rental income
- $92,400
- − Mortgage interest
- −$41,171
- − Property taxes
- −$5,932
- − Insurance
- −$3,675
- − Repairs & maintenance
- −$7,392
- − Management
- −$7,392
- − Depreciation
- −$21,382
- Taxable income
- $5,456
- Est. tax owed @ 24.0%
- −$1,309
- After-tax cash flow
- $15,827/yr
For passive investors: Depreciation is non-cash, so a rental often shows a tax loss while cash-flowing — sheltering income. Rental losses are passive: they offset passive income freely, and up to $25,000/yr can offset ordinary (W-2) income if you actively participate and your MAGI is under $100k (phasing out to $0 by $150k); unused losses carry forward. On sale, claimed depreciation is recaptured at up to 25%, and gains may owe capital-gains tax (a 1031 exchange can defer both). Figures are a year-1 estimate at your 24.0% rate — not tax advice; consult a CPA.
Schools (NCES district)
- District
- Northampton
- NCES district ID
- 2508850
- Math proficiency
- 36% ▼ -13.00%
- Reading proficiency
- 53% ▼ -4.00%
- Median HH income
- $57,335
- Composite
- 38.86/100
- National rank
- #4102
- State rank
- #175 of 302 in MA
Livability — Northampton
- Score
- 78/100
- State rank
- #49
- US rank
- #2534
Category grades
Schools grade is shown separately in the Schools card above.
Census & demographics
- Census place
- Northampton, MA
- County
- Hampshire County · 76,035 people
- City population
- 16,492
- Metro
- Springfield, MA
- Population (ZIP)
- 16,492
- Household income
- $76,848
- Rent vs Own
- Severe rent burden
- 1269.0
Population outlook (Hampshire County) Hauer SSP2
- Today (2025)
- 166,577 people
- By 2030
- 168,928 · +1.4%
- By 2040
- 171,197 · +2.8%
- By 2050
- 175,542 · +5.4%
- By 2075
- 199,884 · +20.0%
- By 2100
- 211,819 · +27.2%
Race, ethnicity, and origin ACS 2023
- Neighborhood character
- Predominantly White (78%)
- Race & ethnicity
- White 78% Hispanic / Latino 12% Two or more races 8% Asian 3% Black 1%
- Hispanic origin (detail)
- Mexican 1% Puerto Rican 7%
- Common ancestry
- Romanian 7% Italian 4% Lithuanian 4%
- Foreign-born
- 8% · Canada, China, Jamaica
- Languages at home
- 86% English-only · Spanish 9% Other Indo-European 2% Chinese 1%
Political lean MEDSL · Hampshire
- 2024 margin
- Solid D (+41.9) · D 69.5% · R 27.6% · Other 2.9%
- 2008→2024 swing
- -3.6pp toward R · 2008: 45.6pp · 2024: 41.9pp
- All cycles
- 2024: D+41.9 2020: D+46.8 2016: D+39.5 2012: D+43.8 2008: D+45.6
Not yet ingested
- Civics
- —
Market trends
- HPI YoY
- ▼ -200.05%
- Current HPI
- 315.842
- Rent YoY
- ▲ 5.87%
- Metro
- Springfield, MA
- State GDP YoY
- ▲ 2.28%
- F500 in state
- 38
Industry mix (Fortune 500 HQ in MA)
| Industry | F500 HQs | Revenue |
|---|---|---|
| Technology | 3 | $17B |
|
||
| Insurance | 2 | $84B |
|
||
| Retail | 2 | $76B |
|
||
| Life Sciences | 1 | $43B |
|
||
| Energy Technology | 1 | $31B |
|
||
| Aerospace / Defense | 1 | $18B |
|
||
Price history
+195.5% since first listed4 events — show timeline
- 2026-04-02 Relisted — MLS PIN
- 2026-03-31 Listing Removed — MLS PIN
- 2025-08-30 Listed $735,000 MLS PIN
- 2005-08-11 Sold (Public Records) $248,725 Public Records
Property tax history
+3.6%/yrLatest (2023): $5,932 · +3.4% YoY. Source: county tax records.
Cash-flow waterfall
monthlySold comps — $/sqft
last 12 mo · ≤1 miLoading sold comps…