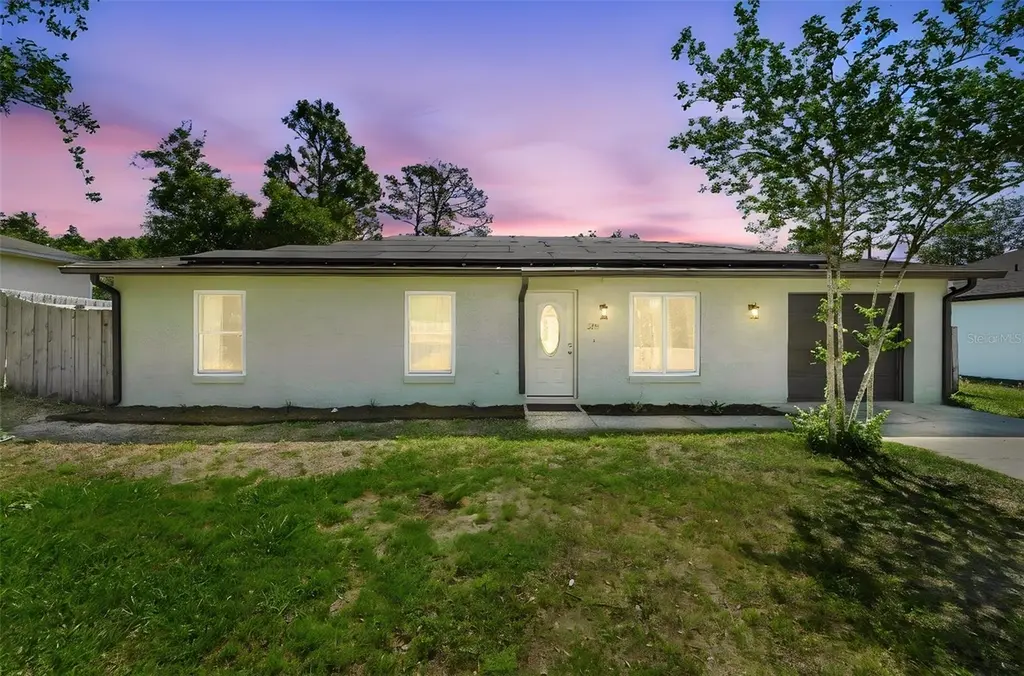
215 Walnut Ave · Orange City, FL
Flood risk 6/10 · Moderate
- FEMA flood zone
- X (unshaded)
- Chance of flooding over 30 yrs
- 0.68%
- Est. flood insurance / yr
- $507 – $1,088
Fire risk 4/10 · Minor
- Est. fire insurance / yr
- $947 – $1,759
Heat risk 9/10 · Severe
- Hot days now (above 108°F)
- 7 days/yr
- Hot days in 30 yrs
- 21 days/yr
Wind risk 9/10 · Severe
- Chance of severe wind over 30 yrs
- 99.0%
Air-quality risk 2/10 · Minimal
- Unhealthy air days now
- 1 days/yr
- Unhealthy air days in 30 yrs
- 1 days/yr
Risk factors via First Street. Map © Google.
Why this score? — see what drove the D grade
The composite is a weighted blend of 9 inputs, each scored 0–100. Each bar is that input's sub-score; the figure is the points it added to the 100-point composite (weight × sub-score).
- Cash flow +12.4/30.0
- ARV discount +7.5/15.0
- Schools +3.9/10.0
- Rent growth +3.8/5.0
- DSCR +3.7/10.0
- Livability +3.6/5.0
- 1% rule +2.7/10.0
- Condition / age +2.5/5.0
- Appreciation +0.0/10.0
$270,000
🖨 Deal sheet 📄 Offer letter ✓ Due diligence
Listing remarks MLS
NICE 3 BEDROOM, 2 BATHROOM BLOCK HOME IN ORANGE CITY!! Conveniently located close to shopping and highway access!! NO HOA!! This MOVE IN READY HOME has just been COMPLETELY UPDATED with NEW PAINT, NEW FLOORING, NEW DISHWASHER, and NEW FIXTURES!! Great layout, vaulted ceilings, and attached garage! HOME WARRANTY INCLUDED!! This is NOT a short sale or a bank owned property. This is a GREAT HOME that is PRICED TO SELL!! Come see it TODAY!!
Key facts
- Wooden privacy fence
- Extra-large backyard
- Back porch
Tags
Property features AI
Finance
- Other: Property type: Residential single-family; Homestead exemption indicated; Living area 975 square feet (public record); total building area 1,323 square feet; Lot approximately 0.24 acre (about 969 sq meters); No waterfront features; Unfurnished; Directions: From 17-92 go west on Blue Springs Ave. Turn right on Walnut Ave. House is on the right
- HOA & community: No development / no HOA
Exterior
- Parking: Attached garage (1 car)
- Utilities: Well water; Septic tank; Electricity connected; Water connected; Cable connected; Phone available
- Home design: Single-family residence; One story; Home faces west; Property completed
- Construction: Block, concrete and stucco construction; Shingle roof; Built on slab
- Exterior features: Patio; Wood fencing; Cleared lot; Mature landscaping; Dirt road access; Located in unincorporated area / in county
Interior
- Kitchen: Dishwasher; Microwave; Range; Refrigerator
- Bedrooms: 3 bedrooms
- Flooring: Tile
- Bathrooms: 2 full bathrooms
- Heating & cooling: Central heating (electric); Central air conditioning
- Interior features: Ceiling fans; Solid surface and stone counters; Thermostat; Sliding doors
- Laundry & utility: Washer hookup; Electric dryer hookup; Laundry area in garage; Slab foundation
Neighborhood map
What this means for you Summary
Snapshot
- This is a 3-bed/2.0-bath single-family listed at $270k.
Deal economics
- At list price, monthly cash flow is $-43 ($-517/yr) — negative.
- To cash-flow at today's rent, offer at most $262k (2.8% below list).
- To meet the 1% rule (rent ≥ 1% of price), the offer needs to be $208k (22.8% below list).
- Recommended offer: $208k (22.8% below list) — sets the bar for 1% rule.
Location & tenants
- Location reads 71/100 on livability (#406 in FL) — a middle-class / working-renter tenant base. Strengths: cost of living A+, housing A+; Watch: schools C-, employment D+, amenities F.
- Volusia (suburban): math 44% / reading 49% proficiency, ranked #47 of 73 in FL (top 64%) — families likely to look elsewhere, expect single-tenant / working-renter base with shorter leases.
- Market conditions: Rents rising fast (+5.2%/yr); 243 active listings in the ZIP; 2 comparable units currently listed for rent nearby; 3,402 units permitted in Volusia County in 2024 (681 in 5+ unit buildings).
- This rent runs 37% of the median local income ($67k/yr) — at the standard rent-burdened threshold; future hikes will face affordability resistance.
Forward outlook
- Local home prices are declining (-3.0%/yr); year-one equity from $2k of loan paydown is wiped out by about $8k of value loss. Plan a longer hold.
- Volusia County population projected at +19% by 2050 — long-run rental-demand tailwind backs the buy-and-hold thesis.
Negotiation context
- Only 12 days on market — expect competitive offers; lowballing is unlikely to land.
- 3 sale attempts since 9y ago with the ask held roughly flat each time — persistent listings suggest the price (not the market) is what's stuck; bring a comps-based counter.
- Current owner paid $130k; list at $270k implies a 108% gain — meaningful room to come down on a strong offer.
Risks & watch-outs
- Climate carrying-cost: major flood risk; severe wind risk, 99% chance of damaging wind over 30y; extreme-heat days projected 7→21/yr by 2055 (HVAC capex compounding) — expect insurance premiums to compound above CPI over the hold.
Questions for the listing agent
- What do current leases actually rent for vs. the listed asking? Can we see a recent rent roll and the last 12 months of T-12 income?
- Is there a deadline driving the sale (1031 exchange, divorce, estate, relocation)? That informs how much negotiation room exists.
- The area grade is low — what's the realistic commute time and amenity access for the typical tenant pool here? Any planned neighborhood developments (good or bad) we should know about?
- What's the average days-on-market for RENTAL listings here right now (not sales)? A rising rental-DOM trend means longer vacancies and softer asking-rent achievability than the comps imply.
- What's the recent tenant-quality profile in this submarket — average credit score on applications, eviction rate, late-payment / NSF rate, and stable-employment percentage? A property-management company in the area should have these aggregated.
- How much new for-sale + rental construction is in the pipeline within 1–3 miles? Heavy new supply typically softens prices + rents 12–24 months out; constrained supply supports both.
Investment metrics
- 1% rule
- 0.77% ✗
- Cap rate
- 6.10%
- Cash-on-cash
- -0.68%
- DSCR
- 0.97
- GRM
- 10.8
CMA / ARV
No comps found within radius.
Projected returns pro-forma
-3.0% appreciation · 5.22% rent growth · sell at horizon
- IRR
- -15.2%
- Equity multiple
- 0.45×
- Total profit
- $-41,816
- Equity at exit
- $40,258
- IRR
- -3.6%
- Equity multiple
- 0.74×
- Total profit
- $-19,832
- Equity at exit
- $23,345
Cash invested: $75,600 (down + closing). Projections, not guarantees.
Landlord ↔ Tenant lean methodology
- Overall (STATE)
- 87 Strongly Landlord-Friendly
- State Florida
- 87 Strongly Landlord-Friendly · R+3
- County
- — inherits STATE
- City
- — inherits STATE
ZIP-level market 32763
- Rents YoY
- 5.2%
- Active inventory
- 243
- Price-to-rent
- 10.8×
Monthly cashflow live
- Estimated rent
- $2,084 medium interval (Pro) →
- Mortgage (P&I)
- −$1,416
- Tax from tax record
- −$161 /mo · $1,928/yr
- Insurance
- −$112
- HOA
- −$0
- Vacancy / Maint / Mgmt
- −$438
- Net cashflow
- $-43
Break-even live
UW: 25.0% down · 7.5% · 30yr · 1.5% tax · 5.0% vac · 8.0% maint · 8.0% mgmt
Financing live
Cash to close
- Down payment
- $67,500
- Closing costs
- $8,100
- Reserves months
- —
- Total cash needed
- —
Loan-product check · same deal, 3 products live
Conventional
25% down · 7.5% · 30yr
- Down + closing
- —
- Monthly P&I
- —
- Monthly cashflow
- —
- DSCR
- —
- Eligible?
- —
Personal DTI + credit; lowest rate.
DSCR
20% down · 8.5% · 30yr
- Down + closing
- —
- Monthly P&I
- —
- Monthly cashflow
- —
- DSCR
- —
- Eligible?
- —
No personal income docs; deal must DSCR.
Hard money
10% down · 12.0% · 12mo
- Down + closing
- —
- Monthly P&I
- —
- Monthly cashflow
- —
- DSCR
- —
- Eligible?
- —
Short-term bridge; refi at stabilization.
Rent comps 2 comps
| Address | Beds | Baths | Sqft | Rent | $/sqft | DOM | Units | Dist |
|---|---|---|---|---|---|---|---|---|
| 258 Charles Ave Orange City, FL | 3.0 | 2.0 | 1103 | $1,950 | $1.77 | 23d | 1 | 0.25mi |
| 505 Patlin Ave Orange City, FL | 2.0 | 1.5 | 1022 | $1,600 | $1.57 | 23d | 1 | 1.35mi |
Listing history 10 events
-
2026-05-11$270,000 Active 1636-char remark
-
2019-10-05historical
-
2019-08-02$173,900 Active
-
2017-03-30soldstatus $129,900 Sold
Show marketing remark (440 chars)
NICE 3 BEDROOM, 2 BATHROOM BLOCK HOME IN ORANGE CITY!! Conveniently located close to shopping and highway access!! NO HOA!! This MOVE IN READY HOME has just been COMPLETELY UPDATED with NEW PAINT, NEW FLOORING, NEW DISHWASHER, and NEW FIXTURES!! Great layout, vaulted ceilings, and attached garage! HOME WARRANTY INCLUDED!! This is NOT a short sale or a bank owned property. This is a GREAT HOME that is PRICED TO SELL!! Come see it TODAY!!
-
2017-03-24soldstatus $129,900
-
2017-02-27status Pending
Show marketing remark (440 chars)
NICE 3 BEDROOM, 2 BATHROOM BLOCK HOME IN ORANGE CITY!! Conveniently located close to shopping and highway access!! NO HOA!! This MOVE IN READY HOME has just been COMPLETELY UPDATED with NEW PAINT, NEW FLOORING, NEW DISHWASHER, and NEW FIXTURES!! Great layout, vaulted ceilings, and attached garage! HOME WARRANTY INCLUDED!! This is NOT a short sale or a bank owned property. This is a GREAT HOME that is PRICED TO SELL!! Come see it TODAY!!
-
2017-02-11$129,900 Active
Show marketing remark (440 chars)
NICE 3 BEDROOM, 2 BATHROOM BLOCK HOME IN ORANGE CITY!! Conveniently located close to shopping and highway access!! NO HOA!! This MOVE IN READY HOME has just been COMPLETELY UPDATED with NEW PAINT, NEW FLOORING, NEW DISHWASHER, and NEW FIXTURES!! Great layout, vaulted ceilings, and attached garage! HOME WARRANTY INCLUDED!! This is NOT a short sale or a bank owned property. This is a GREAT HOME that is PRICED TO SELL!! Come see it TODAY!!
-
2004-01-13soldstatus $93,000
-
2002-08-05soldstatus $76,500
-
2002-04-29soldstatus $63,000
ⓘ Source: listings_history table (triggers on properties + properties_extension) + one-shot
backfill from property_details.listing_events for pre-trigger history.
Tax reassessment forecast FL · Resets to sale price
- Current annual tax
- $1,928 · $161/mo
- Projected year-2 tax
- $2,241 · $187/mo
- Expected delta
- +$313/yr (+$26/mo · 16.2%)
ⓘ Screening estimate from a state-policy table — verify with the county assessor before closing.
Climate risk First Street
- Flood 6/10 Major FEMA zone X (unshaded) · 68% chance over 30 yrs
- Wildfire 4/10 Moderate
- Heat 9/10 Extreme 7 d/yr ≥108°F today · 21 d/yr by 30 yrs out
- Wind 9/10 Extreme 99% chance of damaging wind over 30 yrs
- Air quality 2/10 Low 1 unhealthy d/yr today · 1 by 30 yrs out
Nearby sold comps map
Loading sold comps map…
Walkable amenities ~0.75 mi
Loading nearby amenities…
Taxation est. · year 1
- Rental income
- $25,002
- − Mortgage interest
- −$15,124
- − Property taxes
- −$1,928
- − Insurance
- −$1,350
- − Repairs & maintenance
- −$2,000
- − Management
- −$2,000
- − Depreciation
- −$7,855
- Taxable loss
- −$5,255
- Est. tax savings @ 24.0%
- +$1,261
- After-tax cash flow
- $744/yr
For passive investors: Depreciation is non-cash, so a rental often shows a tax loss while cash-flowing — sheltering income. Rental losses are passive: they offset passive income freely, and up to $25,000/yr can offset ordinary (W-2) income if you actively participate and your MAGI is under $100k (phasing out to $0 by $150k); unused losses carry forward. On sale, claimed depreciation is recaptured at up to 25%, and gains may owe capital-gains tax (a 1031 exchange can defer both). Figures are a year-1 estimate at your 24.0% rate — not tax advice; consult a CPA.
Schools (NCES district)
- District
- Volusia
- NCES district ID
- 1201920
- Math proficiency
- 44% ▼ -9.00%
- Reading proficiency
- 49% ▼ -3.00%
- Median HH income
- $42,946
- Composite
- 39.2/100
- National rank
- #4019
- State rank
- #47 of 73 in FL
Livability — Orange City
- Score
- 71/100
- State rank
- #406
- US rank
- #7175
Category grades
Schools grade is shown separately in the Schools card above.
Census & demographics
- County
- Volusia County · 556,871 people
- City population
- 24,951
- Metro
- Deltona-Daytona Beach-Ormond Beach, FL
- Population (ZIP)
- 24,951
- Household income
- $66,716
- Rent vs Own
- Severe rent burden
- 1544.0
Population outlook (Volusia County) Hauer SSP2
- Today (2025)
- 572,749 people
- By 2030
- 598,695 · +4.5%
- By 2040
- 644,880 · +12.6%
- By 2050
- 681,451 · +19.0%
- By 2075
- 759,957 · +32.7%
- By 2100
- 778,902 · +36.0%
Race, ethnicity, and origin ACS 2023
- Neighborhood character
- Predominantly White (71%)
- Race & ethnicity
- White 71% Hispanic / Latino 18% Two or more races 7% Black 7% Asian 1%
- Hispanic origin (detail)
- Puerto Rican 12%
- Common ancestry
- Slovak 2% Romanian 2% Lithuanian 2%
- Foreign-born
- 6% · Canada, Vietnam
- Languages at home
- 85% English-only · Spanish 12% Russian/Polish/Slavic 1%
Political lean MEDSL · Volusia
- 2024 margin
- Strong R (+21.8) · D 38.7% · R 60.5%
- 2008→2024 swing
- -27.4pp toward R · 2008: 5.7pp · 2024: -21.8pp
- All cycles
- 2024: R+21.8 2020: R+14.1 2016: R+13.1 2012: R+1.2 2008: D+5.7
Not yet ingested
- Civics
- —
Market trends
- HPI YoY
- ▼ -225.13%
- Current HPI
- 335.8393
- Rent YoY
- ▲ 5.22%
- Metro
- Deltona-Daytona Beach-Ormond Beach, FL
- State GDP YoY
- ▲ 3.28%
- F500 in state
- 36
Industry mix (Fortune 500 HQ in FL)
| Industry | F500 HQs | Revenue |
|---|---|---|
| Industrial Technology | 2 | $29B |
|
||
| Insurance | 2 | $17B |
|
||
| Retail | 1 | $60B |
|
||
| Technology Distribution | 1 | $58B |
|
||
| Homebuilding | 1 | $35B |
|
||
| Technology Manufacturing | 1 | $35B |
|
||
Price history
+328.6% since first listed11 events — show timeline
- 2026-05-23 Pending — Stellar MLS as Distributed by MLS Grid
- 2026-05-11 Listed $270,000 Stellar MLS as Distributed by MLS Grid
- 2019-10-05 Listing Removed — Stellar MLS as Distributed by MLS Grid
- 2019-08-02 Listed $173,900 Stellar MLS as Distributed by MLS Grid
- 2017-03-30 Sold (MLS) $129,900 Stellar MLS as Distributed by MLS Grid
- 2017-03-24 Sold (Public Records) $129,900 Public Records
- 2017-02-27 Pending — Stellar MLS as Distributed by MLS Grid
- 2017-02-11 Listed $129,900 Stellar MLS as Distributed by MLS Grid
- 2004-01-13 Sold (Public Records) $93,000 Public Records
- 2002-08-05 Sold (Public Records) $76,500 Public Records
- 2002-04-29 Sold (Public Records) $63,000 Public Records
Property tax history
+8.4%/yrLatest (2025): $1,928 · +2.2% YoY. Source: county tax records.
Cash-flow waterfall
monthlySold comps — $/sqft
last 12 mo · ≤1 miLoading sold comps…