1925 Otay Lakes Rd #167 · Chula Vista, CA
Flood risk 1/10 · Minimal
- FEMA flood zone
- X (unshaded)
- Chance of flooding over 30 yrs
- 0.0%
- Est. flood insurance / yr
- $507 – $1,088
Fire risk 4/10 · Minor
- Est. fire insurance / yr
- $659 – $1,223
Heat risk 4/10 · Minor
- Hot days now (above 90°F)
- 4 days/yr
- Hot days in 30 yrs
- 11 days/yr
Wind risk 1/10 · Minimal
- Chance of severe wind over 30 yrs
- —
Air-quality risk 3/10 · Minor
- Unhealthy air days now
- 3 days/yr
- Unhealthy air days in 30 yrs
- 3 days/yr
Risk factors via First Street. Map © Google.
Why this score? — see what drove the B grade
The composite is a weighted blend of 9 inputs, each scored 0–100. Each bar is that input's sub-score; the figure is the points it added to the 100-point composite (weight × sub-score).
- Cash flow +30.0/30.0
- DSCR +10.0/10.0
- 1% rule +9.7/10.0
- ARV discount +7.5/15.0
- Schools +3.9/10.0
- Livability +3.8/5.0
- Rent growth +2.7/5.0
- Condition / age +2.5/5.0
- Appreciation +0.0/10.0
$240,000
🖨 Deal sheet 📄 Offer letter ✓ Due diligence
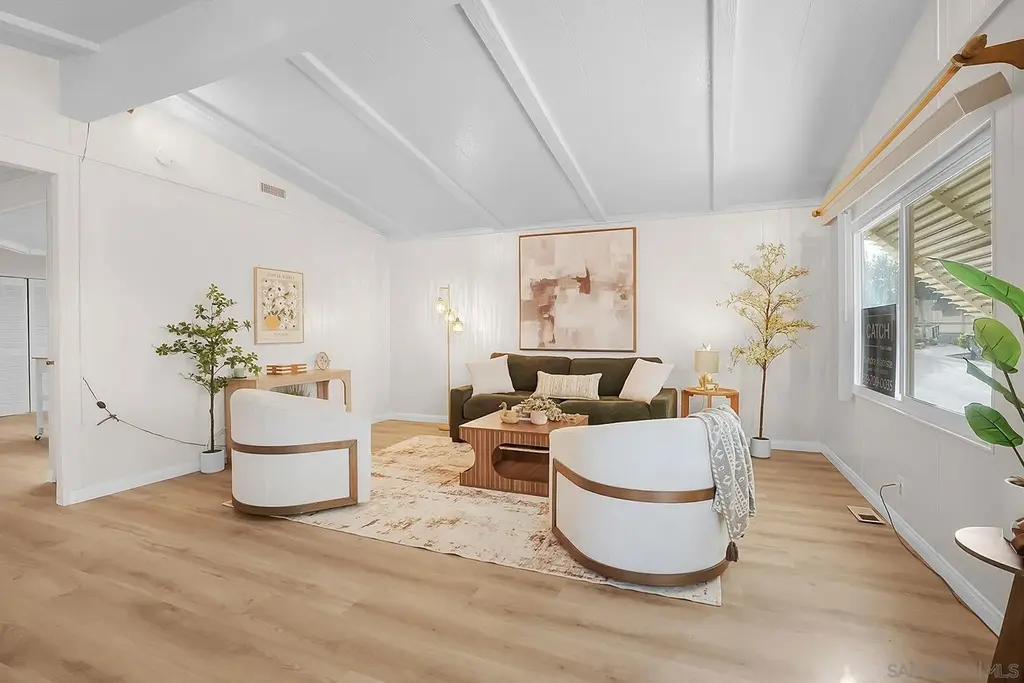
Listing remarks
Welcome to Easy Living at Otay Lakes Lodge – 55+ Community in Beautiful Chula Vista! Discover comfort, convenience, and community in this spacious and well-maintained home located in the highly desirable 55/45+ retirement community of Otay Lakes Lodge. Perfect for those looking to downsize without sacrificing space or style, this charming residence offers everything you need to enjoy your next chapter. Step into a bright and airy sunroom – an ideal space to relax, read, or soak in the beautiful San Diego sunshine year-round. The open layout provides excellent living space and flexibility, with room to personalize for your hobbies, guests, or home office needs. Key features inclu
Key facts
- Sunroom
- Private yard
- Storage shed
Tags
Property features AI
Finance
- HOA & community: Community pool; Senior community (55/45)
Exterior
- Parking: 2 parking spaces
- Utilities: Connected to sewer
- Home design: Single-story mobile home; Residential property in a 55/45 senior community; Located in the Chula Vista subdivision
- Construction: Metal roof
- Exterior features: Cross fenced; Community pool
Interior
- Kitchen: Dishwasher; Gas cooktop; Disposal
- Bedrooms: Up to 3 bedrooms possible
- Bathrooms: 2 full bathrooms
- Heating & cooling: Central air conditioning; Forced air heating
- Interior features: Dishwasher; Disposal; Gas cooktop
Neighborhood map
What this means for you Summary
Snapshot
- This is a 2-bed/2.0-bath manufactured listed at $240k.
Deal economics
- At list price, monthly cash flow is $1k ($14k/yr) — positive.
- The deal already cash-flows at list — no discount required.
- Meets the 1% rule at list price ($4k rent vs $240k).
- Recommended offer: $236k (1.5% below list) — sets the bar for market timing.
- Cap rate 11.9% vs local median 2.7% in Chula Vista — top-decile yield for the area; either an underpriced asset or a hidden risk that comps aren't pricing in. Stress-test before assuming the spread holds.
Location & tenants
- Location reads 75/100 on livability (#127 in CA, #4,345 nationally) — a middle-class / working-renter tenant base. Strengths: amenities A+, commute A+, employment A+; Watch: health & safety C-, cost of living F.
- Sweetwater Union High (suburban): math 36% / reading 52% proficiency, ranked #187 of 517 in CA (top 36%) — families likely to look elsewhere, expect single-tenant / working-renter base with shorter leases.
- Market conditions: Rents flat; 171 active listings in the ZIP; 40 comparable units currently listed for rent nearby; rentals leasing fast (median 2d on market — plan ~1-2 weeks tenant-placement turnaround); high-income renter base; 11,759 units permitted in San Diego County in 2024 (7,244 in 5+ unit buildings).
- This rent runs 33% of the median local income ($129k/yr) — at the standard rent-burdened threshold; future hikes will face affordability resistance.
Forward outlook
- Local home prices are declining (-3.0%/yr); year-one equity from $2k of loan paydown is wiped out by about $7k of value loss. Plan a longer hold.
- San Diego County population projected at +20% by 2050 — long-run rental-demand tailwind backs the buy-and-hold thesis.
- At projected returns (-3.0% appreciation + 0.9% rent growth), your $67k cash investment doubles in ~8 years — after that, you're playing with house money.
Negotiation context
- It's been on market 28 days — a 2% lower offer ($236k) is reasonable based on typical stale-listing flexibility.
- 9 sale attempts since 18y ago with the ask held roughly flat each time — persistent listings suggest the price (not the market) is what's stuck; bring a comps-based counter.
- Current owner paid $130k; list at $240k implies a 85% gain — meaningful room to come down on a strong offer.
Questions for the listing agent
- Built in 1973 — when were the roof, HVAC, electrical panel, plumbing, and water heater last replaced?
- Is there a deadline driving the sale (1031 exchange, divorce, estate, relocation)? That informs how much negotiation room exists.
- Schools are B-rated — typically a magnet for longer-tenancy family renters. What's the average tenant stay here, and is there a school-zone premium baked into asking?
- What's the average days-on-market for RENTAL listings here right now (not sales)? A rising rental-DOM trend means longer vacancies and softer asking-rent achievability than the comps imply.
- What's the recent tenant-quality profile in this submarket — average credit score on applications, eviction rate, late-payment / NSF rate, and stable-employment percentage? A property-management company in the area should have these aggregated.
- How much new for-sale + rental construction is in the pipeline within 1–3 miles? Heavy new supply typically softens prices + rents 12–24 months out; constrained supply supports both.
Investment metrics
- 1% rule
- 1.47% ✓
- Cap rate
- 11.94%
- Cash-on-cash
- 20.15%
- DSCR
- 1.90
- GRM
- 5.7
CMA / ARV
- ARV (on-the-fly)
- $240,240
- Comps found
- 7
Show comp detail 7 sales within ~0.75 mi
| Address | Dist | Beds/Ba | Sqft | Sold | Price | $/sf | Match |
|---|---|---|---|---|---|---|---|
| 1925 Otay Lakes Rd #167 | 0.00mi | 2/2.0 | 1,560 (0%) | 1mo | $240,000 | $154 | 99 |
| 1925 Otay Lakes Rd #52 | 0.12mi | 2/2.0 | 1,608 (+3%) | 4mo | $240,000 | $149 | 87 |
| 1925 Otay Lakes Rd #39 | 0.00mi | 3/2.0 (+1) | 1,488 (-5%) | 6mo | $215,000 | $144 | 82 |
| 1925 Otay Lakes Rd #69 | 0.09mi | 2/2.0 | 1,392 (-11%) | 5mo | $215,000 | $154 | 74 |
| 1925 Otay Lks #82 | 0.10mi | 2/2.0 | 1,440 (-8%) | 13mo | $140,000 | $97 | 72 |
| 1925 Otay Lakes Rd #172 | 0.10mi | 3/2.0 (+1) | 1,440 (-8%) | 11mo | $249,000 | $173 | 68 |
| 1925 Otay Lakes Rd #81 | 0.00mi | 2/2.0 | 1,344 (-14%) | 16mo | $210,000 | $156 | 63 |
Match score weights: distance 35% · size 25% · config 20% · recency 20%. Top-matched comps best support the ARV.
Projected returns pro-forma
-3.0% appreciation · 0.88% rent growth · sell at horizon
- IRR
- 9.9%
- Equity multiple
- 1.38×
- Total profit
- $25,674
- Equity at exit
- $35,785
- IRR
- 17.2%
- Equity multiple
- 2.28×
- Total profit
- $86,149
- Equity at exit
- $20,751
Cash invested: $67,200 (down + closing). Projections, not guarantees.
Landlord ↔ Tenant lean methodology
- Overall (STATE)
- 18 Strongly Tenant-Friendly
- State California
- 18 Strongly Tenant-Friendly · D+13
- County
- — inherits STATE
- City
- — inherits STATE
ZIP-level market 91913
- Home prices YoY
- -30.1%
- Rents YoY
- 0.9%
- Active inventory
- 171
- Price-to-rent
- 5.7×
Monthly cashflow live
- Estimated rent
- $3,528 high interval (Pro) →
- Mortgage (P&I)
- −$1,259
- Tax est. 1.5%
- −$300 /mo · $3,600/yr
- Insurance
- −$100
- HOA
- −$0
- Vacancy / Maint / Mgmt
- −$741
- Net cashflow
- $1,129
Break-even live
UW: 25.0% down · 7.5% · 30yr · 1.5% tax · 5.0% vac · 8.0% maint · 8.0% mgmt
Financing live
Cash to close
- Down payment
- $60,000
- Closing costs
- $7,200
- Reserves months
- —
- Total cash needed
- —
Loan-product check · same deal, 3 products live
Conventional
25% down · 7.5% · 30yr
- Down + closing
- —
- Monthly P&I
- —
- Monthly cashflow
- —
- DSCR
- —
- Eligible?
- —
Personal DTI + credit; lowest rate.
DSCR
20% down · 8.5% · 30yr
- Down + closing
- —
- Monthly P&I
- —
- Monthly cashflow
- —
- DSCR
- —
- Eligible?
- —
No personal income docs; deal must DSCR.
Hard money
10% down · 12.0% · 12mo
- Down + closing
- —
- Monthly P&I
- —
- Monthly cashflow
- —
- DSCR
- —
- Eligible?
- —
Short-term bridge; refi at stabilization.
Rent comps 40 comps
| Address | Beds | Baths | Sqft | Rent | $/sqft | DOM | Units | Dist |
|---|---|---|---|---|---|---|---|---|
| 2079 Lakeridge Cir #104 Chula Vista, CA | 3.0 | 2.0 | 1166 | $3,400 | $2.92 | 1d | 1 | 0.61mi |
| 787 Brookstone Rd #103 Chula Vista, CA | 3.0 | 2.0 | 1166 | $3,500 | $3.00 | 24d | 1 | 0.66mi |
| 1554 Apache Dr Chula Vista, CA | 3.0 | 3.0 | 1500 | $4,500 | $3.00 | 1d | 1 | 0.67mi |
| 1282 Fools Gold Way #2 Chula Vista, CA | 3.0 | 2.5 | 1586 | $3,595 | $2.27 | 10d | 1 | 0.72mi |
| 1280 Haglar Way #1 Chula Vista, CA | 3.0 | 3.0 | 1519 | $3,850 | $2.53 | 1d | 1 | 0.76mi |
| 1293 Fools Gold Way #2 Chula Vista, CA | 3.0 | 2.5 | 1586 | $3,400 | $2.14 | 1d | 1 | 0.78mi |
| 1298 Fools Gold Way #4 Chula Vista, CA | 2.0 | 2.0 | 1071 | $3,100 | $2.89 | 1d | 1 | 0.79mi |
| 1535 Apache Dr Unit D Chula Vista, CA | 3.0 | 3.0 | 1500 | $3,775 | $2.52 | 1d | 1 | 0.81mi |
| 1206 Aruba Cv #3 Chula Vista, CA | 2.0 | 2.5 | 1180 | $3,000 | $2.54 | 1d | 1 | 0.81mi |
| 1305 Mother Lode Way #1 Chula Vista, CA | 2.0 | 2.0 | 1071 | $2,900 | $2.71 | 1d | 1 | 0.82mi |
| 1311 Caminito Capistrano #1 Chula Vista, CA | 2.0 | 2.0 | 1141 | $2,845 | $2.49 | 17d | 1 | 0.82mi |
| 1313 Mother Lode Way #3 Chula Vista, CA | 3.0 | 2.5 | 1586 | $3,650 | $2.30 | 19d | 1 | 0.84mi |
| 2096 Northshore Dr Unit C Chula Vista, CA | 3.0 | 2.5 | 1570 | $3,950 | $2.52 | 16d | 1 | 0.86mi |
| 1381 Caminito Capistrano #5 Chula Vista, CA | 3.0 | 2.5 | 1695 | $3,995 | $2.36 | 20d | 1 | 0.87mi |
| 1250 Santa Cora Ave Chula Vista, CA | 1.0–3.0 | 1.0–2.0 | 952 | $3,234 | $3.40 | 1d | 35 | 0.88mi |
| 2096 Northshore Dr Chula Vista, CA | 3.0 | 3.0 | 1570 | $3,950 | $2.52 | 13d | 1 | 0.88mi |
| 1526 Apache Dr Unit C Chula Vista, CA | 2.0 | 2.0 | 1270 | $3,375 | $2.66 | 1d | 1 | 0.89mi |
| 1338 Nicolette Ave #1032 Chula Vista, CA | 2.0 | 2.0 | 1066 | $2,800 | $2.63 | 21d | 1 | 0.94mi |
| 1344 Paizay Pl #732 Chula Vista, CA | 2.0 | 2.0 | 1066 | $2,695 | $2.53 | 1d | 1 | 0.96mi |
| 1355 Nicolette Ave #1323 Chula Vista, CA | 2.0 | 2.0 | 1066 | $2,700 | $2.53 | 1d | 1 | 0.99mi |
| 1863 Opaline Pl #513 Chula Vista, CA | 3.0 | 2.0 | 1478 | $3,800 | $2.57 | 1d | 1 | 1.00mi |
| 1357 Burgundy Dr Chula Vista, CA | 3.0 | 2.5 | 1500 | $3,500 | $2.33 | 7d | 1 | 1.01mi |
| 1441 Vallejo Mills St Chula Vista, CA | 3.0 | 2.5 | 1664 | $4,250 | $2.55 | 10d | 1 | 1.05mi |
| 2155 Caminito Leonzio #22 Chula Vista, CA | 3.0 | 2.5 | 1515 | $3,695 | $2.44 | 10d | 1 | 1.10mi |
| 1251 Boca Raton Dr Chula Vista, CA | 3.0 | 2.5 | 1400 | $3,795 | $2.71 | 7d | 1 | 1.11mi |
| 1444 Canvas Dr #3 Chula Vista, CA | 3.0 | 2.5 | 1360 | $4,025 | $2.96 | 1d | 1 | 1.19mi |
| 1924 E Palomar St Chula Vista, CA | 2.0–3.0 | 3.0 | 1209 | $3,150 | $2.60 | 1d | 6 | 1.19mi |
| 1460 Canvas Dr #3 Chula Vista, CA | 3.0 | 2.5 | 1360 | $3,600 | $2.65 | 17d | 1 | 1.22mi |
| 1381 Caminito Veranza Chula Vista, CA | 3.0 | 2.5 | 1259 | $3,950 | $3.14 | 1d | 1 | 1.31mi |
| 1445 Town Center Dr Chula Vista, CA | 2.0 | 1.0–2.0 | 926 | $3,960 | $4.28 | 1d | 20 | 1.33mi |
| 1455 Banahaw Way #11 Chula Vista, CA | 2.0 | 2.5 | 1357 | $3,500 | $2.58 | 1d | 1 | 1.34mi |
| 2241 Lago Ventana Chula Vista, CA | 3.0 | 2.5 | 1447 | $3,800 | $2.63 | 1d | 1 | 1.35mi |
| 1629 Santa Venetia St Chula Vista, CA | 1.0–3.0 | 1.0–2.0 | 1115 | $3,430 | $3.08 | 1d | 27 | 1.39mi |
| 1152 La Vida Ct Chula Vista, CA | 3.0 | 3.0 | 1607 | $3,795 | $2.36 | 16d | 1 | 1.42mi |
| 1345 Serena Cir #2 Chula Vista, CA | 3.0 | 3.0 | 1545 | $4,199 | $2.72 | 2d | 1 | 1.42mi |
| 581 Canyon Dr Bonita, CA | 3.0 | 2.0 | 1505 | $4,000 | $2.66 | 7d | 1 | 1.45mi |
| 1625 Santa Venetia St Chula Vista, CA | 1.0–3.0 | 1.0–2.0 | 1008 | $3,352 | $3.33 | 1d | 24 | 1.45mi |
| 2450 La Costa Ave Chula Vista, CA | 3.0 | 2.5 | 1621 | $4,200 | $2.59 | 1d | 1 | 1.45mi |
| 1337 Serena Cir #2 Chula Vista, CA | 2.0 | 2.5 | 1228 | $3,500 | $2.85 | 1d | 1 | 1.46mi |
| 1390 Santa Alicia Ave Chula Vista, CA | 1.0–3.0 | 1.0–2.5 | 1050 | $3,278 | $3.12 | 1d | 15 | 1.49mi |
Listing history 20 events
-
2026-04-30status Pending
-
2026-04-01$240,000 Active
-
2026-02-20status Active
-
2026-01-28status Pending
-
2025-12-12status Active
-
2025-10-30historical
-
2025-10-29historical
-
2025-10-22$240,000 Active
-
2025-09-08status Active
-
2025-08-26status Pending
-
2025-08-26historical
-
2025-05-12$225,000 Active
-
2019-08-02soldstatus $130,000 Closed Sale
-
2019-08-02soldstatus $130,000 Sold
-
2019-07-11status Pending Sale
-
2019-07-11status Pending
-
2019-04-30$130,000 Active
-
2019-04-30$130,000 Active
-
2008-09-29soldstatus $120,000
-
2008-03-10$135,500
ⓘ Source: listings_history table (triggers on properties + properties_extension) + one-shot
backfill from property_details.listing_events for pre-trigger history.
Climate risk First Street
- Flood 1/10 Low FEMA zone X (unshaded) · 0% chance over 30 yrs
- Wildfire 4/10 Moderate
- Heat 4/10 Moderate 4 d/yr ≥90°F today · 11 d/yr by 30 yrs out
- Wind 1/10 Low
- Air quality 3/10 Moderate 3 unhealthy d/yr today · 3 by 30 yrs out
Nearby sold comps map
Loading sold comps map…
Walkable amenities ~0.75 mi
Loading nearby amenities…
Taxation est. · year 1
- Rental income
- $42,337
- − Mortgage interest
- −$13,444
- − Property taxes
- −$3,600
- − Insurance
- −$1,200
- − Repairs & maintenance
- −$3,387
- − Management
- −$3,387
- − Depreciation
- −$6,982
- Taxable income
- $10,338
- Est. tax owed @ 24.0%
- −$2,481
- After-tax cash flow
- $11,062/yr
For passive investors: Depreciation is non-cash, so a rental often shows a tax loss while cash-flowing — sheltering income. Rental losses are passive: they offset passive income freely, and up to $25,000/yr can offset ordinary (W-2) income if you actively participate and your MAGI is under $100k (phasing out to $0 by $150k); unused losses carry forward. On sale, claimed depreciation is recaptured at up to 25%, and gains may owe capital-gains tax (a 1031 exchange can defer both). Figures are a year-1 estimate at your 24.0% rate — not tax advice; consult a CPA.
Schools (NCES district)
- District
- Sweetwater Union High
- NCES district ID
- 0638640
- Math proficiency
- 36% ▲ 3.00%
- Reading proficiency
- 52% ▼ -2.00%
- Median HH income
- $59,051
- Composite
- 38.61/100
- National rank
- #4158
- State rank
- #187 of 517 in CA
Livability — Chula Vista
- Score
- 75/100
- State rank
- #127
- US rank
- #4345
Category grades
Schools grade is shown separately in the Schools card above.
Census & demographics
- Census place
- Chula Vista, CA
- County
- San Diego County · 3,178,799 people
- City population
- 255,708
- Metro
- San Diego-Chula Vista-Carlsbad, CA
- Population (ZIP)
- 57,721
- Household income
- $129,337
- Rent vs Own
- Severe rent burden
- 1806.0
Population outlook (San Diego County) Hauer SSP2
- Today (2025)
- 3,678,185 people
- By 2030
- 3,856,546 · +4.8%
- By 2040
- 4,171,407 · +13.4%
- By 2050
- 4,421,607 · +20.2%
- By 2075
- 4,831,599 · +31.4%
- By 2100
- 4,832,502 · +31.4%
Race, ethnicity, and origin ACS 2023
- Neighborhood character
- Diverse neighborhood (Simpson 0.69)
- Race & ethnicity
- Hispanic / Latino 47% Asian 25% Two or more races 24% White 14% Black 8%
- Hispanic origin (detail)
- Mexican 42% Puerto Rican 2%
- Common ancestry
- Italian 1% Hispanic 1% Iranian 1%
- Foreign-born
- 31% · Canada, China, South Korea
- Languages at home
- 49% English-only · Spanish 34% Tagalog/Filipino 11% Other Asian/Pacific 2%
Political lean MEDSL · San Diego
- 2024 margin
- D (+16.8) · D 56.9% · R 40.1% · Other 2.9%
- 2008→2024 swing
- +6.6pp toward D · 2008: 10.2pp · 2024: 16.8pp
- All cycles
- 2024: D+16.8 2020: D+22.8 2016: D+17.8 2012: D+5.1 2008: D+10.2
Not yet ingested
- Civics
- —
Market trends
- HPI YoY
- ▼ -151.26%
- Current HPI
- 350.4967
- Rent YoY
- ▲ 0.88%
- Metro
- San Diego-Chula Vista-Carlsbad, CA
- State GDP YoY
- ▲ 3.21%
- F500 in state
- 116
Industry mix (Fortune 500 HQ in CA)
| Industry | F500 HQs | Revenue |
|---|---|---|
| Technology | 27 | $1,492B |
|
||
| Financial Services | 3 | $174B |
|
||
| Retail | 3 | $44B |
|
||
| Insurance | 3 | $26B |
|
||
| Media / Entertainment | 2 | $115B |
|
||
| Pharmaceuticals / Biotech | 2 | $62B |
|
||
Price history
+77.1% since first listed20 events — show timeline
- 2026-04-30 Pending — SDMLS
- 2026-04-01 Listed $240,000 SDMLS
- 2026-02-20 Relisted — SDMLS
- 2026-01-28 Pending — SDMLS
- 2025-12-12 Relisted — SDMLS
- 2025-10-30 Listing Removed — SDMLS
- 2025-10-29 Listing Removed — SDMLS
- 2025-10-22 Listed $240,000 SDMLS
- 2025-09-08 Relisted — SDMLS
- 2025-08-26 Pending — SDMLS
- 2025-08-26 Listing Removed — SDMLS
- 2025-05-12 Listed $225,000 SDMLS
- 2019-08-02 Sold (MLS) $130,000 SDMLS
- 2019-08-02 Sold (MLS) $130,000 CRMLS
- 2019-07-11 Pending — CRMLS
- 2019-07-11 Pending — SDMLS
- 2019-04-30 Listed $130,000 SDMLS
- 2019-04-30 Listed $130,000 CRMLS
- 2008-09-29 Sold (MLS) $120,000 CRMLS
- 2008-03-10 Listed $135,500 CRMLS
Cash-flow waterfall
monthlySold comps — $/sqft
last 12 mo · ≤1 miLoading sold comps…