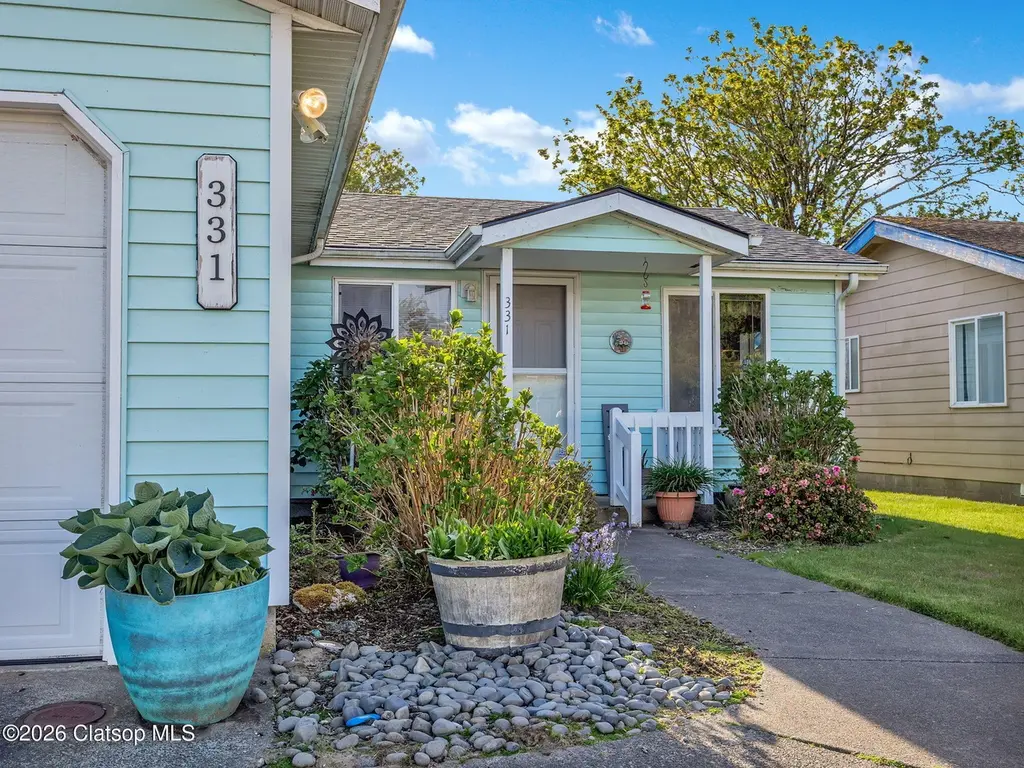
1100 NW Warrenton Dr #331 · Warrenton, OR
Flood risk No data
- FEMA flood zone
- —
- Chance of flooding over 30 yrs
- —
- Est. flood insurance / yr
- —
Fire risk No data
- Est. fire insurance / yr
- —
Heat risk No data
- Hot days now (above threshold)
- —
- Hot days in 30 yrs
- —
Wind risk No data
- Chance of severe wind over 30 yrs
- —
Air-quality risk No data
- Unhealthy air days now
- —
- Unhealthy air days in 30 yrs
- —
Risk factors via First Street. Map © Google.
Why this score? — see what drove the D+ grade
The composite is a weighted blend of 9 inputs, each scored 0–100. Each bar is that input's sub-score; the figure is the points it added to the 100-point composite (weight × sub-score).
- Cash flow +19.4/30.0
- ARV discount +7.5/15.0
- DSCR +6.1/10.0
- 1% rule +4.1/10.0
- Schools +3.9/10.0
- Livability +3.6/5.0
- Rent growth +2.5/5.0
- Condition / age +2.5/5.0
- Appreciation +0.0/10.0
$179,000
🖨 Deal sheet 📄 Offer letter ✓ Due diligence
Listing remarks MLS
Welcome home to Alder Creek Village, a 55+ older manufactured home park in Warrenton, Oregon. Three bedrooms, two bathroom home with a lovely fenced backyard and patio. The roof is three years old! Call tour for a private tour.
Key facts
- Functional layout
- Convenient location
- Move in ready
Tags
Property features AI
Finance
- Other: Property listed as residential (manufactured home in park); Main living area reported as approximately 1,040
- Financial info: Land lease in effect (monthly lot rent reported); Land lease expires July 1, 2027
- HOA & community: HOA/park association (CWRES) provides management, water, and sewer
Exterior
- Parking: Driveway parking; Attached 2-car garage
- Security: No security features listed
- Utilities: Electric fuel; Public water; Public sewer; Internet service available (other)
- Home design: Manufactured home in a park; Single-story / one level; Not attached to other properties; Built in 1997; Entry facing information not provided
- Construction: Composition roof; Block foundation
- Exterior features: Fenced yard; Patio; Yard; Vinyl siding; Located on a cul-de-sac; Leased land (land lease); Level lot; Paved road access; Seasonal view
Interior
- Kitchen: Dishwasher; Free-standing range; Free-standing refrigerator; Electric tank hot water
- Bedrooms: Primary bedroom on main level; Second bedroom on main level; Third bedroom on main level
- Bathrooms: Two full bathrooms (both on the main level)
- Heating & cooling: Forced-air heating; No central cooling indicated
- Interior features: High ceilings; Laundry area; Double-pane windows with vinyl frames; Accessible design with minimal steps; one-level living; Crawl space basement
- Laundry & utility: Laundry on main level
Neighborhood map
What this means for you Summary
Snapshot
- This is a 2-bed/2.0-bath manufactured listed at $179k.
Deal economics
- At list price, monthly cash flow is $200 ($2k/yr) — positive.
- The deal already cash-flows at list — no discount required.
- To meet the 1% rule (rent ≥ 1% of price), the offer needs to be $162k (9.4% below list).
- Recommended offer: $162k (9.4% below list) — sets the bar for 1% rule.
- Cap rate 7.6% vs local median 2.6% in Warrenton — top-decile yield for the area; either an underpriced asset or a hidden risk that comps aren't pricing in. Stress-test before assuming the spread holds.
Location & tenants
- Location reads 71/100 on livability (#112 in OR) — a middle-class / working-renter tenant base. Strengths: housing A+, commute A-, employment B; Watch: health & safety C-, crime F, amenities F.
- Warrenton-Hammond SD 30 (town): math 38% / reading 49% proficiency, ranked #88 of 183 in OR (top 48%) — families likely to look elsewhere, expect single-tenant / working-renter base with shorter leases.
- Zoned schools: Warrenton Grade School (reading 24%, 449 students, 48% FRL); Warrenton Middle School (244 students, 41% FRL); Warrenton High School (275 students, 51% FRL) — zoned schools at 47% FRL track the district average.
- Market conditions: 97 active listings in the ZIP; 98 units permitted in Clatsop County in 2024 (0 in 5+ unit buildings).
Forward outlook
- Local home prices are declining (-3.0%/yr); year-one equity from $1k of loan paydown is wiped out by about $5k of value loss. Plan a longer hold.
Negotiation context
- It's been on market 46 days — a 3% lower offer ($174k) is reasonable based on typical stale-listing flexibility.
- 3 sale attempts since 29y ago; this cycle's ask has dropped $20k (10%) from the opening price — seller is motivated, your offer sets the floor, not the list.
- Current owner paid $67k; list at $179k implies a 168% gain — meaningful room to come down on a strong offer.
Questions for the listing agent
- It's been on market 46 days. Have you received any prior offers? Is the seller open to a 9% concession, seller financing, or rate buy-down credit?
- Is there a deadline driving the sale (1031 exchange, divorce, estate, relocation)? That informs how much negotiation room exists.
- Crime grade is F in this area — have there been break-ins, vandalism, or insurance claims at this property in the last 3 years? What carrier currently insures it and at what premium?
- The area grade is low — what's the realistic commute time and amenity access for the typical tenant pool here? Any planned neighborhood developments (good or bad) we should know about?
- What's the average days-on-market for RENTAL listings here right now (not sales)? A rising rental-DOM trend means longer vacancies and softer asking-rent achievability than the comps imply.
- What's the recent tenant-quality profile in this submarket — average credit score on applications, eviction rate, late-payment / NSF rate, and stable-employment percentage? A property-management company in the area should have these aggregated.
- How much new for-sale + rental construction is in the pipeline within 1–3 miles? Heavy new supply typically softens prices + rents 12–24 months out; constrained supply supports both.
Investment metrics
- 1% rule
- 0.91% ✗
- Cap rate
- 7.64%
- Cash-on-cash
- 4.80%
- DSCR
- 1.21
- GRM
- 9.2
CMA / ARV
- ARV (median comp)
- $59,003
- List price
- $179,000
- Delta
- 203.37%
- Verdict
- OVERPRICED
- Comps
- 10 within 1.0 mi
Show comp detail 3 sales within ~0.75 mi
| Address | Dist | Beds/Ba | Sqft | Sold | Price | $/sf | Match |
|---|---|---|---|---|---|---|---|
| 1100 NW Warrenton Dr #335 | 0.00mi | 2/2.0 | 1,056 (+2%) | 7mo | $115,000 | $109 | 92 |
| 110 NW 4th #c5 St | 0.73mi | 3/2.0 (+1) | 924 (-11%) | 12mo | $56,000 | $61 | 33 |
| 110 NW 4th St Unit C5 | 0.73mi | 3/2.0 (+1) | 924 (-11%) | 12mo | $56,000 | $61 | 32 |
Match score weights: distance 35% · size 25% · config 20% · recency 20%. Top-matched comps best support the ARV.
Projected returns pro-forma
-3.0% appreciation · 3.0% rent growth · sell at horizon
- IRR
- -8.9%
- Equity multiple
- 0.67×
- Total profit
- $-16,317
- Equity at exit
- $26,689
- IRR
- 0.6%
- Equity multiple
- 1.04×
- Total profit
- $1,933
- Equity at exit
- $15,477
Cash invested: $50,120 (down + closing). Projections, not guarantees.
Landlord ↔ Tenant lean methodology
- Overall (STATE)
- 28 Tenant-Leaning
- State Oregon
- 28 Tenant-Leaning · D+6
- County
- — inherits STATE
- City
- — inherits STATE
ZIP-level market 97146
- Home prices YoY
- -29.9%
- Active inventory
- 97
- Price-to-rent
- 9.2×
Monthly cashflow live
- Estimated rent
- $1,622 medium interval (Pro) →
- Mortgage (P&I)
- −$939
- Tax from tax record
- −$68 /mo · $812/yr
- Insurance
- −$75
- HOA
- −$0
- Vacancy / Maint / Mgmt
- −$341
- Net cashflow
- $200
Break-even live
UW: 25.0% down · 7.5% · 30yr · 1.5% tax · 5.0% vac · 8.0% maint · 8.0% mgmt
Financing live
Cash to close
- Down payment
- $44,750
- Closing costs
- $5,370
- Reserves months
- —
- Total cash needed
- —
Loan-product check · same deal, 3 products live
Conventional
25% down · 7.5% · 30yr
- Down + closing
- —
- Monthly P&I
- —
- Monthly cashflow
- —
- DSCR
- —
- Eligible?
- —
Personal DTI + credit; lowest rate.
DSCR
20% down · 8.5% · 30yr
- Down + closing
- —
- Monthly P&I
- —
- Monthly cashflow
- —
- DSCR
- —
- Eligible?
- —
No personal income docs; deal must DSCR.
Hard money
10% down · 12.0% · 12mo
- Down + closing
- —
- Monthly P&I
- —
- Monthly cashflow
- —
- DSCR
- —
- Eligible?
- —
Short-term bridge; refi at stabilization.
Listing history 18 events
-
2026-06-19days on market $179,000 Active 46 DOM
-
2026-06-18days on market $179,000 Active 45 DOM
-
2026-06-17days on market $179,000 Active 44 DOM
-
2026-06-16days on market $179,000 Active 43 DOM
-
2026-06-15days on market $179,000 Active 42 DOM
-
2026-06-14days on market $179,000 Active 40 DOM
-
2026-06-12pricedays on market $179,000 Active 39 DOM
-
2026-06-09days on market $199,000 Active 36 DOM
-
2026-06-08days on market $199,000 Active 35 DOM
-
2026-06-07days on market $199,000 Active 34 DOM
-
2026-06-02days on market $199,000 Active 29 DOM
-
2026-06-01days on market $199,000 Active 28 DOM
-
2026-05-31days on market $199,000 Active 27 DOM
-
2026-05-30days on market $199,000 Active 26 DOM
-
2026-05-01$199,000 Active 227-char remark
Show marketing remark (227 chars)
Welcome home to Alder Creek Village, a 55+ older manufactured home park in Warrenton, Oregon. Three bedrooms, two bathroom home with a lovely fenced backyard and patio. The roof is three years old! Call tour for a private tour.
-
1998-03-23soldstatus $66,900
Show marketing remark (70 chars)
SUPER GOOD CENTS CONSTRUCTION. 55 & OVER DEVELOPMENT. OPEN DAILY
-
1997-09-19$66,900
Show marketing remark (70 chars)
SUPER GOOD CENTS CONSTRUCTION. 55 & OVER DEVELOPMENT. OPEN DAILY
ⓘ Source: listings_history table (triggers on properties + properties_extension) + one-shot
backfill from property_details.listing_events for pre-trigger history.
Tax reassessment forecast OR · Resets to sale price
- Current annual tax
- $812 · $68/mo
- Projected year-2 tax
- $1,736 · $145/mo
- Expected delta
- +$924/yr (+$77/mo · 113.9%)
ⓘ Screening estimate from a state-policy table — verify with the county assessor before closing.
Nearby sold comps map
Loading sold comps map…
Walkable amenities ~0.75 mi
Loading nearby amenities…
Taxation est. · year 1
- Rental income
- $19,463
- − Mortgage interest
- −$10,027
- − Property taxes
- −$812
- − Insurance
- −$895
- − Repairs & maintenance
- −$1,557
- − Management
- −$1,557
- − Depreciation
- −$5,207
- Taxable loss
- −$592
- Est. tax savings @ 24.0%
- +$142
- After-tax cash flow
- $2,546/yr
For passive investors: Depreciation is non-cash, so a rental often shows a tax loss while cash-flowing — sheltering income. Rental losses are passive: they offset passive income freely, and up to $25,000/yr can offset ordinary (W-2) income if you actively participate and your MAGI is under $100k (phasing out to $0 by $150k); unused losses carry forward. On sale, claimed depreciation is recaptured at up to 25%, and gains may owe capital-gains tax (a 1031 exchange can defer both). Figures are a year-1 estimate at your 24.0% rate — not tax advice; consult a CPA.
Schools (NCES district)
- District
- Warrenton-Hammond SD 30
- NCES district ID
- 4113080
- Math proficiency
- 38% ▼ -2.00%
- Reading proficiency
- 49% ▼ -2.00%
- Median HH income
- $44,286
- Composite
- 39.11/100
- National rank
- #8250
- State rank
- #88 of 183 in OR
Livability — Warrenton
- Score
- 71/100
- State rank
- #112
- US rank
- #6619
Category grades
Schools grade is shown separately in the Schools card above.
Census & demographics
- Census place
- Warrenton, OR
- Population (ZIP)
- 7,614
Population outlook (Clatsop County) Hauer SSP2
- Today (2025)
- 39,212 people
- By 2030
- 39,765 · +1.4%
- By 2040
- 40,121 · +2.3%
- By 2050
- 40,032 · +2.1%
- By 2075
- 39,123 · -0.2%
- By 2100
- 35,965 · -8.3%
Race, ethnicity, and origin ACS 2023
- Neighborhood character
- Predominantly White (76%)
- Race & ethnicity
- White 76% Hispanic / Latino 11% Two or more races 10% Asian 2%
- Hispanic origin (detail)
- Mexican 10%
- Common ancestry
- Portuguese 3% Romanian 2% Scottish 2%
- Foreign-born
- 7% · Canada
- Languages at home
- 90% English-only · Spanish 7% Other Indo-European 1% Other Asian/Pacific 1%
Political lean MEDSL · Clatsop
- 2024 margin
- D (+11.4) · D 54.1% · R 42.8% · Other 3.1%
- 2008→2024 swing
- -7.6pp toward R · 2008: 18.9pp · 2024: 11.4pp
- All cycles
- 2024: D+11.4 2020: D+11.3 2016: D+6.1 2012: D+14.6 2008: D+18.9
Not yet ingested
- Civics
- —
Market trends
- HPI YoY
- ▼ -129.15%
- Current HPI
- 303.1431
- Rent YoY
- —
- Metro
- —
- State GDP YoY
- ▲ 2.05%
- F500 in state
- 2
Industry mix (Fortune 500 HQ in OR)
| Industry | F500 HQs | Revenue |
|---|---|---|
| Consumer Goods | 1 | $51B |
|
||
Price history
+167.6% since first listed6 events — show timeline
- 2026-06-10 Price Changed $179,000 CAR
- 2026-06-10 Price Changed $179,000 RMLS
- 2026-05-01 Listed $199,000 RMLS
- 2026-05-01 Listed $199,000 CAR
- 1998-03-23 Sold (MLS) $66,900 CAR
- 1997-09-19 Listed $66,900 CAR
Property tax history
+4.6%/yrLatest (2025): $812 · -0.1% YoY. Source: county tax records.
Cash-flow waterfall
monthlySold comps — $/sqft
last 12 mo · ≤1 miLoading sold comps…