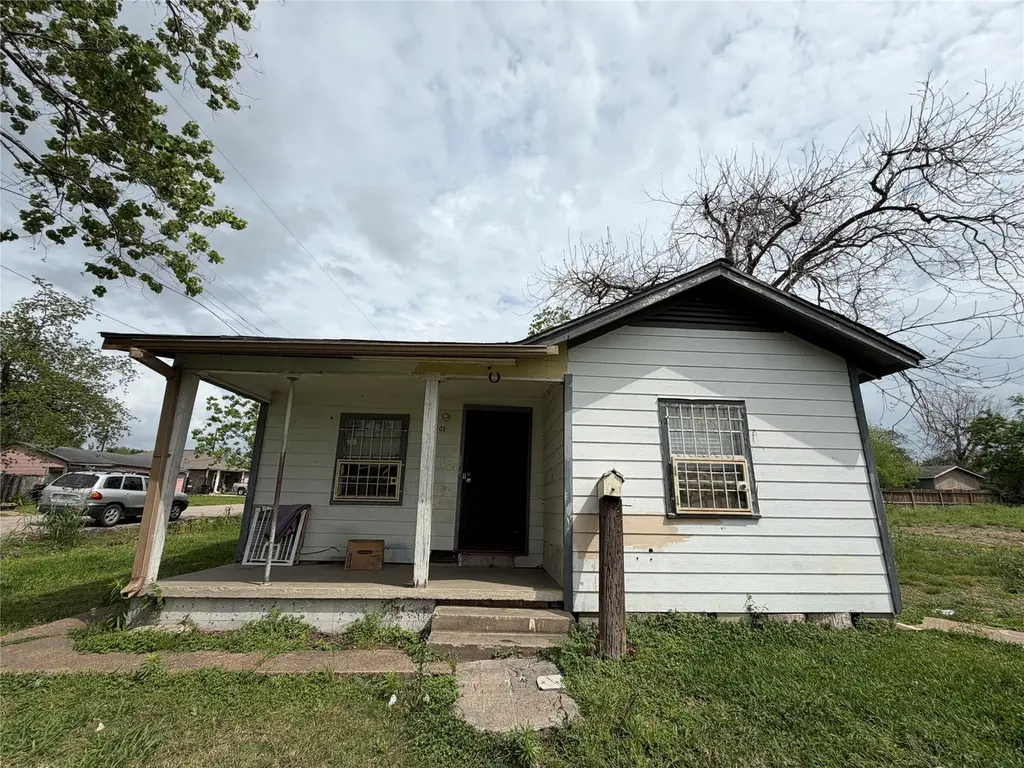
6601 Sidney St · Houston, TX
Flood risk 4/10 · Minor
- FEMA flood zone
- X (unshaded)
- Chance of flooding over 30 yrs
- 0.22%
- Est. flood insurance / yr
- $507 – $1,088
Fire risk 1/10 · Minimal
- Est. fire insurance / yr
- $1,222 – $2,270
Heat risk 9/10 · Severe
- Hot days now (above 109°F)
- 7 days/yr
- Hot days in 30 yrs
- 24 days/yr
Wind risk 9/10 · Severe
- Chance of severe wind over 30 yrs
- 99.0%
Air-quality risk 2/10 · Minimal
- Unhealthy air days now
- 2 days/yr
- Unhealthy air days in 30 yrs
- 2 days/yr
Risk factors via First Street. Map © Google.
Why this score? — see what drove the B+ grade
The composite is a weighted blend of 9 inputs, each scored 0–100. Each bar is that input's sub-score; the figure is the points it added to the 100-point composite (weight × sub-score).
- Cash flow +30.0/30.0
- ARV discount +15.0/15.0
- 1% rule +10.0/10.0
- DSCR +10.0/10.0
- Livability +3.7/5.0
- Rent growth +3.0/5.0
- Schools +2.7/10.0
- Condition / age +1.0/5.0
- Appreciation +0.0/10.0
$100,000
🖨 Deal sheet (PDF) 📄 Offer letter ✓ Due diligence
Listing remarks
1-story corner duplex with garage apartment in Foster Place. May be sold with others, Ask about other homes in The White Portfolio. with MLS# 1990690, 24409647, 26696173, 49038010, 59916271, 49999437, 7468649, 74766011, 75960757, 8783915
Key facts
- Parking
- Built 1942
- Listed 45 days
Property features AI
Finance
- Other:
- Financial info:
- HOA & community:
Exterior
- Parking: Driveway
- Security: Smoke detector(s)
- Utilities: Public water; Public sewer
- Home design: Residential property; Faces west
- Construction: Built in 1942; Wood siding; Composition roof; Block foundation
- Exterior features: Private yard; Cleared corner lot in a subdivision; Asphalt and concrete road frontage; Garage apartment (separate structure)
Interior
- Kitchen: Free-standing range; Oven
- Bedrooms: Three bedrooms (all on the first floor) — approx. 14x10, 12x10, 12x10
- Flooring: Tile; Wood
- Bathrooms: Two full bathrooms
- Heating & cooling: Window unit heating; Window unit cooling
- Interior features: Free-standing range; Oven; Tile and wood flooring
- Laundry & utility:
Neighborhood map
What this means for you Summary
Snapshot
- This is a 3-bed/2.0-bath townhouse listed at $100k. Condition is rated poor.
Deal economics
- At list price, monthly cash flow is $661 ($8k/yr) — positive.
- The deal already cash-flows at list — no discount required.
- Meets the 1% rule at list price ($2k rent vs $100k).
- Recommended offer: $97k (3.0% below list) — sets the bar for market timing.
- Cap rate 14.2% vs local median 3.1% in Houston — top-decile yield for the area; either an underpriced asset or a hidden risk that comps aren't pricing in. Stress-test before assuming the spread holds.
Location & tenants
- Location reads 74/100 on livability (#184 in TX, #4,771 nationally) — a middle-class / working-renter tenant base. Strengths: amenities A+, cost of living A+, housing A+; Watch: schools D, crime F.
- Houston ISD (urban): math 27% / reading 35% proficiency, ranked #593 of 826 in TX (top 72%) — families likely to look elsewhere, expect single-tenant / working-renter base with shorter leases; 71% free/reduced lunch — lower-income household profile, screen leases tightly.
- Market conditions: Rents rising (+2.2%/yr); 471 active listings in the ZIP; 40 comparable units currently listed for rent nearby; rentals at typical pace (median 19d on market — plan ~3-4 weeks tenant-placement turnaround); 40% of comp listings sitting > 30 days — soft ceiling on asking rent; 29,883 units permitted in Harris County in 2024 (8,621 in 5+ unit buildings).
- At $1,712/mo this rent would consume 45% of the median local household income ($46k/yr) (locally 2532% of renters already pay >50% of income on rent) — very limited rent-growth headroom before tenants either downsize or default.
Forward outlook
- Local home prices are declining (-3.0%/yr); year-one equity from $691 of loan paydown is wiped out by about $3k of value loss. Plan a longer hold.
- Harris County population projected at +47% by 2050 — long-run rental-demand tailwind backs the buy-and-hold thesis.
- At projected returns (-3.0% appreciation + 2.2% rent growth), your $28k cash investment doubles in ~5 years — after that, you're playing with house money.
Negotiation context
- It's been on market 45 days — a 3% lower offer ($97k) is reasonable based on typical stale-listing flexibility.
Risks & watch-outs
- Watch-outs: built in 1942 — expect roof / HVAC / electrical / plumbing capex.
- Climate carrying-cost: severe wind risk, 99% chance of damaging wind over 30y; extreme-heat days projected 7→24/yr by 2055 (HVAC capex compounding) — expect insurance premiums to compound above CPI over the hold.
Questions for the listing agent
- It's been on market 45 days. Have you received any prior offers? Is the seller open to a 3% concession, seller financing, or rate buy-down credit?
- Have any recent inspections been done? Can we get a copy of the seller's disclosures and any deferred-maintenance estimates?
- Built in 1942 — when were the roof, HVAC, electrical panel, plumbing, and water heater last replaced?
- Is there a deadline driving the sale (1031 exchange, divorce, estate, relocation)? That informs how much negotiation room exists.
- Schools are D-rated, which usually means shorter tenancies and higher turnover. Who's the typical renter profile here, and what's been the actual vacancy rate?
- Crime grade is F in this area — have there been break-ins, vandalism, or insurance claims at this property in the last 3 years? What carrier currently insures it and at what premium?
- What's the average days-on-market for RENTAL listings here right now (not sales)? A rising rental-DOM trend means longer vacancies and softer asking-rent achievability than the comps imply.
- What's the recent tenant-quality profile in this submarket — average credit score on applications, eviction rate, late-payment / NSF rate, and stable-employment percentage? A property-management company in the area should have these aggregated.
- How much new for-sale + rental construction is in the pipeline within 1–3 miles? Heavy new supply typically softens prices + rents 12–24 months out; constrained supply supports both.
Investment metrics
- 1% rule
- 1.71% ✓
- Cap rate
- 14.23%
- Cash-on-cash
- 28.34%
- DSCR
- 2.26
- GRM
- 4.9
CMA / ARV
- ARV (median comp)
- $178,421
- List price
- $100,000
- Delta
- -43.95%
- Verdict
- UNDERPRICED
- Comps
- 18 within 2.0 mi
Projected returns pro-forma
-3.0% appreciation · 2.17% rent growth · sell at horizon
- IRR
- 21.6%
- Equity multiple
- 1.88×
- Total profit
- $24,514
- Equity at exit
- $14,910
- IRR
- 29.2%
- Equity multiple
- 3.50×
- Total profit
- $69,954
- Equity at exit
- $8,646
Cash invested: $28,000 (down + closing). Projections, not guarantees.
Landlord ↔ Tenant lean methodology
- Overall (STATE)
- 87 Strongly Landlord-Friendly
- State Texas
- 87 Strongly Landlord-Friendly · R+5
- County
- — inherits STATE
- City
- — inherits STATE
ZIP-level market 77021
- Home prices YoY
- -23.6%
- Rents YoY
- 2.2%
- Active inventory
- 471
- Price-to-rent
- 4.9×
Monthly cashflow live
- Estimated rent
- $1,712 high interval (Pro) →
- Mortgage (P&I)
- −$524
- Tax est. 1.5%
- −$125 /mo · $1,500/yr
- Insurance
- −$42
- HOA
- −$0
- Vacancy / Maint / Mgmt
- −$359
- Net cashflow
- $661
Break-even live
Sensitivity live
| Price | -10% $730 | -5% $696 | +0% $661 | +5% $627 | +10% $592 |
|---|---|---|---|---|---|
| Rent | -10% $526 | -5% $594 | +0% $661 | +5% $729 | +10% $796 |
| Rate | -1.0pp $712 | -0.5pp $687 | base $661 | +0.5pp $635 | +1.0pp $609 |
UW: 25.0% down · 7.5% · 30yr · 1.5% tax · 5.0% vac · 8.0% maint · 8.0% mgmt
Financing live
Cash to close
- Down payment
- $25,000
- Closing costs
- $3,000
- Reserves months
- —
- Total cash needed
- —
Loan-product check · same deal, 3 products live
Conventional
25% down · 7.5% · 30yr
- Down + closing
- —
- Monthly P&I
- —
- Monthly cashflow
- —
- DSCR
- —
- Eligible?
- —
Personal DTI + credit; lowest rate.
DSCR
20% down · 8.5% · 30yr
- Down + closing
- —
- Monthly P&I
- —
- Monthly cashflow
- —
- DSCR
- —
- Eligible?
- —
No personal income docs; deal must DSCR.
Hard money
10% down · 12.0% · 12mo
- Down + closing
- —
- Monthly P&I
- —
- Monthly cashflow
- —
- DSCR
- —
- Eligible?
- —
Short-term bridge; refi at stabilization.
Rent comps 40 comps
| Address | Beds | Baths | Sqft | Rent | $/sqft | DOM | Units | Dist |
|---|---|---|---|---|---|---|---|---|
| 6926 Paris St Houston, TX | 3.0 | 2.0 | 1276 | $1,900 | $1.49 | 0d | 1 | 0.46mi |
| 6928 Paris St Houston, TX | 3.0 | 2.0 | 1276 | $1,900 | $1.49 | 0d | 1 | 0.46mi |
| 7032 Conley St Houston, TX | 3.0 | 2.0 | 1220 | $2,850 | $2.34 | 44d | 1 | 0.47mi |
| 6532 Weston St Unit A Houston, TX | 3.0 | 3.0 | 1484 | $2,200 | $1.48 | 18d | 1 | 0.52mi |
| 6528 Weston St Unit A Houston, TX | 3.0 | 3.0 | 1484 | $2,200 | $1.48 | 0d | 1 | 0.53mi |
| 6528 Weston St Unit A Houston, TX | 3.0 | 3.0 | 1484 | $2,200 | $1.48 | 44d | 1 | 0.53mi |
| 4007 Corder St Houston, TX | 2.0 | 1.0 | 814 | $885 | $1.09 | 25d | 1 | 0.63mi |
| 5813 England St Unit A Houston, TX | 3.0 | 2.5 | 1473 | $2,195 | $1.49 | 4d | 1 | 0.65mi |
| 3603 Alice St Houston, TX | 2.0 | 1.0 | 850 | $1,000 | $1.18 | 5d | 1 | 0.77mi |
| 3603 Alice St Unit 15 Houston, TX | 2.0 | 1.0 | 850 | $999 | $1.18 | 8d | 1 | 0.79mi |
| 5918 Schroeder Rd Houston, TX | 1.0–2.0 | 1.0 | 850 | $1,000 | $1.18 | 44d | 1 | 0.85mi |
| 5924 Schroeder Rd Houston, TX | 2.0 | 1.0 | 900 | $895 | $0.99 | 23d | 1 | 0.85mi |
| 5924 Schroeder Rd Houston, TX | 2.0 | 1.0 | 900 | $895 | $0.99 | 44d | 1 | 0.85mi |
| 4942 Bataan Rd Unit 77033 Houston, TX | 4.0 | 2.0 | 1350 | $1,800 | $1.33 | 44d | 1 | 0.93mi |
| 3560 Dixie Dr Unit 2162 Houston, TX | 2.0 | 2.0 | 1322 | $1,410 | $1.07 | 6d | 1 | 0.94mi |
| 3560 Dixie Dr Unit 3597 Houston, TX | 2.0 | 2.0 | 1322 | $1,434 | $1.08 | 11d | 1 | 0.94mi |
| 3560 Dixie Dr Unit 2165 Houston, TX | 2.0 | 2.0 | 1322 | $1,440 | $1.09 | 0d | 1 | 0.94mi |
| 3560 Dixie Dr Unit 3617 Houston, TX | 2.0 | 2.0 | 1322 | $1,435 | $1.09 | 44d | 1 | 0.94mi |
| 3560 Dixie Dr Apt 422 Houston, TX | 2.0 | 2.0 | 1322 | $1,410 | $1.07 | 8d | 1 | 0.94mi |
| 3644 Griggs Rd Unit 1047940P Houston, TX | 3.0 | 2.5 | 1399 | $2,161 | $1.54 | 2d | 1 | 0.96mi |
| 5123 Dewberry St Houston, TX | 4.0 | 2.0 | 1391 | $2,400 | $1.73 | 44d | 1 | 0.96mi |
| 5116 Griggs Rd Houston, TX | 3.0 | 2.0 | 1131 | $1,316 | $1.16 | 44d | 1 | 1.11mi |
| 3426 Tampa St Unit 4272026 Houston, TX | 2.0 | 1.5 | 1046 | $1,500 | $1.43 | 44d | 1 | 1.11mi |
| 4530 Mayflower St Houston, TX | 3.0 | 2.0 | 1302 | $1,800 | $1.38 | 44d | 1 | 1.14mi |
| 5154 Griggs Rd Unit CAVE Houston, TX | 2.0 | 2.0 | 1322 | $1,420 | $1.07 | 3d | 1 | 1.15mi |
| 4722 Old Spanish Trl Unit B301 Houston, TX | 2.0 | 2.0 | 1027 | $1,695 | $1.65 | 45d | 1 | 1.17mi |
| 3360 Alice St Unit 510 Houston, TX | 3.0 | 2.0 | 1154 | $1,172 | $1.02 | 12d | 1 | 1.26mi |
| 3360 Alice St Unit 3174 Houston, TX | 3.0 | 2.0 | 1154 | $1,167 | $1.01 | 0d | 1 | 1.26mi |
| 3360 Alice St Unit 2174 Houston, TX | 2.0 | 2.0 | 945 | $966 | $1.02 | 17d | 1 | 1.26mi |
| 3360 Alice St Unit 2292 Houston, TX | 2.0 | 2.0 | 945 | $998 | $1.06 | 45d | 1 | 1.26mi |
| 3360 Alice St Unit 2174 Houston, TX | 2.0 | 2.0 | 945 | $991 | $1.05 | 14d | 1 | 1.26mi |
| 3360 Alice St Unit 3387 Houston, TX | 2.0 | 2.0 | 968 | $1,353 | $1.40 | 0d | 1 | 1.26mi |
| 3360 Alice St Unit 2162 Houston, TX | 2.0 | 2.0 | 968 | $1,323 | $1.37 | 8d | 1 | 1.26mi |
| 3360 Alice St Unit 3047 Houston, TX | 3.0 | 2.0 | 1154 | $1,172 | $1.02 | 12d | 1 | 1.28mi |
| 3360 Alice St Unit 2047 Houston, TX | 2.0 | 2.0 | 968 | $1,347 | $1.39 | 3d | 1 | 1.28mi |
| 3716 Southmore Blvd Houston, TX | 2.0 | 1.0 | 850 | $1,000 | $1.18 | 44d | 1 | 1.29mi |
| 5537 Bataan Rd Houston, TX | 2.0 | 1.0 | 880 | $1,300 | $1.48 | 44d | 1 | 1.31mi |
| 7823 Gladstone St Houston, TX | 2.0 | 2.0 | 850 | $1,600 | $1.88 | 44d | 1 | 1.33mi |
| 4615 Redbud St Unit b Houston, TX | 3.0 | 2.0 | 872 | $1,149 | $1.32 | 25d | 1 | 1.34mi |
| 7818 Calhoun Rd Unit 8 Houston, TX | 2.0 | 1.0 | 800 | $1,200 | $1.50 | 44d | 1 | 1.34mi |
Listing history 7 events
-
2026-06-10days on market $100,000 Active 45 DOM
-
2026-06-08days on market $100,000 Active 44 DOM
-
2026-06-07days on market $100,000 Active 43 DOM
-
2026-06-04days on market $100,000 Active 40 DOM
-
2026-06-01days on market $100,000 Active 37 DOM
-
2026-05-31days on market $100,000 Active 36 DOM
-
2026-04-24$100,000 Active 237-char remark
ⓘ Source: listings_history table (triggers on properties + properties_extension) + one-shot
backfill from property_details.listing_events for pre-trigger history.
Climate risk First Street
- Flood 4/10 Moderate FEMA zone X (unshaded) · 22% chance over 30 yrs
- Wildfire 1/10 Low
- Heat 9/10 Extreme 7 d/yr ≥109°F today · 24 d/yr by 30 yrs out
- Wind 9/10 Extreme 99% chance of damaging wind over 30 yrs
- Air quality 2/10 Low 2 unhealthy d/yr today · 2 by 30 yrs out
Nearby sold comps map
Loading sold comps map…
Walkable amenities ~0.75 mi
Loading nearby amenities…
Taxation est. · year 1
- Rental income
- $20,541
- − Mortgage interest
- −$5,602
- − Property taxes
- −$1,500
- − Insurance
- −$500
- − Repairs & maintenance
- −$1,643
- − Management
- −$1,643
- − Depreciation
- −$2,909
- Taxable income
- $6,743
- Est. tax owed @ 24.0%
- −$1,618
- After-tax cash flow
- $6,316/yr
For passive investors: Depreciation is non-cash, so a rental often shows a tax loss while cash-flowing — sheltering income. Rental losses are passive: they offset passive income freely, and up to $25,000/yr can offset ordinary (W-2) income if you actively participate and your MAGI is under $100k (phasing out to $0 by $150k); unused losses carry forward. On sale, claimed depreciation is recaptured at up to 25%, and gains may owe capital-gains tax (a 1031 exchange can defer both). Figures are a year-1 estimate at your 24.0% rate — not tax advice; consult a CPA.
Condition & rehab AI · 7 photos
This 1-story corner duplex requires extensive repairs and maintenance to bring it up to a livable condition. The home is in poor condition and requires painting, landscaping, and major repairs to the kitchen and HVAC unit.
Repairs flagged
- Major Exposed plumbing — Exposed plumbing indicates potential water damage
- Major Missing cabinets — Missing cabinets require replacement
- Major Broken window panes — Broken window panes need immediate repair
- Major Exposed HVAC unit — Exposed HVAC unit requires maintenance
Value-add opportunities
- Both Painting — Painting can improve the home's appearance and increase its value
- Both Landscaping — Landscaping can enhance curb appeal and attract potential buyers
- Rental Refrigerator — A refrigerator is essential for rental properties
- Resale Cabinets — Cabinets can add storage space and improve the kitchen's functionality
- Both HVAC unit — A functional HVAC unit is essential for both resale and rental
Renovation cost estimate screening
| Repair item | Severity | Est. cost |
|---|---|---|
| Exposed plumbing · Exposed plumbing indicates potential water damage | Major | $15,000–50,000 |
| Missing cabinets · Missing cabinets require replacement | Major | $15,000–50,000 |
| Broken window panes · Broken window panes need immediate repair | Major | $15,000–50,000 |
| Exposed HVAC unit · Exposed HVAC unit requires maintenance | Major | $15,000–50,000 |
| Total estimated repair cost · 4 items | $60,000–200,000 |
Value-add ROI direction
- Both Painting — Painting can improve the home's appearance and increase its value ↑
- Both Landscaping — Landscaping can enhance curb appeal and attract potential buyers ↑
- Rental Refrigerator — A refrigerator is essential for rental properties ↑
- Resale Cabinets — Cabinets can add storage space and improve the kitchen's functionality ↑
- Both HVAC unit — A functional HVAC unit is essential for both resale and rental ↑
ⓘ Cost ranges are severity-bucket heuristics (US national rule-of-thumb). Get contractor quotes + a written scope before underwriting a rehab budget.
Schools (NCES district)
- District
- Houston ISD
- NCES district ID
- 4823640
- Math proficiency
- 27% ▼ -18.00%
- Reading proficiency
- 35% ▼ -6.00%
- Median HH income
- $46,054
- Composite
- 26.63/100
- National rank
- #7173
- State rank
- #593 of 826 in TX
Livability — Houston
- Score
- 74/100
- State rank
- #184
- US rank
- #4771
Category grades
Schools grade is shown separately in the Schools card above.
Census & demographics
- Census place
- Houston, TX
- County
- Harris County · 4,702,590 people
- City population
- 3,226,434
- Metro
- Houston-The Woodlands-Sugar Land, TX
- Population (ZIP)
- 26,153
- Household income
- $45,574
- Rent vs Own
- Severe rent burden
- 2532.0
Population outlook (Harris County) Hauer SSP2
- Today (2025)
- 5,571,493 people
- By 2030
- 6,089,821 · +9.3%
- By 2040
- 7,142,806 · +28.2%
- By 2050
- 8,185,864 · +46.9%
- By 2075
- 10,574,329 · +89.8%
- By 2100
- 12,109,958 · +117.4%
Race, ethnicity, and origin ACS 2023
- Neighborhood character
- Diverse neighborhood (Simpson 0.55)
- Race & ethnicity
- Black 62% Hispanic / Latino 22% Two or more races 12% White 10% Asian 2%
- Hispanic origin (detail)
- Mexican 15%
- Common ancestry
- Italian 1% Romanian 1% Lithuanian 1%
- Foreign-born
- 11% · Canada
- Languages at home
- 77% English-only · Spanish 19% French/Haitian/Cajun 1% Other Indo-European 1%
Political lean MEDSL · Harris
- 2024 margin
- Lean D (+5.5) · D 52.0% · R 46.4% · Other 1.6%
- 2008→2024 swing
- +3.9pp toward D · 2008: 1.6pp · 2024: 5.5pp
- All cycles
- 2024: D+5.5 2020: D+13.3 2016: D+12.4 2012: D+0.1 2008: D+1.6
Not yet ingested
- Civics
- —
Market trends
- HPI YoY
- ▼ -71.22%
- Current HPI
- 230.2869
- Rent YoY
- ▲ 2.17%
- Metro
- Houston-The Woodlands-Sugar Land, TX
- State GDP YoY
- ▲ 3.95%
- F500 in state
- 110
Industry mix (Fortune 500 HQ in TX)
| Industry | F500 HQs | Revenue |
|---|---|---|
| Energy | 16 | $1,198B |
|
||
| Technology | 5 | $198B |
|
||
| Engineering / Construction | 4 | $72B |
|
||
| Energy Services | 3 | $60B |
|
||
| Utilities | 3 | $41B |
|
||
| Healthcare | 2 | $330B |
|
||
Price history
2 events — show timeline
- 2026-06-10 Listing Removed — HARMLS
- 2026-04-24 Listed $100,000 HARMLS
Cash-flow waterfall
monthlySold comps — $/sqft
last 12 mo · ≤1 miLoading sold comps…