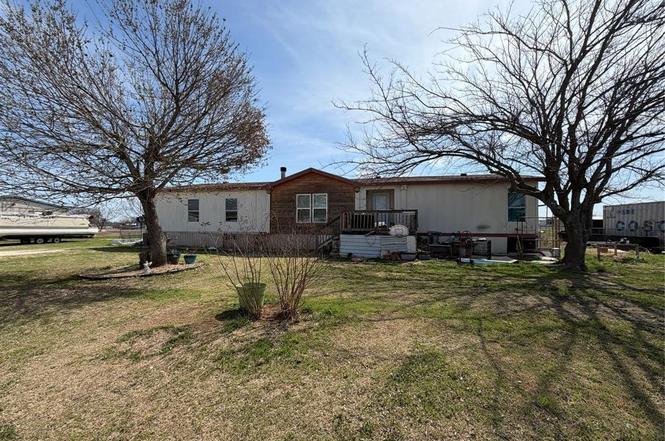
240 Paint Ct · Stephenville, TX
Flood risk 1/10 · Minimal
- FEMA flood zone
- X (unshaded)
- Chance of flooding over 30 yrs
- 0.0%
- Est. flood insurance / yr
- $507 – $1,088
Fire risk 8/10 · Major
- Est. fire insurance / yr
- $1,222 – $2,270
Heat risk 7/10 · Major
- Hot days now (above 105°F)
- 7 days/yr
- Hot days in 30 yrs
- 22 days/yr
Wind risk 6/10 · Moderate
- Chance of severe wind over 30 yrs
- 27.0%
Air-quality risk 1/10 · Minimal
- Unhealthy air days now
- 0 days/yr
- Unhealthy air days in 30 yrs
- 0 days/yr
Risk factors via First Street. Map © Google.
Why this score? — see what drove the C- grade
The composite is a weighted blend of 9 inputs, each scored 0–100. Each bar is that input's sub-score; the figure is the points it added to the 100-point composite (weight × sub-score).
- Cash flow +19.5/30.0
- ARV discount +7.5/15.0
- DSCR +6.2/10.0
- 1% rule +4.4/10.0
- Schools +4.2/10.0
- Livability +3.8/5.0
- Rent growth +2.5/5.0
- Condition / age +2.5/5.0
- Appreciation +0.0/10.0
$189,000
🖨 Deal sheet 📄 Offer letter ✓ Due diligence
Listing remarks MLS
Spacious 3 bedroom 2 bath manufactured home, open concept, spacious living area with fireplace. Large kitchen, island, great cabinet space, granite counters, and open dining area, great for entertaining. All bedrooms are large, master bath boast his & her vanity plus x-tra dressing area for her with addl vanity space. Quiet neighborhood, nice large fenced yard and all on a little over half an acre. Convenient to schools & shopping.
Key facts
- Split-bedroom layout
- Spacious living area
- Updated kitchen
Tags
Property features AI
Finance
- Financial info: Listing terms include cash and conventional financing
- HOA & community: No homeowner association
Exterior
- Parking: Driveway (no garage or carport)
- Security: Smoke detectors
- Utilities: Co-op electric; Septic system; Underground utilities; Not in a municipal utility district
- Home design: Manufactured home; One level
- Construction: Built in 1997; Siding exterior; Composition roof; Other foundation
- Exterior features: Back yard with chain-link fencing; Large backyard with grass; Located on a cul-de-sac
Interior
- Kitchen: Granite countertops; Kitchen island; Built-in cabinets; Breakfast bar; Dishwasher; Disposal; Electric range; Microwave
- Bedrooms: Primary bedroom on level 1 with separate shower and walk-in closet; Three additional bedrooms on level 1 (one 13 x 12, one 14 x 13, one 10 x 10) — split bedroom layout
- Flooring: Laminate; Luxury vinyl plank
- Bathrooms: Two full bathrooms
- Heating & cooling: Central heating (electric); Central air; Ceiling fans
- Interior features: Built-in features; Decorative lighting; Eat-in kitchen; Kitchen island; Open floorplan; Window coverings
- Laundry & utility: Utility room with space for a freezer; Full-size washer/dryer area; Washer hookup
Neighborhood map
What this means for you Summary
Snapshot
- This is a 4-bed/2.0-bath single-family listed at $189k.
Deal economics
- At list price, monthly cash flow is $215 ($3k/yr) — positive.
- The deal already cash-flows at list — no discount required.
- To meet the 1% rule (rent ≥ 1% of price), the offer needs to be $178k (5.6% below list).
- Recommended offer: $178k (6.0% below list) — sets the bar for market timing.
- Cap rate 7.7% vs local median 2.1% in Stephenville — top-decile yield for the area; either an underpriced asset or a hidden risk that comps aren't pricing in. Stress-test before assuming the spread holds.
Location & tenants
- Location reads 75/100 on livability (#124 in TX, #3,840 nationally) — a middle-class / working-renter tenant base. Strengths: cost of living A+, housing A+, health & safety A+; Watch: commute F, employment D-.
- Stephenville ISD (town): math 53% / reading 48% proficiency, ranked #191 of 826 in TX (top 23%) — acceptable for families but not a draw, mixed tenant base, ~2y average lease.
- Zoned schools: Central El (422 students, 64% FRL) — zoned schools average 64% FRL vs 42% district-wide (22 pts higher); higher-poverty schools than district average — tighter screening recommended.
- Market conditions: Rents flat; 383 active listings in the ZIP; 110 units permitted in Erath County in 2024 (61 in 5+ unit buildings).
- This rent runs 35% of the median local income ($61k/yr) — at the standard rent-burdened threshold; future hikes will face affordability resistance.
Forward outlook
- Local home prices are declining (-3.0%/yr); year-one equity from $1k of loan paydown is wiped out by about $6k of value loss. Plan a longer hold.
- Erath County population projected at +55% by 2050 — long-run rental-demand tailwind backs the buy-and-hold thesis.
Negotiation context
- It's been on market 77 days — a 6% lower offer ($178k) is reasonable based on typical stale-listing flexibility.
- 4 sale attempts since 19y ago; this cycle's ask has dropped $10k (5%) from the opening price — seller is motivated, your offer sets the floor, not the list.
Risks & watch-outs
- Climate carrying-cost: major wind risk, 27% chance of damaging wind over 30y; severe wildfire risk; extreme-heat days projected 7→22/yr by 2055 (HVAC capex compounding) — expect insurance premiums to compound above CPI over the hold.
Questions for the listing agent
- It's been on market 77 days. Have you received any prior offers? Is the seller open to a 6% concession, seller financing, or rate buy-down credit?
- Why hasn't it sold? Are there any deal-killer items the seller is aware of (foundation, flood, title, zoning, code violations)?
- Is there a deadline driving the sale (1031 exchange, divorce, estate, relocation)? That informs how much negotiation room exists.
- What's the average days-on-market for RENTAL listings here right now (not sales)? A rising rental-DOM trend means longer vacancies and softer asking-rent achievability than the comps imply.
- What's the recent tenant-quality profile in this submarket — average credit score on applications, eviction rate, late-payment / NSF rate, and stable-employment percentage? A property-management company in the area should have these aggregated.
- How much new for-sale + rental construction is in the pipeline within 1–3 miles? Heavy new supply typically softens prices + rents 12–24 months out; constrained supply supports both.
Investment metrics
- 1% rule
- 0.94% ✗
- Cap rate
- 7.66%
- Cash-on-cash
- 4.88%
- DSCR
- 1.22
- GRM
- 8.8
CMA / ARV
- ARV (on-the-fly)
- $511,488
- Comps found
- 4
Show comp detail 4 sales within ~0.75 mi
| Address | Dist | Beds/Ba | Sqft | Sold | Price | $/sf | Match |
|---|---|---|---|---|---|---|---|
| 104 Canter Lane Dr | 0.63mi | 4/2.5 | 2,300 (-0%) | 0mo | $499,000 | $217 | 68 |
| 160 Blue Ribbon Ln | 0.56mi | 4/2.0 | 2,368 (+3%) | 5mo | $524,975 | $222 | 65 |
| 610 Walking Horse Dr | 0.47mi | 4/2.0 | 2,136 (-7%) | 15mo | $449,888 | $211 | 54 |
| 127 Flat Foot Ln | 0.73mi | 4/2.5 | 2,273 (-1%) | 13mo | $520,000 | $229 | 51 |
Match score weights: distance 35% · size 25% · config 20% · recency 20%. Top-matched comps best support the ARV.
Projected returns pro-forma
-3.0% appreciation · 0.07% rent growth · sell at horizon
- IRR
- -11.8%
- Equity multiple
- 0.58×
- Total profit
- $-22,077
- Equity at exit
- $28,181
- IRR
- -7.3%
- Equity multiple
- 0.59×
- Total profit
- $-21,522
- Equity at exit
- $16,341
Cash invested: $52,920 (down + closing). Projections, not guarantees.
Landlord ↔ Tenant lean methodology
- Overall (STATE)
- 87 Strongly Landlord-Friendly
- State Texas
- 87 Strongly Landlord-Friendly · R+5
- County
- — inherits STATE
- City
- — inherits STATE
ZIP-level market 76401
- Rents YoY
- 0.1%
- Active inventory
- 383
- Price-to-rent
- 8.8×
Monthly cashflow live
- Estimated rent
- $1,783 medium interval (Pro) →
- Mortgage (P&I)
- −$991
- Tax from tax record
- −$124 /mo · $1,486/yr
- Insurance
- −$79
- HOA
- −$0
- Vacancy / Maint / Mgmt
- −$375
- Net cashflow
- $215
Break-even live
UW: 25.0% down · 7.5% · 30yr · 1.5% tax · 5.0% vac · 8.0% maint · 8.0% mgmt
Financing live
Cash to close
- Down payment
- $47,250
- Closing costs
- $5,670
- Reserves months
- —
- Total cash needed
- —
Loan-product check · same deal, 3 products live
Conventional
25% down · 7.5% · 30yr
- Down + closing
- —
- Monthly P&I
- —
- Monthly cashflow
- —
- DSCR
- —
- Eligible?
- —
Personal DTI + credit; lowest rate.
DSCR
20% down · 8.5% · 30yr
- Down + closing
- —
- Monthly P&I
- —
- Monthly cashflow
- —
- DSCR
- —
- Eligible?
- —
No personal income docs; deal must DSCR.
Hard money
10% down · 12.0% · 12mo
- Down + closing
- —
- Monthly P&I
- —
- Monthly cashflow
- —
- DSCR
- —
- Eligible?
- —
Short-term bridge; refi at stabilization.
Listing history 15 events
-
2026-05-19status Pending
-
2026-04-27historical Active Option Contract
-
2026-04-10price $189,000
-
2026-03-03$199,000 Active
-
2018-04-10soldstatus
-
2014-04-04soldstatus 447-char remark
Show marketing remark (447 chars)
Spacious 3 bedroom 2 bath manufactured home, open concept, spacious living area with fireplace. Large kitchen, island, great cabinet space, granite counters, and open dining area, great for entertaining. All bedrooms are large, master bath boast his & her vanity plus x-tra dressing area for her with addl vanity space. Quiet neighborhood, nice large fenced yard and all on a little over half an acre. Convenient to schools & shopping.
-
2014-04-04soldstatus
Show marketing remark (447 chars)
Spacious 3 bedroom 2 bath manufactured home, open concept, spacious living area with fireplace. Large kitchen, island, great cabinet space, granite counters, and open dining area, great for entertaining. All bedrooms are large, master bath boast his & her vanity plus x-tra dressing area for her with addl vanity space. Quiet neighborhood, nice large fenced yard and all on a little over half an acre. Convenient to schools & shopping.
-
2014-03-21historical 447-char remark
Show marketing remark (447 chars)
Spacious 3 bedroom 2 bath manufactured home, open concept, spacious living area with fireplace. Large kitchen, island, great cabinet space, granite counters, and open dining area, great for entertaining. All bedrooms are large, master bath boast his & her vanity plus x-tra dressing area for her with addl vanity space. Quiet neighborhood, nice large fenced yard and all on a little over half an acre. Convenient to schools & shopping.
-
2014-03-09$52,000 447-char remark
Show marketing remark (447 chars)
Spacious 3 bedroom 2 bath manufactured home, open concept, spacious living area with fireplace. Large kitchen, island, great cabinet space, granite counters, and open dining area, great for entertaining. All bedrooms are large, master bath boast his & her vanity plus x-tra dressing area for her with addl vanity space. Quiet neighborhood, nice large fenced yard and all on a little over half an acre. Convenient to schools & shopping.
-
2013-03-07historical
-
2012-04-13$59,950
-
2007-10-01soldstatus
-
2007-09-27soldstatus
-
2007-08-30historical
-
2007-05-03$86,500
ⓘ Source: listings_history table (triggers on properties + properties_extension) + one-shot
backfill from property_details.listing_events for pre-trigger history.
Tax reassessment forecast TX · Resets to sale price
- Current annual tax
- $1,486 · $124/mo
- Projected year-2 tax
- $3,459 · $288/mo
- Expected delta
- +$1,972/yr (+$164/mo · 132.7%)
ⓘ Screening estimate from a state-policy table — verify with the county assessor before closing.
Climate risk First Street
- Flood 1/10 Low FEMA zone X (unshaded) · 0% chance over 30 yrs
- Wildfire 8/10 Severe
- Heat 7/10 Severe 7 d/yr ≥105°F today · 22 d/yr by 30 yrs out
- Wind 6/10 Major 27% chance of damaging wind over 30 yrs
- Air quality 1/10 Low 0 unhealthy d/yr today · 0 by 30 yrs out
Nearby sold comps map
Loading sold comps map…
Walkable amenities ~0.75 mi
Loading nearby amenities…
Taxation est. · year 1
- Rental income
- $21,400
- − Mortgage interest
- −$10,587
- − Property taxes
- −$1,486
- − Insurance
- −$945
- − Repairs & maintenance
- −$1,712
- − Management
- −$1,712
- − Depreciation
- −$5,498
- Taxable loss
- −$540
- Est. tax savings @ 24.0%
- +$130
- After-tax cash flow
- $2,711/yr
For passive investors: Depreciation is non-cash, so a rental often shows a tax loss while cash-flowing — sheltering income. Rental losses are passive: they offset passive income freely, and up to $25,000/yr can offset ordinary (W-2) income if you actively participate and your MAGI is under $100k (phasing out to $0 by $150k); unused losses carry forward. On sale, claimed depreciation is recaptured at up to 25%, and gains may owe capital-gains tax (a 1031 exchange can defer both). Figures are a year-1 estimate at your 24.0% rate — not tax advice; consult a CPA.
Schools (NCES district)
- District
- Stephenville ISD
- NCES district ID
- 4841520
- Math proficiency
- 53% ▼ -1.00%
- Reading proficiency
- 48% ▼ -4.00%
- Median HH income
- $39,565
- Composite
- 42.23/100
- National rank
- #3283
- State rank
- #191 of 826 in TX
Livability — Stephenville
- Score
- 75/100
- State rank
- #124
- US rank
- #3840
Category grades
Schools grade is shown separately in the Schools card above.
Census & demographics
- County
- Erath County · 31,375 people
- City population
- 31,375
- Metro
- Stephenville, TX
- Population (ZIP)
- 31,375
- Household income
- $61,210
- Rent vs Own
- Severe rent burden
- 1758.0
Population outlook (Erath County) Hauer SSP2
- Today (2025)
- 50,437 people
- By 2030
- 55,510 · +10.1%
- By 2040
- 66,379 · +31.6%
- By 2050
- 77,981 · +54.6%
- By 2075
- 109,727 · +117.6%
- By 2100
- 132,574 · +162.9%
Race, ethnicity, and origin ACS 2023
- Neighborhood character
- Predominantly White (76%)
- Race & ethnicity
- White 76% Hispanic / Latino 18% Two or more races 8% Black 2% Asian 1%
- Hispanic origin (detail)
- Mexican 15%
- Common ancestry
- Slovak 2% Italian 1% Serbian 1%
- Foreign-born
- 5% · Canada, China
- Languages at home
- 88% English-only · Spanish 10% Chinese 1%
Political lean MEDSL · Erath
- 2024 margin
- Solid R (+68.0) · D 15.7% · R 83.7%
- 2008→2024 swing
- -13.5pp toward R · 2008: -54.5pp · 2024: -68.0pp
- All cycles
- 2024: R+68.0 2020: R+63.9 2016: R+65.5 2012: R+67.1 2008: R+54.5
Not yet ingested
- Civics
- —
Market trends
- HPI YoY
- ▼ -133.71%
- Current HPI
- 234.4986
- Rent YoY
- ▲ 0.07%
- Metro
- Stephenville, TX
- State GDP YoY
- ▲ 3.95%
- F500 in state
- 110
Industry mix (Fortune 500 HQ in TX)
| Industry | F500 HQs | Revenue |
|---|---|---|
| Energy | 16 | $1,198B |
|
||
| Technology | 5 | $198B |
|
||
| Engineering / Construction | 4 | $72B |
|
||
| Energy Services | 3 | $60B |
|
||
| Utilities | 3 | $41B |
|
||
| Healthcare | 2 | $330B |
|
||
Price history
+118.5% since first listed15 events — show timeline
- 2026-05-19 Pending — NTREIS
- 2026-04-27 Contingent — NTREIS
- 2026-04-10 Price Changed $189,000 NTREIS
- 2026-03-03 Listed $199,000 NTREIS
- 2018-04-10 Sold (Public Records) — Public Records
- 2014-04-04 Sold (Public Records) — Public Records
- 2014-04-04 Sold (MLS) — NTREIS
- 2014-03-21 Listing Removed — NTREIS
- 2014-03-09 Listed $52,000 NTREIS
- 2013-03-07 Listing Removed — NTREIS
- 2012-04-13 Listed $59,950 NTREIS
- 2007-10-01 Sold (MLS) — NTREIS
- 2007-09-27 Sold (Public Records) — Public Records
- 2007-08-30 Listing Removed — NTREIS
- 2007-05-03 Listed $86,500 NTREIS
Property tax history
+2.9%/yrLatest (2025): $1,486 · -2.0% YoY. Source: county tax records.
Cash-flow waterfall
monthlySold comps — $/sqft
last 12 mo · ≤1 miLoading sold comps…