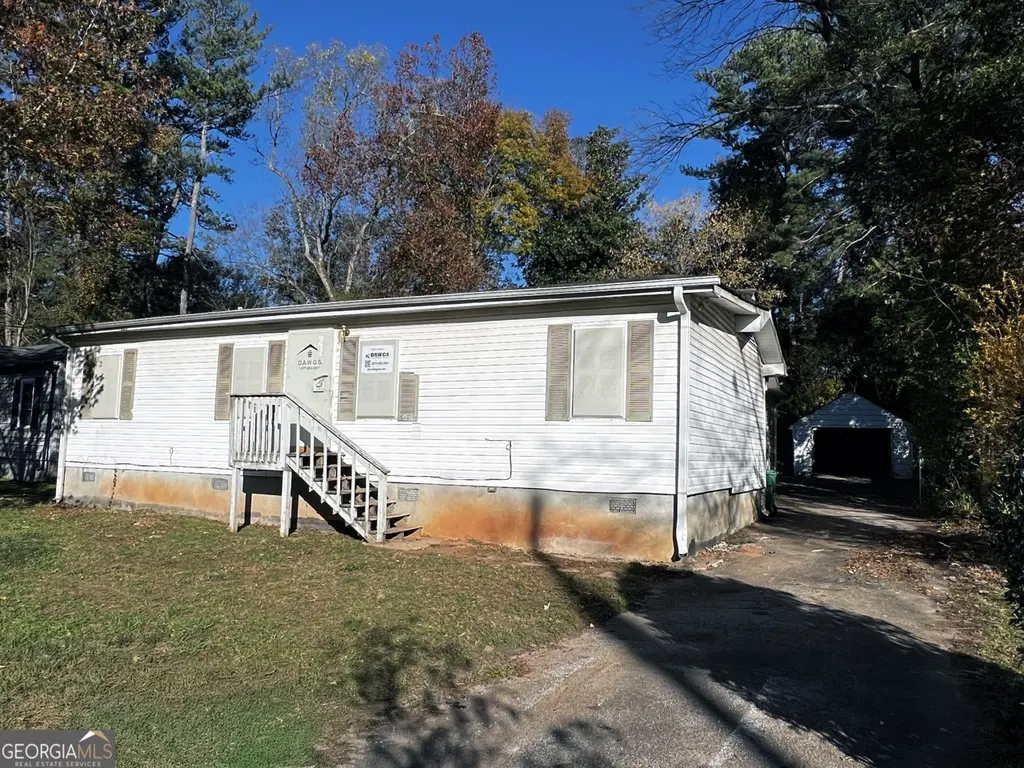
4256 Lindsey Dr · Candler-McAfee, GA
Flood risk 1/10 · Minimal
- FEMA flood zone
- X (unshaded)
- Chance of flooding over 30 yrs
- 0.0%
- Est. flood insurance / yr
- $507 – $1,088
Fire risk 1/10 · Minimal
- Est. fire insurance / yr
- $963 – $1,789
Heat risk 5/10 · Moderate
- Hot days now (above 105°F)
- 7 days/yr
- Hot days in 30 yrs
- 17 days/yr
Wind risk 5/10 · Moderate
- Chance of severe wind over 30 yrs
- 25.0%
Air-quality risk 5/10 · Moderate
- Unhealthy air days now
- 7 days/yr
- Unhealthy air days in 30 yrs
- 10 days/yr
Risk factors via First Street. Map © Google.
Why this score? — see what drove the B grade
The composite is a weighted blend of 9 inputs, each scored 0–100. Each bar is that input's sub-score; the figure is the points it added to the 100-point composite (weight × sub-score).
- Cash flow +29.8/30.0
- ARV discount +15.0/15.0
- DSCR +10.0/10.0
- 1% rule +8.7/10.0
- Rent growth +2.7/5.0
- Livability +2.5/5.0
- Condition / age +2.5/5.0
- Schools +2.1/10.0
- Appreciation +0.0/10.0
$134,500
🖨 Deal sheet 📄 Offer letter ✓ Due diligence
Listing remarks MLS
This 3-bedroom, 2-bath home features hardwood floors, a detached garage, lots of new vinyl windows, and plenty of potential. Perfect for first-time homebuyer or investor.
Key facts
- 0.3 acre lot
- Garage
- Built 1953
Neighborhood map
What this means for you Summary
Snapshot
- This is a 3-bed/2.5-bath single-family listed at $134k.
Deal economics
- At list price, monthly cash flow is $492 ($6k/yr) — positive.
- The deal already cash-flows at list — no discount required.
- Meets the 1% rule at list price ($2k rent vs $134k).
- Recommended offer: $122k (9.0% below list) — sets the bar for market timing.
- Cap rate 10.7% vs local median 4.2% in Candler-McAfee — top-decile yield for the area; either an underpriced asset or a hidden risk that comps aren't pricing in. Stress-test before assuming the spread holds.
Location & tenants
- Location reads: area grade B — affects rentability + tenant quality, not the cash-flow math above.
- Dekalb County (suburban): math 19% / reading 28% proficiency, ranked #125 of 174 in GA (top 72%) — low school quality limits family demand, transient renter base, plan for 1-2y turnover; 68% free/reduced lunch — lower-income household profile, screen leases tightly.
- Market conditions: Rents flat; 180 active listings in the ZIP; 40 comparable units currently listed for rent nearby; rentals lingering (median 44d on market — plan ~5-8 weeks vacancy on turnover, expect pricing pressure); 72% of comp listings sitting > 30 days — soft ceiling on asking rent; 1,240 units permitted in DeKalb County in 2024 (385 in 5+ unit buildings).
- This rent runs 33% of the median local income ($67k/yr) — at the standard rent-burdened threshold; future hikes will face affordability resistance.
Forward outlook
- Local home prices are declining (-3.0%/yr); year-one equity from $930 of loan paydown is wiped out by about $4k of value loss. Plan a longer hold.
- DeKalb County population projected at +28% by 2050 — long-run rental-demand tailwind backs the buy-and-hold thesis.
- At projected returns (-3.0% appreciation + 0.9% rent growth), your $38k cash investment doubles in ~10 years — after that, you're playing with house money.
Negotiation context
- It's been on market 95 days — a 9% lower offer ($122k) is reasonable based on typical stale-listing flexibility.
- 4 sale attempts since 2y ago with the ask held roughly flat each time — persistent listings suggest the price (not the market) is what's stuck; bring a comps-based counter.
- Current owner paid $110k; 22% above their basis — modest negotiation headroom, anchor on the comps not their cost.
Risks & watch-outs
- Watch-outs: built in 1953 — expect roof / HVAC / electrical / plumbing capex.
- Climate carrying-cost: moderate wind risk, 25% chance of damaging wind over 30y; extreme-heat days projected 7→17/yr by 2055 (HVAC capex compounding) — expect insurance premiums to compound above CPI over the hold.
Questions for the listing agent
- It's been on market 95 days. Have you received any prior offers? Is the seller open to a 9% concession, seller financing, or rate buy-down credit?
- Built in 1953 — when were the roof, HVAC, electrical panel, plumbing, and water heater last replaced?
- Why hasn't it sold? Are there any deal-killer items the seller is aware of (foundation, flood, title, zoning, code violations)?
- Is there a deadline driving the sale (1031 exchange, divorce, estate, relocation)? That informs how much negotiation room exists.
- What's the average days-on-market for RENTAL listings here right now (not sales)? A rising rental-DOM trend means longer vacancies and softer asking-rent achievability than the comps imply.
- What's the recent tenant-quality profile in this submarket — average credit score on applications, eviction rate, late-payment / NSF rate, and stable-employment percentage? A property-management company in the area should have these aggregated.
- How much new for-sale + rental construction is in the pipeline within 1–3 miles? Heavy new supply typically softens prices + rents 12–24 months out; constrained supply supports both.
Investment metrics
- 1% rule
- 1.37% ✓
- Cap rate
- 10.69%
- Cash-on-cash
- 15.69%
- DSCR
- 1.70
- GRM
- 6.1
CMA / ARV
- ARV (median comp)
- $262,692
- List price
- $134,500
- Delta
- -48.80%
- Verdict
- UNDERPRICED
- Comps
- 20 within 1.0 mi
Show comp detail 12 sales within ~0.75 mi
| Address | Dist | Beds/Ba | Sqft | Sold | Price | $/sf | Match |
|---|---|---|---|---|---|---|---|
| 3991 Lindsey Dr | 0.50mi | 3/3.0 | 1,550 (-2%) | 2mo | $305,000 | $197 | 70 |
| 4179 Hanes Dr | 0.12mi | 3/2.5 | 1,392 (-12%) | 7mo | $270,000 | $194 | 69 |
| 2312 Leslie Brook Dr | 0.44mi | 3/2.0 | 1,544 (-2%) | 8mo | $210,000 | $136 | 66 |
| 3985 Lindsey Dr | 0.50mi | 4/2.5 (+1) | 1,632 (+3%) | 2mo | $295,000 | $181 | 65 |
| 1763 Highland Pl | 0.63mi | 3/2.0 | 1,575 (-1%) | 6mo | $170,000 | $108 | 63 |
| 1907 Clarke | 0.23mi | 3/2.0 | 1,350 (-15%) | 1mo | $199,999 | $148 | 62 |
| 4439 Gregory Rd | 0.43mi | 3/2.0 | 1,750 (+10%) | 0mo | $259,999 | $149 | 60 |
| 2238 Leslie Brook Dr | 0.52mi | 3/2.0 | 1,446 (-9%) | 1mo | $140,000 | $97 | 58 |
| 4094 E Glade Ct | 0.47mi | 4/2.0 (+1) | 1,451 (-8%) | 7mo | $194,500 | $134 | 51 |
| 1914 Janet Ln | 0.36mi | 3/1.5 | 1,380 (-13%) | 9mo | $203,500 | $147 | 51 |
| 2256 Greenway Dr | 0.68mi | 4/3.0 (+1) | 1,664 (+5%) | 8mo | $315,000 | $189 | 46 |
| 2046 Copperfield Cir | 0.67mi | 4/2.0 (+1) | 1,683 (+6%) | 7mo | $220,000 | $131 | 46 |
Match score weights: distance 35% · size 25% · config 20% · recency 20%. Top-matched comps best support the ARV.
Projected returns pro-forma
-3.0% appreciation · 0.87% rent growth · sell at horizon
- IRR
- 4.1%
- Equity multiple
- 1.15×
- Total profit
- $5,748
- Equity at exit
- $20,054
- IRR
- 11.4%
- Equity multiple
- 1.81×
- Total profit
- $30,376
- Equity at exit
- $11,629
Cash invested: $37,660 (down + closing). Projections, not guarantees.
Landlord ↔ Tenant lean methodology
- Overall (STATE)
- 90 Strongly Landlord-Friendly
- State Georgia
- 90 Strongly Landlord-Friendly · R+3
- County
- — inherits STATE
- City
- — inherits STATE
ZIP-level market 30035
- Home prices YoY
- -33.8%
- Rents YoY
- 0.9%
- Active inventory
- 180
- Price-to-rent
- 6.1×
Monthly cashflow live
- Estimated rent
- $1,844 high interval (Pro) →
- Mortgage (P&I)
- −$705
- Tax from tax record
- −$203 /mo · $2,435/yr
- Insurance
- −$56
- HOA
- −$0
- Vacancy / Maint / Mgmt
- −$387
- Net cashflow
- $492
Break-even live
UW: 25.0% down · 7.5% · 30yr · 1.5% tax · 5.0% vac · 8.0% maint · 8.0% mgmt
Financing live
Cash to close
- Down payment
- $33,625
- Closing costs
- $4,035
- Reserves months
- —
- Total cash needed
- —
Loan-product check · same deal, 3 products live
Conventional
25% down · 7.5% · 30yr
- Down + closing
- —
- Monthly P&I
- —
- Monthly cashflow
- —
- DSCR
- —
- Eligible?
- —
Personal DTI + credit; lowest rate.
DSCR
20% down · 8.5% · 30yr
- Down + closing
- —
- Monthly P&I
- —
- Monthly cashflow
- —
- DSCR
- —
- Eligible?
- —
No personal income docs; deal must DSCR.
Hard money
10% down · 12.0% · 12mo
- Down + closing
- —
- Monthly P&I
- —
- Monthly cashflow
- —
- DSCR
- —
- Eligible?
- —
Short-term bridge; refi at stabilization.
Rent comps 40 comps
| Address | Beds | Baths | Sqft | Rent | $/sqft | DOM | Units | Dist |
|---|---|---|---|---|---|---|---|---|
| 4066 Marble Arch Ct Decatur, GA | 3.0 | 2.0 | 1344 | $1,800 | $1.34 | 43d | 1 | 0.53mi |
| 2161 Bedevere Cir Unit 2161A Decatur, GA | 2.0 | 2.0 | 1144 | $1,400 | $1.22 | 43d | 1 | 0.59mi |
| 3000 Bedevere Cir Unit 3000F Decatur, GA | 2.0 | 2.0 | 1144 | $1,400 | $1.22 | 43d | 1 | 0.61mi |
| 3010 Bedevere Cir Unit 3010A Decatur, GA | 2.0 | 2.0 | 1144 | $1,400 | $1.22 | 43d | 1 | 0.64mi |
| 3014 Bedevere Cir Unit 3014D Decatur, GA | 2.0 | 2.0 | 1144 | $1,400 | $1.22 | 43d | 1 | 0.65mi |
| 4111 Northstrand Dr Decatur, GA | 3.0 | 3.0 | 2173 | $2,031 | $0.93 | 12d | 1 | 0.66mi |
| 4085 Canby Ln Decatur, GA | 4.0 | 2.0 | 1400 | $1,650 | $1.18 | 43d | 1 | 0.66mi |
| 3017 Arthurs Ct Unit 3017 Decatur, GA | 3.0 | 2.0 | 1493 | $1,600 | $1.07 | 43d | 1 | 0.69mi |
| 3023 Arthurs Ct Unit 3023 Decatur, GA | 3.0 | 2.0 | 1493 | $1,600 | $1.07 | 43d | 1 | 0.69mi |
| 3025 Arthurs Ct Unit 3025 Decatur, GA | 3.0 | 2.0 | 1493 | $1,600 | $1.07 | 43d | 1 | 0.69mi |
| 3019 Arthurs Ct Unit 3019 Decatur, GA | 3.0 | 2.0 | 1493 | $1,600 | $1.07 | 43d | 1 | 0.69mi |
| 3015 Arthurs Ct Unit 3015 Decatur, GA | 3.0 | 2.0 | 1493 | $1,600 | $1.07 | 43d | 1 | 0.69mi |
| 3021 Arthurs Ct Unit 3021 Decatur, GA | 3.0 | 2.0 | 1493 | $1,600 | $1.07 | 43d | 1 | 0.69mi |
| 2165 Bodwin Pl Unit 2165E Decatur, GA | 2.0 | 2.0 | 1144 | $1,400 | $1.22 | 43d | 1 | 0.74mi |
| 2163 Bodwin Pl Unit 2163D Decatur, GA | 2.0 | 2.0 | 1144 | $1,400 | $1.22 | 43d | 1 | 0.74mi |
| 2011 Bodwin Pl Unit 2011 Decatur, GA | 3.0 | 2.0 | 1493 | $1,600 | $1.07 | 43d | 1 | 0.74mi |
| 2007 Bodwin Pl Unit 2007 Decatur, GA | 3.0 | 2.0 | 1493 | $1,600 | $1.07 | 43d | 1 | 0.74mi |
| 1998 Arthurs Court Dr Unit 1998 Decatur, GA | 3.0 | 2.0 | 1493 | $1,600 | $1.07 | 43d | 1 | 0.75mi |
| 1998 Arthurs Court Dr Decatur, GA | 3.0 | 2.0 | 1493 | $1,600 | $1.07 | 43d | 1 | 0.75mi |
| 4707 Riverwood Cir Decatur, GA | 3.0 | 2.0 | 1826 | $1,850 | $1.01 | 24d | 1 | 0.75mi |
| 1914 Bodwin Pl Unit 1914A Decatur, GA | 2.0 | 2.0 | 1298 | $1,450 | $1.12 | 43d | 1 | 0.76mi |
| 2002 Arthurs Court Dr Unit 2002D Decatur, GA | 2.0 | 2.0 | 1144 | $1,400 | $1.22 | 43d | 1 | 0.76mi |
| 4505 Dover Castle Dr Decatur, GA | 4.0 | 2.0 | 1532 | $1,923 | $1.26 | 43d | 1 | 0.77mi |
| 1910 Bodwin Pl Unit 1910C Decatur, GA | 2.0 | 2.0 | 1298 | $1,450 | $1.12 | 43d | 1 | 0.79mi |
| 4336 Glenhaven Dr Decatur, GA | 4.0 | 3.0 | 2100 | $2,500 | $1.19 | 43d | 1 | 0.79mi |
| 1985 Glenwood Downs Dr Decatur, GA | 3.0 | 2.5 | 1460 | $1,700 | $1.16 | 20d | 1 | 0.79mi |
| 1995 Glenwood Downs Dr Decatur, GA | 3.0 | 2.0 | 1564 | $1,750 | $1.12 | 5d | 1 | 0.79mi |
| 1908 Bodwin Pl Unit 1908F Decatur, GA | 2.0 | 2.0 | 1144 | $1,400 | $1.22 | 43d | 1 | 0.80mi |
| 2109 Newgate Dr Decatur, GA | 3.0 | 2.5 | 1701 | $1,850 | $1.09 | 43d | 1 | 0.80mi |
| 4655 Glenwood Rd Decatur, GA | 2.0–3.0 | 2.0 | 1318 | $1,600 | $1.21 | 19d | 31 | 0.80mi |
| 2319 Wingfoot Pl Decatur, GA | 3.0 | 2.5 | 1840 | $1,800 | $0.98 | 43d | 1 | 0.81mi |
| 4033 Emerald North Cir Decatur, GA | 4.0 | 2.5 | 2000 | $2,061 | $1.03 | 16d | 1 | 0.82mi |
| 4225 Wingfoot Ct Decatur, GA | 2.0 | 2.0 | 1120 | $1,600 | $1.43 | 24d | 1 | 0.83mi |
| 1905 Bodwin Pl Unit 1905 Decatur, GA | 3.0 | 2.0 | 1493 | $1,600 | $1.07 | 43d | 1 | 0.83mi |
| 4565 Covington Hwy Decatur, GA | 2.0–3.0 | 1.5 | 1200 | $1,439 | $1.20 | 3d | 8 | 0.86mi |
| 2347 Greenway Dr Decatur, GA | 3.0 | 2.0 | 1200 | $1,975 | $1.65 | 24d | 1 | 0.90mi |
| 1859 Broadway St Decatur, GA | 3.0 | 2.5 | 1620 | $2,200 | $1.36 | 3d | 1 | 0.91mi |
| 2248 Emerald Springs Dr Decatur, GA | 3.0 | 2.0 | 1918 | $1,870 | $0.97 | 43d | 1 | 0.94mi |
| 4612 Grand Central Pkwy Decatur, GA | 2.0 | 2.5 | 1328 | $2,100 | $1.58 | 24d | 1 | 0.97mi |
| 4116 Snapfinger Way Decatur, GA | 4.0 | 2.0 | 1334 | $1,719 | $1.29 | 43d | 1 | 1.00mi |
Listing history 25 events
-
2026-06-18days on market $134,500 Active 95 DOM
-
2026-06-17days on market $134,500 Active 94 DOM
-
2026-06-16days on market $134,500 Active 93 DOM
-
2026-06-15days on market $134,500 Active 92 DOM
-
2026-06-13days on market $134,500 Active 90 DOM
-
2026-06-09days on market $134,500 Active 86 DOM
-
2026-06-08days on market $134,500 Active 85 DOM
-
2026-06-07days on market $134,500 Active 84 DOM
-
2026-06-04days on market $134,500 Active 81 DOM
-
2026-06-03days on market $134,500 Active 80 DOM
-
2026-06-02days on market $134,500 Active 79 DOM
-
2026-06-01days on market $134,500 Active 78 DOM
-
2026-05-31days on market $134,500 Active 77 DOM
-
2026-05-08status Back On Market 170-char remark
Show marketing remark (170 chars)
This 3-bedroom, 2-bath home features hardwood floors, a detached garage, lots of new vinyl windows, and plenty of potential. Perfect for first-time homebuyer or investor.
-
2026-05-04status Under Contract 170-char remark
Show marketing remark (170 chars)
This 3-bedroom, 2-bath home features hardwood floors, a detached garage, lots of new vinyl windows, and plenty of potential. Perfect for first-time homebuyer or investor.
-
2026-03-11$134,500 New 170-char remark
Show marketing remark (170 chars)
This 3-bedroom, 2-bath home features hardwood floors, a detached garage, lots of new vinyl windows, and plenty of potential. Perfect for first-time homebuyer or investor.
-
2025-03-31historical
-
2025-03-31historical
-
2024-12-11price $139,500
-
2024-12-08price $139,500
-
2024-12-08price $140,000
-
2024-11-26$150,000 New
-
2024-11-26$150,000 Active
-
2024-11-21soldstatus $110,000
-
1986-01-30soldstatus $57,900
ⓘ Source: listings_history table (triggers on properties + properties_extension) + one-shot
backfill from property_details.listing_events for pre-trigger history.
Tax reassessment forecast GA · Resets to sale price
- Current annual tax
- $2,435 · $203/mo
- Projected year-2 tax
- $2,435 · $203/mo
- Expected delta
- $0/yr ($0/mo · 0.0%)
ⓘ Screening estimate from a state-policy table — verify with the county assessor before closing.
Climate risk First Street
- Flood 1/10 Low FEMA zone X (unshaded) · 0% chance over 30 yrs
- Wildfire 1/10 Low
- Heat 5/10 Major 7 d/yr ≥105°F today · 17 d/yr by 30 yrs out
- Wind 5/10 Major 25% chance of damaging wind over 30 yrs
- Air quality 5/10 Major 7 unhealthy d/yr today · 10 by 30 yrs out
Nearby sold comps map
Loading sold comps map…
Walkable amenities ~0.75 mi
Loading nearby amenities…
Taxation est. · year 1
- Rental income
- $22,128
- − Mortgage interest
- −$7,534
- − Property taxes
- −$2,435
- − Insurance
- −$672
- − Repairs & maintenance
- −$1,770
- − Management
- −$1,770
- − Depreciation
- −$3,913
- Taxable income
- $4,033
- Est. tax owed @ 24.0%
- −$968
- After-tax cash flow
- $4,941/yr
For passive investors: Depreciation is non-cash, so a rental often shows a tax loss while cash-flowing — sheltering income. Rental losses are passive: they offset passive income freely, and up to $25,000/yr can offset ordinary (W-2) income if you actively participate and your MAGI is under $100k (phasing out to $0 by $150k); unused losses carry forward. On sale, claimed depreciation is recaptured at up to 25%, and gains may owe capital-gains tax (a 1031 exchange can defer both). Figures are a year-1 estimate at your 24.0% rate — not tax advice; consult a CPA.
Schools (NCES district)
- District
- Dekalb County
- NCES district ID
- 1301740
- Math proficiency
- 19% ▼ -12.00%
- Reading proficiency
- 28% ▼ -7.00%
- Median HH income
- $51,448
- Composite
- 20.92/100
- National rank
- #8482
- State rank
- #125 of 174 in GA
Livability — Candler-McAfee
No livability data for this city. (Only ~50 U.S. cities are tracked.)
Census & demographics
- County
- Dekalb County · 782,738 people
- Metro
- Atlanta-Sandy Springs-Alpharetta, GA
- Population (ZIP)
- 21,569
- Household income
- $66,799
- Rent vs Own
- Severe rent burden
- 1304.0
Population outlook (DeKalb County) Hauer SSP2
- Today (2025)
- 839,977 people
- By 2030
- 891,768 · +6.2%
- By 2040
- 988,894 · +17.7%
- By 2050
- 1,074,583 · +27.9%
- By 2075
- 1,245,026 · +48.2%
- By 2100
- 1,303,135 · +55.1%
Race, ethnicity, and origin ACS 2023
- Neighborhood character
- Predominantly Black (91%)
- Race & ethnicity
- Black 91% White 4% Hispanic / Latino 4% Two or more races 3%
- Common ancestry
- Italian 1% Swiss 0%
- Foreign-born
- 12% · Canada, Jamaica
- Languages at home
- 86% English-only · Spanish 4% French/Haitian/Cajun 2%
Political lean MEDSL · DeKalb
- 2024 margin
- Solid D (+64.8) · D 81.9% · R 17.1% · Other 1.0%
- 2008→2024 swing
- +6.1pp toward D · 2008: 58.6pp · 2024: 64.8pp
- All cycles
- 2024: D+64.8 2020: D+67.4 2016: D+64.8 2012: D+56.8 2008: D+58.6
Not yet ingested
- Civics
- —
Market trends
- HPI YoY
- ▼ -111.60%
- Current HPI
- 218.8323
- Rent YoY
- ▲ 0.87%
- Metro
- Atlanta-Sandy Springs-Alpharetta, GA
- State GDP YoY
- ▲ 2.66%
- F500 in state
- 28
Industry mix (Fortune 500 HQ in GA)
| Industry | F500 HQs | Revenue |
|---|---|---|
| Paper / Packaging | 2 | $29B |
|
||
| Retail | 1 | $160B |
|
||
| Transportation / Logistics | 1 | $91B |
|
||
| Airlines | 1 | $62B |
|
||
| Consumer Goods | 1 | $47B |
|
||
| Utilities | 1 | $25B |
|
||
Price history
+132.3% since first listed12 events — show timeline
- 2026-05-08 Relisted — GAMLS
- 2026-05-04 Pending — GAMLS
- 2026-03-11 Listed $134,500 GAMLS
- 2025-03-31 Listing Removed — FMLS
- 2025-03-31 Listing Removed — GAMLS
- 2024-12-11 Price Changed $139,500 GAMLS
- 2024-12-08 Price Changed $139,500 FMLS
- 2024-12-08 Price Changed $140,000 FMLS
- 2024-11-26 Listed $150,000 FMLS
- 2024-11-26 Listed $150,000 GAMLS
- 2024-11-21 Sold (Public Records) $110,000 Public Records
- 1986-01-30 Sold (Public Records) $57,900 Public Records
Property tax history
+4.0%/yrLatest (2025): $2,435 · -1.9% YoY. Source: county tax records.
Cash-flow waterfall
monthlySold comps — $/sqft
last 12 mo · ≤1 miLoading sold comps…