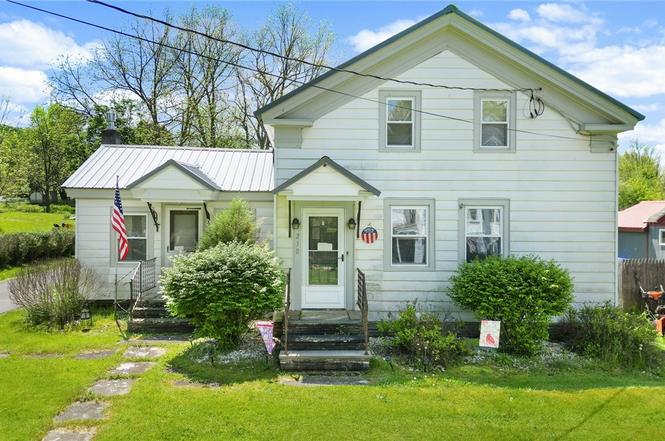
230 County Highway 20 · South Edmeston, NY
Flood risk 1/10 · Minimal
- FEMA flood zone
- X (unshaded)
- Chance of flooding over 30 yrs
- 0.0%
- Est. flood insurance / yr
- $507 – $1,088
Fire risk 3/10 · Minor
- Est. fire insurance / yr
- $691 – $1,283
Heat risk 2/10 · Minimal
- Hot days now (above 93°F)
- 8 days/yr
- Hot days in 30 yrs
- 18 days/yr
Wind risk 2/10 · Minimal
- Chance of severe wind over 30 yrs
- 1.0%
Air-quality risk 1/10 · Minimal
- Unhealthy air days now
- 0 days/yr
- Unhealthy air days in 30 yrs
- 0 days/yr
Risk factors via First Street. Map © Google.
Why this score? — see what drove the D grade
The composite is a weighted blend of 9 inputs, each scored 0–100. Each bar is that input's sub-score; the figure is the points it added to the 100-point composite (weight × sub-score).
- Cash flow +10.4/30.0
- Appreciation +10.0/10.0
- ARV discount +7.5/15.0
- 1% rule +3.8/10.0
- DSCR +3.0/10.0
- Schools +2.7/10.0
- Rent growth +2.5/5.0
- Livability +2.5/5.0
- Condition / age +2.5/5.0
$139,000
🖨 Deal sheet (PDF) 📄 Offer letter ✓ Due diligence
Listing remarks
Step into a home where memories have been made and new beginnings await. Nestled in the heart of the Town of Edmeston, this inviting 3-bedroom, 2-story home offers 1,649 sq. ft. of comfortable living space filled with charm, functionality, and opportunity to make it your own. Inside, you’ll find a flexible floor plan featuring one first-floor bedroom and two additional bedrooms upstairs, ideal for family, guests, or creating your perfect retreat. Gather around the table in the spacious dining room, unwind in the cozy living room with a BRAND NEW propane fireplace, or enjoy the versatility of a dedicated office and den. The den’s sliding doors open to a welcoming front patio&mdas
Key facts
- Two story barn
- Dedicated office
- First floor bedroom
Tags
Property features AI
Exterior
- Parking: Detached garage; Two garage spaces
- Utilities: Well water; Septic tank
- Home design: Single-story; Existing construction
- Construction: Aluminum siding; Stone foundation
- Exterior features: Blacktop driveway; Deeded river access to the Unadilla River; Propane tank (owned); Rectangular lot, 50 x 297; Main thoroughfare frontage
Interior
- Kitchen: Dishwasher; Electric oven; Electric range; Refrigerator; Eat-in kitchen
- Bedrooms: One main-level bedroom
- Flooring: Carpet; Hardwood; Vinyl; Varied flooring
- Bathrooms: One full bathroom; One half bathroom; One main-level bathroom
- Heating & cooling: Oil heating with radiators; Wall cooling units
- Interior features: Den; Separate/formal dining room; Eat-in kitchen; Home office; Bedroom on main level; Full, partially finished basement; One fireplace
- Laundry & utility: Washer; Dryer; Main-level laundry
Neighborhood map
What this means for you Summary
Snapshot
- This is a 3-bed/2.0-bath single-family listed at $139k.
Deal economics
- At list price, monthly cash flow is $-73 ($-870/yr) — negative.
- To cash-flow at today's rent, offer at most $126k (9.2% below list).
- To meet the 1% rule (rent ≥ 1% of price), the offer needs to be $122k (12.1% below list).
- Recommended offer: $122k (12.1% below list) — sets the bar for 1% rule.
Location & tenants
- Location reads: area grade D — affects rentability + tenant quality, not the cash-flow math above.
- Unadilla Valley Central School District (rural): math 26% / reading 38% proficiency, ranked #571 of 590 in NY (top 97%) — families likely to look elsewhere, expect single-tenant / working-renter base with shorter leases.
- Zoned schools: Unadilla Valley Elementary School (math 12% / reading 32%, grade F, #1,923 of 2,108 statewide, top 92%, 465 students, 27% FRL) — zoned schools average 27% FRL vs 49% district-wide (22 pts lower); this property's tenant base skews higher-income than the district average.
- Market conditions: 28 active listings in the ZIP; 133 units permitted in Otsego County in 2024 (10 in 5+ unit buildings).
Forward outlook
- In year one you build about $15k of equity ($961 loan paydown + $14k appreciation (10.0% local appreciation)).
- Otsego County population projected at -21% by 2050 — secular population decline; favor cash flow + early exit over multi-decade hold.
- At projected returns (10.0% appreciation + 3.0% rent growth), your $39k cash investment doubles in ~3 years — after that, you're playing with house money.
- By year 3, paydown + projected appreciation supports a ~$38k cash-out refi (75% LTV) — recoverable capital for the next deal without selling this one.
Negotiation context
- Only 7 days on market — expect competitive offers; lowballing is unlikely to land.
- 3 sale attempts since 4y ago with the ask held roughly flat each time — persistent listings suggest the price (not the market) is what's stuck; bring a comps-based counter.
Risks & watch-outs
- Watch-outs: built in 1835 — expect roof / HVAC / electrical / plumbing capex.
Questions for the listing agent
- What do current leases actually rent for vs. the listed asking? Can we see a recent rent roll and the last 12 months of T-12 income?
- Built in 1835 — when were the roof, HVAC, electrical panel, plumbing, and water heater last replaced?
- Is there a deadline driving the sale (1031 exchange, divorce, estate, relocation)? That informs how much negotiation room exists.
- The area grade is low — what's the realistic commute time and amenity access for the typical tenant pool here? Any planned neighborhood developments (good or bad) we should know about?
- What's the average days-on-market for RENTAL listings here right now (not sales)? A rising rental-DOM trend means longer vacancies and softer asking-rent achievability than the comps imply.
- What's the recent tenant-quality profile in this submarket — average credit score on applications, eviction rate, late-payment / NSF rate, and stable-employment percentage? A property-management company in the area should have these aggregated.
- How much new for-sale + rental construction is in the pipeline within 1–3 miles? Heavy new supply typically softens prices + rents 12–24 months out; constrained supply supports both.
Investment metrics
- 1% rule
- 0.88% ✗
- Cap rate
- 5.67%
- Cash-on-cash
- -2.24%
- DSCR
- 0.90
- GRM
- 9.5
CMA / ARV
No comps found within radius.
Projected returns pro-forma
10.0% appreciation · 3.0% rent growth · sell at horizon
- IRR
- 22.7%
- Equity multiple
- 2.83×
- Total profit
- $71,150
- Equity at exit
- $125,222
- IRR
- 20.3%
- Equity multiple
- 6.48×
- Total profit
- $213,289
- Equity at exit
- $270,046
Cash invested: $38,920 (down + closing). Projections, not guarantees.
Landlord ↔ Tenant lean methodology
- Overall (STATE)
- 15 Strongly Tenant-Friendly
- State New York
- 15 Strongly Tenant-Friendly · D+10
- County
- — inherits STATE
- City
- — inherits STATE
ZIP-level market 13411
- Home prices YoY
- 3.3%
- Active inventory
- 28
- Price-to-rent
- 9.5×
Monthly cashflow live
- Estimated rent
- $1,222 medium interval (Pro) →
- Mortgage (P&I)
- −$729
- Tax from tax record
- −$251 /mo · $3,008/yr
- Insurance
- −$58
- HOA
- −$0
- Vacancy / Maint / Mgmt
- −$257
- Net cashflow
- $-73
Break-even live
Sensitivity live
| Price | -10% $6 | -5% $-33 | +0% $-73 | +5% $-112 | +10% $-151 |
|---|---|---|---|---|---|
| Rent | -10% $-169 | -5% $-121 | +0% $-73 | +5% $-24 | +10% $24 |
| Rate | -1.0pp $-3 | -0.5pp $-37 | base $-73 | +0.5pp $-109 | +1.0pp $-145 |
UW: 25.0% down · 7.5% · 30yr · 1.5% tax · 5.0% vac · 8.0% maint · 8.0% mgmt
Financing live
Cash to close
- Down payment
- $34,750
- Closing costs
- $4,170
- Reserves months
- —
- Total cash needed
- —
Loan-product check · same deal, 3 products live
Conventional
25% down · 7.5% · 30yr
- Down + closing
- —
- Monthly P&I
- —
- Monthly cashflow
- —
- DSCR
- —
- Eligible?
- —
Personal DTI + credit; lowest rate.
DSCR
20% down · 8.5% · 30yr
- Down + closing
- —
- Monthly P&I
- —
- Monthly cashflow
- —
- DSCR
- —
- Eligible?
- —
No personal income docs; deal must DSCR.
Hard money
10% down · 12.0% · 12mo
- Down + closing
- —
- Monthly P&I
- —
- Monthly cashflow
- —
- DSCR
- —
- Eligible?
- —
Short-term bridge; refi at stabilization.
Listing history 5 events
-
2026-06-05statusdays on market $139,000 Pending 7 DOM
-
2026-06-04days on market $139,000 Active 6 DOM
-
2026-06-02days on market $139,000 Active 5 DOM
-
2026-06-01days on market $139,000 Active 4 DOM
-
2026-05-31days on market $139,000 Active 3 DOM
ⓘ Source: listings_history table (triggers on properties + properties_extension) + one-shot
backfill from property_details.listing_events for pre-trigger history.
Tax reassessment forecast NY · Partial reset (capped growth)
- Current annual tax
- $3,008 · $251/mo
- Projected year-2 tax
- $3,008 · $251/mo
- Expected delta
- $0/yr ($0/mo · 0.0%)
ⓘ Screening estimate from a state-policy table — verify with the county assessor before closing.
Climate risk First Street
- Flood 1/10 Low FEMA zone X (unshaded) · 0% chance over 30 yrs
- Wildfire 3/10 Moderate
- Heat 2/10 Low 8 d/yr ≥93°F today · 18 d/yr by 30 yrs out
- Wind 2/10 Low 100% chance of damaging wind over 30 yrs
- Air quality 1/10 Low 0 unhealthy d/yr today · 0 by 30 yrs out
Nearby sold comps map
Loading sold comps map…
Walkable amenities ~0.75 mi
Loading nearby amenities…
Taxation est. · year 1
- Rental income
- $14,658
- − Mortgage interest
- −$7,786
- − Property taxes
- −$3,008
- − Insurance
- −$695
- − Repairs & maintenance
- −$1,173
- − Management
- −$1,173
- − Depreciation
- −$4,044
- Taxable loss
- −$3,220
- Est. tax savings @ 24.0%
- +$773
- After-tax cash flow
- $-97/yr
For passive investors: Depreciation is non-cash, so a rental often shows a tax loss while cash-flowing — sheltering income. Rental losses are passive: they offset passive income freely, and up to $25,000/yr can offset ordinary (W-2) income if you actively participate and your MAGI is under $100k (phasing out to $0 by $150k); unused losses carry forward. On sale, claimed depreciation is recaptured at up to 25%, and gains may owe capital-gains tax (a 1031 exchange can defer both). Figures are a year-1 estimate at your 24.0% rate — not tax advice; consult a CPA.
Schools (NCES district)
- District
- Unadilla Valley Central School District
- NCES district ID
- 3600019
- Math proficiency
- 26% ▼ -16.00%
- Reading proficiency
- 38% ▲ 5.00%
- Median HH income
- $45,176
- Composite
- 27.35/100
- National rank
- #6985
- State rank
- #571 of 590 in NY
Livability — South Edmeston
No livability data for this city. (Only ~50 U.S. cities are tracked.)
Census & demographics
- Census place
- South Edmeston, NY
- Population (ZIP)
- 2,920
Population outlook (Otsego County) Hauer SSP2
- Today (2025)
- 57,987 people
- By 2030
- 55,403 · -4.5%
- By 2040
- 50,336 · -13.2%
- By 2050
- 45,715 · -21.2%
- By 2075
- 38,769 · -33.1%
- By 2100
- 33,468 · -42.3%
Race, ethnicity, and origin ACS 2023
- Neighborhood character
- Predominantly White (94%)
- Race & ethnicity
- White 94% Two or more races 4% Hispanic / Latino 3%
- Common ancestry
- Romanian 4% Lithuanian 3% Slovak 3%
- Foreign-born
- 1% · Canada
- Languages at home
- 95% English-only · German/W. Germanic 3% Spanish 2%
Political lean MEDSL · Otsego
- 2024 margin
- Lean R (+7.9) · D 46.1% · R 53.9%
- 2008→2024 swing
- -13.8pp toward R · 2008: 5.9pp · 2024: -7.9pp
- All cycles
- 2024: R+7.9 2020: R+5.0 2016: R+13.0 2012: D+2.0 2008: D+5.9
Not yet ingested
- Civics
- —
Market trends
- HPI YoY
- ▲ 10.20%
- Current HPI
- 323.6602
- Rent YoY
- —
- Metro
- —
- State GDP YoY
- ▲ 2.60%
- F500 in state
- 92
Industry mix (Fortune 500 HQ in NY)
| Industry | F500 HQs | Revenue |
|---|---|---|
| Financial Services | 10 | $950B |
|
||
| Consumer Goods | 9 | $162B |
|
||
| Insurance | 4 | $225B |
|
||
| Telecommunications | 2 | $144B |
|
||
| Pharmaceuticals | 2 | $112B |
|
||
| Media / Entertainment | 2 | $69B |
|
||
Price history
-0.6% since first listed6 events — show timeline
- 2026-05-28 Listed $139,000 UNYREIS
- 2024-01-16 Listing Removed — UNYREIS
- 2023-09-04 Listing Removed — UNYREIS
- 2023-08-29 Listed $130,000 UNYREIS
- 2022-06-11 Listing Removed — UNYREIS
- 2022-03-09 Listed $139,900 UNYREIS
Property tax history
+9.5%/yrLatest (2025): $3,008 · +54.4% YoY. Source: county tax records.
Cash-flow waterfall
monthlySold comps — $/sqft
last 12 mo · ≤1 miLoading sold comps…