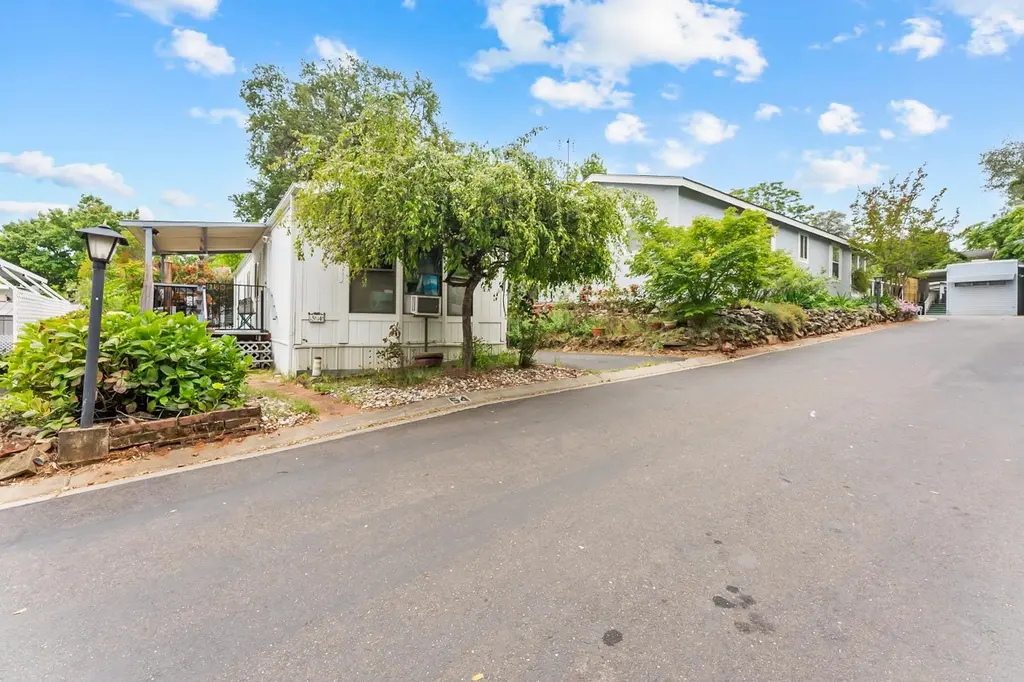
1605 Grass Valley Hwy #54 · North Auburn, CA
Flood risk 1/10 · Minimal
- FEMA flood zone
- X (unshaded)
- Chance of flooding over 30 yrs
- 0.0%
- Est. flood insurance / yr
- $507 – $1,088
Fire risk 10/10 · Severe
- Est. fire insurance / yr
- $659 – $1,223
Heat risk 6/10 · Moderate
- Hot days now (above 99°F)
- 6 days/yr
- Hot days in 30 yrs
- 14 days/yr
Wind risk 1/10 · Minimal
- Chance of severe wind over 30 yrs
- —
Air-quality risk 10/10 · Severe
- Unhealthy air days now
- 34 days/yr
- Unhealthy air days in 30 yrs
- 41 days/yr
Risk factors via First Street. Map © Google.
Why this score? — see what drove the B- grade
The composite is a weighted blend of 9 inputs, each scored 0–100. Each bar is that input's sub-score; the figure is the points it added to the 100-point composite (weight × sub-score).
- Cash flow +30.0/30.0
- 1% rule +10.0/10.0
- DSCR +10.0/10.0
- Schools +4.9/10.0
- Condition / age +3.8/5.0
- Rent growth +3.1/5.0
- Livability +3.1/5.0
- ARV discount +2.7/15.0
- Appreciation +0.0/10.0
$89,500
🖨 Deal sheet 📄 Offer letter ✓ Due diligence
Listing remarks
Welcome to easy, low-maintenance living in this charming home located in a desirable 55+ community. Light and bright throughout, this home has been thoughtfully updated with brand new flooring and all-new plumbing, offering both style and peace of mind. The open layout creates an inviting atmosphere, perfect for everyday living or entertaining. Natural light fills the space, giving it a warm and airy feel from the moment you step inside. Ideally situated just a short distance from the community clubhouse, you'll enjoy convenient access to social activities and amenities. Plus, you're just minutes from shopping, dining, and all that Auburn has to offer. Whether you're looking to downsize or
Key facts
- All new plumbing
- Community clubhouse
- New flooring
Tags
Property features AI
Finance
- Other: Located at 1605 Grass Valley Hwy #54, Auburn, CA 95603; Directions: HWY 49/Grass Valley Hwy to stoplight at Luther, turn west into Auburn Hills Mobile Home Estates; property on the left
- HOA & community: No homeowners association; Located in a senior community; Land lease not required (land lease Y/N: No) — site shows a land lease amount listed for reference
Exterior
- Parking: Covered parking for 2 vehicles
- Utilities: 220 volts available in laundry; Public sewer; Public water (water district)
- Home design: Manufactured home in park (single wide); Built in 1988
- Construction: Fleetwood Homes manufacturer; Metal skirting; Composition roof; Storage/sheds on property
- Exterior features: Covered exterior storage/shed; Close to clubhouse; Front yard; Covered deck and covered patio; Storage area
Interior
- Kitchen: Free standing refrigerator; Dishwasher; Disposal; Microwave; Free standing gas oven; Synthetic countertops; Dining space in the kitchen
- Bedrooms: Two bedrooms
- Flooring: Laminate
- Bathrooms: One full bathroom with shower stall(s)
- Heating & cooling: Central heating (natural gas); Ceiling fans and window units; multiple units
- Interior features: Free standing refrigerator, dishwasher, disposal, microwave, free standing gas oven; Laminate flooring; Bay windows with partial dual-pane; Covered deck and covered patio; Storage area (exterior storage/shed); Pets allowed (per park rules); Synthetic counter in kitchen; Family room and kitchen
- Laundry & utility: Washer and dryer included (stacked) located inside; 220V in laundry
Neighborhood map
What this means for you Summary
Snapshot
- This is a 2-bed/1.0-bath manufactured listed at $90k. Condition is rated good.
Deal economics
- At list price, monthly cash flow is $911 ($11k/yr) — positive.
- The deal already cash-flows at list — no discount required.
- Meets the 1% rule at list price ($2k rent vs $90k).
- Recommended offer: $87k (3.0% below list) — sets the bar for market timing.
- Cap rate 18.5% vs local median 2.6% in North Auburn — top-decile yield for the area; either an underpriced asset or a hidden risk that comps aren't pricing in. Stress-test before assuming the spread holds.
Location & tenants
- Location reads 61/100 on livability (#519 in CA) — a middle-class / working-renter tenant base. Strengths: employment A-, housing A-; Watch: schools F, crime D-, amenities F.
- Placer Union High (suburban): math 39% / reading 72% proficiency, ranked #98 of 517 in CA (top 19%) — acceptable for families but not a draw, mixed tenant base, ~2y average lease.
- Market conditions: Rents rising (+2.3%/yr); 204 active listings in the ZIP; 2 comparable units currently listed for rent nearby; solid renter incomes; 3,535 units permitted in Placer County in 2024 (689 in 5+ unit buildings).
Forward outlook
- Local home prices are declining (-3.0%/yr); year-one equity from $619 of loan paydown is wiped out by about $3k of value loss. Plan a longer hold.
- Placer County population projected at +20% by 2050 — long-run rental-demand tailwind backs the buy-and-hold thesis.
- At projected returns (-3.0% appreciation + 2.3% rent growth), your $25k cash investment doubles in ~3 years — after that, you're playing with house money.
Negotiation context
- It's been on market 45 days — a 3% lower offer ($87k) is reasonable based on typical stale-listing flexibility.
Risks & watch-outs
- Climate carrying-cost: severe wildfire risk; extreme-heat days projected 6→14/yr by 2055 (HVAC capex compounding) — expect insurance premiums to compound above CPI over the hold.
Questions for the listing agent
- It's been on market 45 days. Have you received any prior offers? Is the seller open to a 3% concession, seller financing, or rate buy-down credit?
- Is there a deadline driving the sale (1031 exchange, divorce, estate, relocation)? That informs how much negotiation room exists.
- Schools are F-rated, which usually means shorter tenancies and higher turnover. Who's the typical renter profile here, and what's been the actual vacancy rate?
- Crime grade is D in this area — have there been break-ins, vandalism, or insurance claims at this property in the last 3 years? What carrier currently insures it and at what premium?
- What's the average days-on-market for RENTAL listings here right now (not sales)? A rising rental-DOM trend means longer vacancies and softer asking-rent achievability than the comps imply.
- What's the recent tenant-quality profile in this submarket — average credit score on applications, eviction rate, late-payment / NSF rate, and stable-employment percentage? A property-management company in the area should have these aggregated.
- How much new for-sale + rental construction is in the pipeline within 1–3 miles? Heavy new supply typically softens prices + rents 12–24 months out; constrained supply supports both.
Investment metrics
- 1% rule
- 2.16% ✓
- Cap rate
- 18.51%
- Cash-on-cash
- 43.63%
- DSCR
- 2.94
- GRM
- 3.9
CMA / ARV
- ARV (on-the-fly)
- $80,878
- Comps found
- 8
Show comp detail 8 sales within ~0.75 mi
| Address | Dist | Beds/Ba | Sqft | Sold | Price | $/sf | Match |
|---|---|---|---|---|---|---|---|
| 12102 Hemlock Dr | 0.30mi | 2/1.0 | 720 (-3%) | 3mo | $83,000 | $115 | 79 |
| 1638 Alder Cir #1638 | 0.34mi | 2/1.0 | 684 (-8%) | 1mo | $48,000 | $70 | 70 |
| 1605 Grass Valley Hwy #99 | 0.00mi | 2/1.0 | 672 (-9%) | 22mo | $77,000 | $115 | 66 |
| 31 Larkspur Ave | 0.28mi | 2/1.0 | 688 (-7%) | 14mo | $75,000 | $109 | 63 |
| 126 Marigold Ave | 0.21mi | 2/1.0 | 800 (+8%) | 23mo | $72,000 | $90 | 58 |
| 114 Marigold Way | 0.22mi | 1/1.0 (-1) | 800 (+8%) | 19mo | $45,000 | $56 | 56 |
| 1516 Tulip Cir | 0.39mi | 2/2.0 | 800 (+8%) | 13mo | $94,330 | $118 | 54 |
| 12344 Pepperwood Cir | 0.48mi | 2/2.0 | 840 (+13%) | 16mo | $43,000 | $51 | 39 |
Match score weights: distance 35% · size 25% · config 20% · recency 20%. Top-matched comps best support the ARV.
Projected returns pro-forma
-3.0% appreciation · 2.34% rent growth · sell at horizon
- IRR
- 39.8%
- Equity multiple
- 2.69×
- Total profit
- $42,275
- Equity at exit
- $13,345
- IRR
- 45.8%
- Equity multiple
- 5.25×
- Total profit
- $106,476
- Equity at exit
- $7,738
Cash invested: $25,060 (down + closing). Projections, not guarantees.
Landlord ↔ Tenant lean methodology
- Overall (STATE)
- 18 Strongly Tenant-Friendly
- State California
- 18 Strongly Tenant-Friendly · D+13
- County
- — inherits STATE
- City
- — inherits STATE
ZIP-level market 95603
- Rents YoY
- 2.3%
- Active inventory
- 204
- Price-to-rent
- 3.9×
Monthly cashflow live
- Estimated rent
- $1,936 medium interval (Pro) →
- Mortgage (P&I)
- −$469
- Tax est. 1.5%
- −$112 /mo · $1,342/yr
- Insurance
- −$37
- HOA
- −$0
- Vacancy / Maint / Mgmt
- −$407
- Net cashflow
- $911
Break-even live
UW: 25.0% down · 7.5% · 30yr · 1.5% tax · 5.0% vac · 8.0% maint · 8.0% mgmt
Financing live
Cash to close
- Down payment
- $22,375
- Closing costs
- $2,685
- Reserves months
- —
- Total cash needed
- —
Loan-product check · same deal, 3 products live
Conventional
25% down · 7.5% · 30yr
- Down + closing
- —
- Monthly P&I
- —
- Monthly cashflow
- —
- DSCR
- —
- Eligible?
- —
Personal DTI + credit; lowest rate.
DSCR
20% down · 8.5% · 30yr
- Down + closing
- —
- Monthly P&I
- —
- Monthly cashflow
- —
- DSCR
- —
- Eligible?
- —
No personal income docs; deal must DSCR.
Hard money
10% down · 12.0% · 12mo
- Down + closing
- —
- Monthly P&I
- —
- Monthly cashflow
- —
- DSCR
- —
- Eligible?
- —
Short-term bridge; refi at stabilization.
Rent comps 2 comps
| Address | Beds | Baths | Sqft | Rent | $/sqft | DOM | Units | Dist |
|---|---|---|---|---|---|---|---|---|
| 11754 Jones St Unit 11754 Auburn, CA | 1.0 | 1.0 | 700 | $1,595 | $2.28 | 3d | 1 | 0.81mi |
| 750 Auburn Ravine Rd Auburn, CA | 1.0 | 1.0 | 540 | $1,901 | $3.52 | 1d | 4 | 1.23mi |
Listing history 13 events
-
2026-06-18days on market $89,500 Active 45 DOM
-
2026-06-17pricedays on market $89,500 Active 44 DOM
-
2026-06-16days on market $91,500 Active 43 DOM
-
2026-06-15days on market $91,500 Active 42 DOM
-
2026-06-13days on market $91,500 Active 40 DOM
-
2026-06-13days on market $91,500 Active 39 DOM
-
2026-06-09days on market $91,500 Active 36 DOM
-
2026-06-08days on market $91,500 Active 35 DOM
-
2026-06-07pricedays on market $91,500 Active 34 DOM
-
2026-06-03days on market $94,500 Active 30 DOM
-
2026-06-02days on market $94,500 Active 29 DOM
-
2026-06-01days on market $94,500 Active 28 DOM
-
2026-05-31days on market $94,500 Active 27 DOM
ⓘ Source: listings_history table (triggers on properties + properties_extension) + one-shot
backfill from property_details.listing_events for pre-trigger history.
Climate risk First Street
- Flood 1/10 Low FEMA zone X (unshaded) · 0% chance over 30 yrs
- Wildfire 10/10 Extreme
- Heat 6/10 Major 6 d/yr ≥99°F today · 14 d/yr by 30 yrs out
- Wind 1/10 Low
- Air quality 10/10 Extreme 34 unhealthy d/yr today · 41 by 30 yrs out
Nearby sold comps map
Loading sold comps map…
Walkable amenities ~0.75 mi
Loading nearby amenities…
Taxation est. · year 1
- Rental income
- $23,234
- − Mortgage interest
- −$5,013
- − Property taxes
- −$1,342
- − Insurance
- −$448
- − Repairs & maintenance
- −$1,859
- − Management
- −$1,859
- − Depreciation
- −$2,604
- Taxable income
- $10,110
- Est. tax owed @ 24.0%
- −$2,426
- After-tax cash flow
- $8,506/yr
For passive investors: Depreciation is non-cash, so a rental often shows a tax loss while cash-flowing — sheltering income. Rental losses are passive: they offset passive income freely, and up to $25,000/yr can offset ordinary (W-2) income if you actively participate and your MAGI is under $100k (phasing out to $0 by $150k); unused losses carry forward. On sale, claimed depreciation is recaptured at up to 25%, and gains may owe capital-gains tax (a 1031 exchange can defer both). Figures are a year-1 estimate at your 24.0% rate — not tax advice; consult a CPA.
Condition & rehab AI · 12 photos
This charming mobile home is in good condition with recent updates, making it move-in ready and suitable for both resale and rental.
Value-add opportunities
- Both painting exterior — enhances curb appeal and value
- Both landscaping — improves curb appeal and value
- Both replacing worn-out flooring — increases both resale and rental value
Renovation cost estimate screening
Value-add ROI direction
- Both painting exterior — enhances curb appeal and value ↑
- Both landscaping — improves curb appeal and value ↑
- Both replacing worn-out flooring — increases both resale and rental value ↑
ⓘ Cost ranges are severity-bucket heuristics (US national rule-of-thumb). Get contractor quotes + a written scope before underwriting a rehab budget.
Schools (NCES district)
- District
- Placer Union High
- NCES district ID
- 0630750
- Math proficiency
- 39% ▲ 1.00%
- Reading proficiency
- 72% ▲ 3.00%
- Median HH income
- $69,119
- Composite
- 49.04/100
- National rank
- #2060
- State rank
- #98 of 517 in CA
Livability — North Auburn
- Score
- 61/100
- State rank
- #519
- US rank
- #17512
Category grades
Schools grade is shown separately in the Schools card above.
Census & demographics
- Census place
- North Auburn, CA
- County
- Placer County · 390,510 people
- City population
- 28,195
- Metro
- Sacramento-Roseville-Folsom, CA
- Population (ZIP)
- 28,432
- Household income
- $85,357
- Rent vs Own
- Severe rent burden
- 1017.0
Population outlook (Placer County) Hauer SSP2
- Today (2025)
- 422,709 people
- By 2030
- 444,249 · +5.1%
- By 2040
- 480,192 · +13.6%
- By 2050
- 506,390 · +19.8%
- By 2075
- 550,219 · +30.2%
- By 2100
- 547,760 · +29.6%
Race, ethnicity, and origin ACS 2023
- Neighborhood character
- Predominantly White (73%)
- Race & ethnicity
- White 73% Hispanic / Latino 17% Two or more races 11% Asian 3%
- Hispanic origin (detail)
- Mexican 12%
- Common ancestry
- Italian 3% Slovak 3% Lithuanian 2%
- Foreign-born
- 9% · Canada, South Korea
- Languages at home
- 88% English-only · Spanish 10% Other Indo-European 1% Tagalog/Filipino 1%
Political lean MEDSL · Placer
- 2024 margin
- Lean R (+8.5) · D 44.3% · R 52.8% · Other 2.9%
- 2008→2024 swing
- +2.8pp toward D · 2008: -11.3pp · 2024: -8.5pp
- All cycles
- 2024: R+8.5 2020: R+6.7 2016: R+11.3 2012: R+20.1 2008: R+11.3
Not yet ingested
- Civics
- —
Market trends
- HPI YoY
- ▼ -500.89%
- Current HPI
- 251.4573
- Rent YoY
- ▲ 2.34%
- Metro
- Sacramento-Roseville-Folsom, CA
- State GDP YoY
- ▲ 3.21%
- F500 in state
- 116
Industry mix (Fortune 500 HQ in CA)
| Industry | F500 HQs | Revenue |
|---|---|---|
| Technology | 27 | $1,492B |
|
||
| Financial Services | 3 | $174B |
|
||
| Retail | 3 | $44B |
|
||
| Insurance | 3 | $26B |
|
||
| Media / Entertainment | 2 | $115B |
|
||
| Pharmaceuticals / Biotech | 2 | $62B |
|
||
Cash-flow waterfall
monthlySold comps — $/sqft
last 12 mo · ≤1 miLoading sold comps…