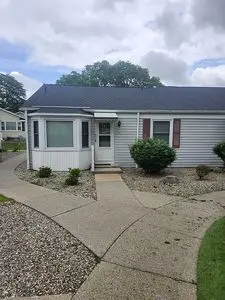
1041 Village Ln · Georgetown, MI
Flood risk 6/10 · Moderate
- FEMA flood zone
- X (shaded)
- Chance of flooding over 30 yrs
- 0.72%
- Est. flood insurance / yr
- $473 – $860
Fire risk 1/10 · Minimal
- Est. fire insurance / yr
- $784 – $1,456
Heat risk 3/10 · Minor
- Hot days now (above 96°F)
- 7 days/yr
- Hot days in 30 yrs
- 16 days/yr
Wind risk 2/10 · Minimal
- Chance of severe wind over 30 yrs
- —
Air-quality risk 3/10 · Minor
- Unhealthy air days now
- 3 days/yr
- Unhealthy air days in 30 yrs
- 4 days/yr
Risk factors via First Street. Map © Google.
Why this score? — see what drove the C+ grade
The composite is a weighted blend of 9 inputs, each scored 0–100. Each bar is that input's sub-score; the figure is the points it added to the 100-point composite (weight × sub-score).
- Cash flow +25.7/30.0
- DSCR +8.6/10.0
- ARV discount +7.5/15.0
- 1% rule +6.8/10.0
- Schools +5.3/10.0
- Rent growth +2.5/5.0
- Livability +2.5/5.0
- Condition / age +2.5/5.0
- Appreciation +0.0/10.0
$195,000
🖨 Deal sheet 📄 Offer letter ✓ Due diligence
Listing remarks MLS
Looking for a condo in a 55+ community? You will want to see this affordable condo in Jenison. HOA fee includes heat and basic cable. You only have to pay for electric and internet. Ranch style condo with all rooms on the main floor. Seller has installed a walk in/barrier free shower. Fresh paint in some areas of the condo. The front door and sliding door are going to be replaced at no cost to next owner of the condo. There is also a screened porch to enjoy the outdoors without the bugs! Condo comes with a garage as well as a storage room. Seller is leaving the armoire in the bedroom.
Key facts
- Screened in porch
- Newer water heater
- Newer refrigerator
Tags
Property features AI
Exterior
- Home design: Built in 1978
- Construction: Living area approximately 898
- Exterior features: Located in the Maplewood subdivision
Neighborhood map
What this means for you Summary
Snapshot
- This is a 2-bed/1.0-bath condo listed at $195k.
Deal economics
- At list price, monthly cash flow is $465 ($6k/yr) — positive.
- The deal already cash-flows at list — no discount required.
- Meets the 1% rule at list price ($2k rent vs $195k).
Location & tenants
- Location reads: area grade C — affects rentability + tenant quality, not the cash-flow math above.
- Jenison Public Schools (suburban): math 57% / reading 66% proficiency, ranked #36 of 540 in MI (top 7%) — acceptable for families but not a draw, mixed tenant base, ~2y average lease; only 20% free/reduced lunch — higher-income household profile.
- Market conditions: 142 active listings in the ZIP; 1 comparable units currently listed for rent nearby; 1,237 units permitted in Ottawa County in 2024 (443 in 5+ unit buildings).
Forward outlook
- Local home prices are declining (-3.0%/yr); year-one equity from $1k of loan paydown is wiped out by about $6k of value loss. Plan a longer hold.
- Ottawa County population projected at +24% by 2050 — long-run rental-demand tailwind backs the buy-and-hold thesis.
Negotiation context
- Only 6 days on market — expect competitive offers; lowballing is unlikely to land.
- 8 sale attempts since 21y ago with the ask held roughly flat each time — persistent listings suggest the price (not the market) is what's stuck; bring a comps-based counter.
- Current owner paid $155k; 26% above their basis — modest negotiation headroom, anchor on the comps not their cost.
Risks & watch-outs
- Climate carrying-cost: major flood risk — expect insurance premiums to compound above CPI over the hold.
Questions for the listing agent
- Built in 1978 — when were the roof, HVAC, electrical panel, plumbing, and water heater last replaced?
- Any open or pending special assessments — roof, HVAC, plumbing, elevator, façade? What's the per-unit balance and payoff schedule, and is the seller paying it off at close or rolling it to the buyer?
- Is there a deadline driving the sale (1031 exchange, divorce, estate, relocation)? That informs how much negotiation room exists.
- What's the average days-on-market for RENTAL listings here right now (not sales)? A rising rental-DOM trend means longer vacancies and softer asking-rent achievability than the comps imply.
- What's the recent tenant-quality profile in this submarket — average credit score on applications, eviction rate, late-payment / NSF rate, and stable-employment percentage? A property-management company in the area should have these aggregated.
- How much new apartment / multifamily construction is in the pipeline within 1–3 miles? Heavy new supply (>2% of stock underway) typically softens rents 12–24 months out; light construction supports rent growth.
Investment metrics
- 1% rule
- 1.18% ✓
- Cap rate
- 9.16%
- Cash-on-cash
- 10.23%
- DSCR
- 1.46
- GRM
- 7.1
CMA / ARV
No comps found within radius.
Projected returns pro-forma
-3.0% appreciation · 3.0% rent growth · sell at horizon
- IRR
- -0.9%
- Equity multiple
- 0.96×
- Total profit
- $-1,919
- Equity at exit
- $29,075
- IRR
- 8.8%
- Equity multiple
- 1.67×
- Total profit
- $36,642
- Equity at exit
- $16,860
Cash invested: $54,600 (down + closing). Projections, not guarantees.
Landlord ↔ Tenant lean methodology
- Overall (STATE)
- 62 Landlord-Friendly
- State Michigan
- 62 Landlord-Friendly · EVEN
- County
- — inherits STATE
- City
- — inherits STATE
ZIP-level market 49428
- Active inventory
- 142
- Price-to-rent
- 7.1×
Monthly cashflow live
- Estimated rent
- $2,295 medium interval (Pro) →
- Mortgage (P&I)
- −$1,023
- Tax est. 1.5%
- −$244 /mo · $2,925/yr
- Insurance
- −$81
- HOA
- −$0
- Vacancy / Maint / Mgmt
- −$482
- Net cashflow
- $465
Break-even live
UW: 25.0% down · 7.5% · 30yr · 1.5% tax · 5.0% vac · 8.0% maint · 8.0% mgmt
Financing live
Cash to close
- Down payment
- $48,750
- Closing costs
- $5,850
- Reserves months
- —
- Total cash needed
- —
Loan-product check · same deal, 3 products live
Conventional
25% down · 7.5% · 30yr
- Down + closing
- —
- Monthly P&I
- —
- Monthly cashflow
- —
- DSCR
- —
- Eligible?
- —
Personal DTI + credit; lowest rate.
DSCR
20% down · 8.5% · 30yr
- Down + closing
- —
- Monthly P&I
- —
- Monthly cashflow
- —
- DSCR
- —
- Eligible?
- —
No personal income docs; deal must DSCR.
Hard money
10% down · 12.0% · 12mo
- Down + closing
- —
- Monthly P&I
- —
- Monthly cashflow
- —
- DSCR
- —
- Eligible?
- —
Short-term bridge; refi at stabilization.
Rent comps 1 comps
| Address | Beds | Baths | Sqft | Rent | $/sqft | DOM | Units | Dist |
|---|---|---|---|---|---|---|---|---|
| 7202 Melody Ln Jenison, MI | 3.0 | 1.0 | 1002 | $2,295 | $2.29 | 2d | 1 | 0.80mi |
HOA detail condo
- Monthly dues
- $0 · $0/yr
- Likely covers
- electricinternetcable
- Assessments
- None detected in remarks — confirm with the listing agent.
Listing history 6 events
-
2026-06-18days on market $195,000 Active 6 DOM
-
2026-06-17days on market $195,000 Active 5 DOM
-
2026-06-16days on market $195,000 Active 4 DOM
-
2026-06-15days on market $195,000 Active 3 DOM
-
2026-06-13remarks 684-char remark
-
2026-06-13$195,000 Active 1 DOM
ⓘ Source: listings_history table (triggers on properties + properties_extension) + one-shot
backfill from property_details.listing_events for pre-trigger history.
Climate risk First Street
- Flood 6/10 Major FEMA zone X (shaded) · 72% chance over 30 yrs
- Wildfire 1/10 Low
- Heat 3/10 Moderate 7 d/yr ≥96°F today · 16 d/yr by 30 yrs out
- Wind 2/10 Low
- Air quality 3/10 Moderate 3 unhealthy d/yr today · 4 by 30 yrs out
Nearby sold comps map
Loading sold comps map…
Walkable amenities ~0.75 mi
Loading nearby amenities…
Taxation est. · year 1
- Rental income
- $27,540
- − Mortgage interest
- −$10,923
- − Property taxes
- −$2,925
- − Insurance
- −$975
- − Repairs & maintenance
- −$2,203
- − Management
- −$2,203
- − Depreciation
- −$5,673
- Taxable income
- $2,638
- Est. tax owed @ 24.0%
- −$633
- After-tax cash flow
- $4,952/yr
For passive investors: Depreciation is non-cash, so a rental often shows a tax loss while cash-flowing — sheltering income. Rental losses are passive: they offset passive income freely, and up to $25,000/yr can offset ordinary (W-2) income if you actively participate and your MAGI is under $100k (phasing out to $0 by $150k); unused losses carry forward. On sale, claimed depreciation is recaptured at up to 25%, and gains may owe capital-gains tax (a 1031 exchange can defer both). Figures are a year-1 estimate at your 24.0% rate — not tax advice; consult a CPA.
Schools (NCES district)
- District
- Jenison Public Schools
- NCES district ID
- 2619830
- Math proficiency
- 57% ▼ -3.00%
- Reading proficiency
- 66% ▼ -3.00%
- Median HH income
- $58,030
- Composite
- 53.06/100
- National rank
- #1517
- State rank
- #36 of 540 in MI
Livability — Georgetown
No livability data for this city. (Only ~50 U.S. cities are tracked.)
Census & demographics
- Census place
- Jenison, MI
- Population (ZIP)
- 28,090
Population outlook (Ottawa County) Hauer SSP2
- Today (2025)
- 313,561 people
- By 2030
- 330,027 · +5.3%
- By 2040
- 361,118 · +15.2%
- By 2050
- 388,414 · +23.9%
- By 2075
- 452,175 · +44.2%
- By 2100
- 473,041 · +50.9%
Race, ethnicity, and origin ACS 2023
- Neighborhood character
- Predominantly White (91%)
- Race & ethnicity
- White 91% Hispanic / Latino 4% Two or more races 3% Asian 1%
- Common ancestry
- Iranian 37% Romanian 8% Lithuanian 3%
- Foreign-born
- 2% · Canada, China, South Korea
- Languages at home
- 97% English-only · Spanish 2%
Political lean MEDSL · Ottawa
- 2024 margin
- Strong R (+20.4) · D 39.0% · R 59.5% · Other 1.5%
- 2008→2024 swing
- +3.4pp toward D · 2008: -23.9pp · 2024: -20.4pp
- All cycles
- 2024: R+20.4 2020: R+21.5 2016: R+30.4 2012: R+34.2 2008: R+23.9
Not yet ingested
- Civics
- —
Market trends
- HPI YoY
- ▼ -234.19%
- Current HPI
- 264.7304
- Rent YoY
- —
- Metro
- —
- State GDP YoY
- ▲ 1.37%
- F500 in state
- 28
Industry mix (Fortune 500 HQ in MI)
| Industry | F500 HQs | Revenue |
|---|---|---|
| Automotive Parts | 3 | $48B |
|
||
| Automotive | 2 | $372B |
|
||
| Chemicals | 1 | $45B |
|
||
| Automotive Retail | 1 | $29B |
|
||
| Healthcare / Medical Devices | 1 | $23B |
|
||
| Automotive Technology | 1 | $20B |
|
||
Price history
+179.0% since first listed21 events — show timeline
- 2026-06-12 Listed $195,000 FSBO.com
- 2023-05-12 Sold (MLS) $155,000 MiRealSource-MiMLS
- 2023-05-12 Sold (MLS) $155,000 SW Michigan MLS
- 2023-05-12 Sold (MLS) $155,000 REALCOMP
- 2023-04-29 Pending — REALCOMP
- 2023-04-29 Pending — MiRealSource-MiMLS
- 2023-04-29 Pending — SW Michigan MLS
- 2023-04-25 Price Changed $155,000 MiRealSource-MiMLS
- 2023-04-25 Price Changed $155,000 REALCOMP
- 2023-04-25 Price Changed $155,000 SW Michigan MLS
- 2023-04-15 Listed $160,000 MiRealSource-MiMLS
- 2023-04-15 Listed $160,000 SW Michigan MLS
- 2023-04-15 Listed $160,000 REALCOMP
- 2012-08-24 Sold (MLS) $51,000 REALCOMP
- 2012-08-24 Sold (MLS) $51,000 SW Michigan MLS
- 2012-05-02 Listed $56,000 REALCOMP
- 2012-05-02 Listed $56,000 SW Michigan MLS
- 2006-03-25 Sold (MLS) $64,900 REALCOMP
- 2006-03-25 Sold (MLS) $64,900 SW Michigan MLS
- 2005-11-23 Listed $69,900 REALCOMP
- 2005-11-23 Listed $69,900 SW Michigan MLS
Cash-flow waterfall
monthlySold comps — $/sqft
last 12 mo · ≤1 miLoading sold comps…