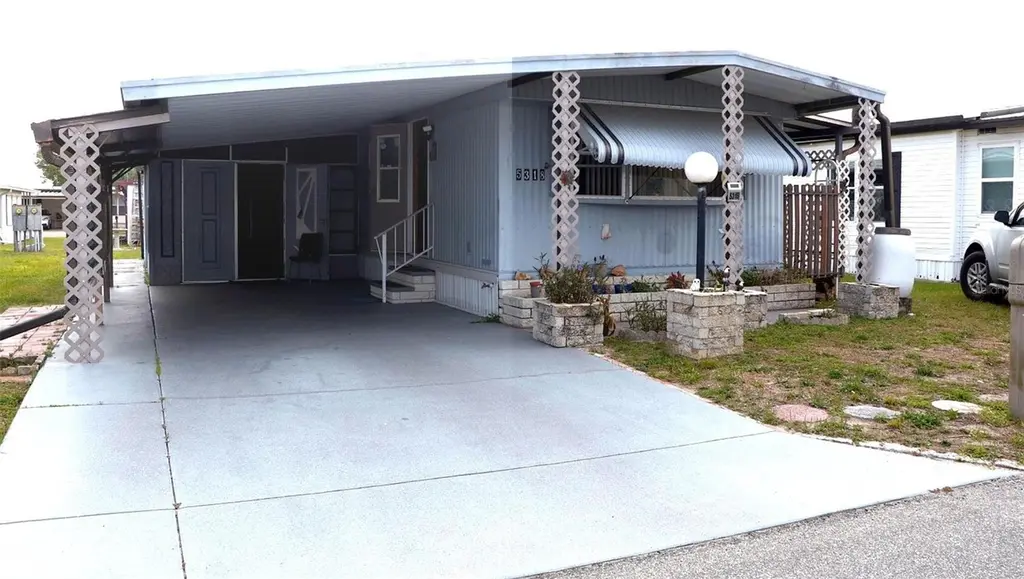
5318 Astrid Dr · Zephyrhills West, FL
Flood risk 1/10 · Minimal
- FEMA flood zone
- X (unshaded)
- Chance of flooding over 30 yrs
- 0.0%
- Est. flood insurance / yr
- $507 – $1,088
Fire risk 4/10 · Minor
- Est. fire insurance / yr
- $947 – $1,759
Heat risk 9/10 · Severe
- Hot days now (above 108°F)
- 7 days/yr
- Hot days in 30 yrs
- 24 days/yr
Wind risk 9/10 · Severe
- Chance of severe wind over 30 yrs
- 99.0%
Air-quality risk 2/10 · Minimal
- Unhealthy air days now
- 1 days/yr
- Unhealthy air days in 30 yrs
- 2 days/yr
Risk factors via First Street. Map © Google.
Why this score? — see what drove the B- grade
The composite is a weighted blend of 9 inputs, each scored 0–100. Each bar is that input's sub-score; the figure is the points it added to the 100-point composite (weight × sub-score).
- Cash flow +30.0/30.0
- 1% rule +10.0/10.0
- DSCR +10.0/10.0
- ARV discount +5.9/15.0
- Schools +4.3/10.0
- Livability +3.1/5.0
- Condition / age +2.5/5.0
- Rent growth +1.9/5.0
- Appreciation +0.0/10.0
$89,000
🖨 Deal sheet 📄 Offer letter ✓ Due diligence
Listing remarks
Welcome to 5318 Astrid Drive, located in the desirable Oaks Royal 55+ community in Zephyrhills, FL. This well-maintained 2-bedroom home offers comfortable, easy Florida living with a functional layout and inviting living spaces. The home features fresh interior paint, a newer roof (2024), and a newer AC system, providing peace of mind for years to come. The bright eat-in kitchen offers plenty of space for everyday living and flows seamlessly into the main living area, creating an open and welcoming feel. Durable laminate flooring runs through the main areas, while both bedrooms provide comfortable space and privacy, with the primary suite positioned toward the rear of the home. Just off the
Key facts
- Shuffleboard courts
- Clubhouse
- Pool
Tags
Property features AI
Finance
- Other: Total living area reported as 672 square feet (public records); Building area reported as 1,500 square feet (public records)
- HOA & community: Has HOA (annual fee $450 / $37.50 monthly); Association amenities include clubhouse, pool, shuffleboard court; Senior community; Pets allowed
Exterior
- Parking: Carport (1 space)
- Utilities: Public water; Public sewer; Electricity connected; Cable available; Water connected; Sewer connected
- Home design: Manufactured home (single wide); One story; Faces west; Residential property
- Construction: Metal siding; Membrane roof; Crawlspace foundation; Built on a 0.09-acre lot
- Exterior features: Awning(s); Rain barrel/cistern; Rain gutters; Asphalt road access
Interior
- Kitchen: Convection oven; Range hood; Refrigerator
- Bedrooms: 2 bedrooms
- Flooring: Carpet; Laminate; Tile
- Bathrooms: 1 full bathroom
- Heating & cooling: Electric heating; Central air conditioning
- Interior features: Ceiling fans; Eat-in kitchen; Kitchen/family room combo
- Laundry & utility: Washer; Dryer; Laundry room (in garage)
Neighborhood map
What this means for you Summary
Snapshot
- This is a 2-bed/2.0-bath manufactured listed at $89k.
Deal economics
- At list price, monthly cash flow is $778 ($9k/yr) — positive.
- The deal already cash-flows at list — no discount required.
- Meets the 1% rule at list price ($2k rent vs $89k).
- Recommended offer: $86k (3.0% below list) — sets the bar for market timing.
- Cap rate 16.8% vs local median 7.8% in Zephyrhills West — top-decile yield for the area; either an underpriced asset or a hidden risk that comps aren't pricing in. Stress-test before assuming the spread holds.
Location & tenants
- Location reads 61/100 on livability (#772 in FL) — a middle-class / working-renter tenant base. Strengths: cost of living A+, housing A+; Watch: schools D-, amenities F, commute F.
- Pasco (suburban): math 50% / reading 52% proficiency, ranked #32 of 73 in FL (top 44%) — acceptable for families but not a draw, mixed tenant base, ~2y average lease.
- Market conditions: Rents soft (-2.5%/yr); 856 active listings in the ZIP; 2 comparable units currently listed for rent nearby; 6,765 units permitted in Pasco County in 2024 (1,250 in 5+ unit buildings).
- This rent runs 40% of the median local income ($57k/yr) — at the standard rent-burdened threshold; future hikes will face affordability resistance.
Forward outlook
- Local home prices are declining (-3.0%/yr); year-one equity from $615 of loan paydown is wiped out by about $3k of value loss. Plan a longer hold.
- Pasco County population projected at +29% by 2050 — long-run rental-demand tailwind backs the buy-and-hold thesis.
- At projected returns (-3.0% appreciation + 0.0% rent growth), your $25k cash investment doubles in ~4 years — after that, you're playing with house money.
Negotiation context
- It's been on market 56 days — a 3% lower offer ($86k) is reasonable based on typical stale-listing flexibility.
- 3 sale attempts since 2y ago with the ask held roughly flat each time — persistent listings suggest the price (not the market) is what's stuck; bring a comps-based counter.
- Current owner paid $25k; list at $89k implies a 256% gain — meaningful room to come down on a strong offer.
Risks & watch-outs
- Climate carrying-cost: severe wind risk, 99% chance of damaging wind over 30y; extreme-heat days projected 7→24/yr by 2055 (HVAC capex compounding) — expect insurance premiums to compound above CPI over the hold.
Questions for the listing agent
- It's been on market 56 days. Have you received any prior offers? Is the seller open to a 3% concession, seller financing, or rate buy-down credit?
- What does the HOA fee cover, when was the last increase, and are there any pending special assessments or reserve-fund shortfalls?
- Is there a deadline driving the sale (1031 exchange, divorce, estate, relocation)? That informs how much negotiation room exists.
- Schools are D-rated, which usually means shorter tenancies and higher turnover. Who's the typical renter profile here, and what's been the actual vacancy rate?
- What's the average days-on-market for RENTAL listings here right now (not sales)? A rising rental-DOM trend means longer vacancies and softer asking-rent achievability than the comps imply.
- What's the recent tenant-quality profile in this submarket — average credit score on applications, eviction rate, late-payment / NSF rate, and stable-employment percentage? A property-management company in the area should have these aggregated.
- How much new for-sale + rental construction is in the pipeline within 1–3 miles? Heavy new supply typically softens prices + rents 12–24 months out; constrained supply supports both.
Investment metrics
- 1% rule
- 2.10% ✓
- Cap rate
- 16.78%
- Cash-on-cash
- 37.47%
- DSCR
- 2.67
- GRM
- 4.0
CMA / ARV
- ARV (on-the-fly)
- $86,016
- Comps found
- 12
Show comp detail 12 sales within ~0.75 mi
| Address | Dist | Beds/Ba | Sqft | Sold | Price | $/sf | Match |
|---|---|---|---|---|---|---|---|
| 5313 Aurora Dr | 0.02mi | 2/1.5 | 672 (0%) | 4mo | $66,000 | $98 | 94 |
| 36416 Cordova Cir | 0.12mi | 2/1.0 | 672 (0%) | 1mo | $60,000 | $89 | 89 |
| 5400 Amanda St | 0.61mi | 2/1.0 | 672 (0%) | 8mo | $105,000 | $156 | 61 |
| 37113 Lois Ave | 0.74mi | 2/1.0 | 672 (0%) | 3mo | $75,000 | $112 | 59 |
| 37112 Sandra Ave | 0.73mi | 2/1.5 | 664 (-1%) | 8mo | $70,000 | $105 | 55 |
| 37031 Karen Ave | 0.66mi | 2/1.5 | 720 (+7%) | 1mo | $92,000 | $128 | 54 |
| 36312 Toranado Way | 0.21mi | 2/1.5 | 768 (+14%) | 12mo | $120,000 | $156 | 54 |
| 37020 Lois Ave | 0.64mi | 2/1.0 | 624 (-7%) | 2mo | $73,000 | $117 | 52 |
| 36029 Aster Ave | 0.38mi | 2/2.0 | 768 (+14%) | 13mo | $100,000 | $130 | 47 |
| 37042 Lois Ave | 0.68mi | 2/2.0 | 748 (+11%) | 8mo | $95,000 | $127 | 43 |
| 37105 Lois Ave | 0.72mi | 2/1.0 | 744 (+11%) | 12mo | $96,000 | $129 | 35 |
| 5318 Mary St | 0.69mi | 2/1.5 | 768 (+14%) | 12mo | $119,000 | $155 | 32 |
Match score weights: distance 35% · size 25% · config 20% · recency 20%. Top-matched comps best support the ARV.
Projected returns pro-forma
-3.0% appreciation · 0.0% rent growth · sell at horizon
- IRR
- 29.8%
- Equity multiple
- 2.19×
- Total profit
- $29,751
- Equity at exit
- $13,270
- IRR
- 35.3%
- Equity multiple
- 3.77×
- Total profit
- $68,917
- Equity at exit
- $7,695
Cash invested: $24,920 (down + closing). Projections, not guarantees.
Landlord ↔ Tenant lean methodology
- Overall (STATE)
- 87 Strongly Landlord-Friendly
- State Florida
- 87 Strongly Landlord-Friendly · R+3
- County
- — inherits STATE
- City
- — inherits STATE
ZIP-level market 33541
- Home prices YoY
- -15.2%
- Rents YoY
- -2.5%
- Active inventory
- 856
- Price-to-rent
- 4.0×
Monthly cashflow live
- Estimated rent
- $1,865 medium interval (Pro) →
- Mortgage (P&I)
- −$467
- Tax from tax record
- −$154 /mo · $1,852/yr
- Insurance
- −$37
- HOA
- −$37
- Vacancy / Maint / Mgmt
- −$392
- Net cashflow
- $778
Break-even live
UW: 25.0% down · 7.5% · 30yr · 1.5% tax · 5.0% vac · 8.0% maint · 8.0% mgmt
Financing live
Cash to close
- Down payment
- $22,250
- Closing costs
- $2,670
- Reserves months
- —
- Total cash needed
- —
Loan-product check · same deal, 3 products live
Conventional
25% down · 7.5% · 30yr
- Down + closing
- —
- Monthly P&I
- —
- Monthly cashflow
- —
- DSCR
- —
- Eligible?
- —
Personal DTI + credit; lowest rate.
DSCR
20% down · 8.5% · 30yr
- Down + closing
- —
- Monthly P&I
- —
- Monthly cashflow
- —
- DSCR
- —
- Eligible?
- —
No personal income docs; deal must DSCR.
Hard money
10% down · 12.0% · 12mo
- Down + closing
- —
- Monthly P&I
- —
- Monthly cashflow
- —
- DSCR
- —
- Eligible?
- —
Short-term bridge; refi at stabilization.
Rent comps 2 comps
| Address | Beds | Baths | Sqft | Rent | $/sqft | DOM | Units | Dist |
|---|---|---|---|---|---|---|---|---|
| 5168 Crooked Ln Zephyrhills, FL | 2.0 | 1.0 | 600 | $1,645 | $2.74 | 22d | 1 | 0.60mi |
| 6302 Abbott Station Dr Zephyrhills, FL | 3.0 | 1.0–2.5 | 855 | $1,732 | $2.02 | 2d | 142 | 1.33mi |
HOA detail
- Monthly dues
- $37 · $444/yr
Listing history 21 events
-
2026-06-18days on market $89,000 Active 56 DOM
-
2026-06-17days on market $89,000 Active 55 DOM
-
2026-06-16days on market $89,000 Active 54 DOM
-
2026-06-15days on market $89,000 Active 53 DOM
-
2026-06-13days on market $89,000 Active 51 DOM
-
2026-06-09days on market $89,000 Active 47 DOM
-
2026-06-08days on market $89,000 Active 46 DOM
-
2026-06-07days on market $89,000 Active 45 DOM
-
2026-06-04days on market $89,000 Active 42 DOM
-
2026-06-03days on market $89,000 Active 41 DOM
-
2026-06-02days on market $89,000 Active 40 DOM
-
2026-06-01days on market $89,000 Active 39 DOM
-
2026-05-31days on market $89,000 Active 38 DOM
-
2026-04-23$89,000 Active
-
2026-04-23historical
-
2026-04-09$89,000 Active
-
2025-04-02historical
-
2025-03-07price $109,000
-
2025-02-06price $128,000
-
2024-12-27$135,000 Active
-
1995-12-29soldstatus $25,000
ⓘ Source: listings_history table (triggers on properties + properties_extension) + one-shot
backfill from property_details.listing_events for pre-trigger history.
Tax reassessment forecast FL · Resets to sale price
- Current annual tax
- $1,852 · $154/mo
- Projected year-2 tax
- $1,852 · $154/mo
- Expected delta
- $0/yr ($0/mo · 0.0%)
ⓘ Screening estimate from a state-policy table — verify with the county assessor before closing.
Climate risk First Street
- Flood 1/10 Low FEMA zone X (unshaded) · 0% chance over 30 yrs
- Wildfire 4/10 Moderate
- Heat 9/10 Extreme 7 d/yr ≥108°F today · 24 d/yr by 30 yrs out
- Wind 9/10 Extreme 99% chance of damaging wind over 30 yrs
- Air quality 2/10 Low 1 unhealthy d/yr today · 2 by 30 yrs out
Nearby sold comps map
Loading sold comps map…
Walkable amenities ~0.75 mi
Loading nearby amenities…
Taxation est. · year 1
- Rental income
- $22,380
- − Mortgage interest
- −$4,985
- − Property taxes
- −$1,852
- − Insurance
- −$445
- − Repairs & maintenance
- −$1,790
- − Management
- −$1,790
- − HOA
- −$444
- − Depreciation
- −$2,589
- Taxable income
- $8,483
- Est. tax owed @ 24.0%
- −$2,036
- After-tax cash flow
- $7,302/yr
For passive investors: Depreciation is non-cash, so a rental often shows a tax loss while cash-flowing — sheltering income. Rental losses are passive: they offset passive income freely, and up to $25,000/yr can offset ordinary (W-2) income if you actively participate and your MAGI is under $100k (phasing out to $0 by $150k); unused losses carry forward. On sale, claimed depreciation is recaptured at up to 25%, and gains may owe capital-gains tax (a 1031 exchange can defer both). Figures are a year-1 estimate at your 24.0% rate — not tax advice; consult a CPA.
Schools (NCES district)
- District
- Pasco
- NCES district ID
- 1201530
- Math proficiency
- 50% ▼ -10.00%
- Reading proficiency
- 52% ▼ -5.00%
- Median HH income
- $45,039
- Composite
- 43.14/100
- National rank
- #3074
- State rank
- #32 of 73 in FL
Livability — Zephyrhills West
- Score
- 61/100
- State rank
- #772
- US rank
- #17403
Category grades
Schools grade is shown separately in the Schools card above.
Census & demographics
- County
- Pasco County · 524,098 people
- Metro
- Tampa-St. Petersburg-Clearwater, FL
- Population (ZIP)
- 24,654
- Household income
- $56,579
- Rent vs Own
- Severe rent burden
- 393.0
Population outlook (Pasco County) Hauer SSP2
- Today (2025)
- 570,045 people
- By 2030
- 605,844 · +6.3%
- By 2040
- 674,806 · +18.4%
- By 2050
- 736,022 · +29.1%
- By 2075
- 862,900 · +51.4%
- By 2100
- 906,364 · +59.0%
Race, ethnicity, and origin ACS 2023
- Neighborhood character
- Predominantly White (72%)
- Race & ethnicity
- White 72% Hispanic / Latino 15% Two or more races 8% Black 5% Asian 5%
- Hispanic origin (detail)
- Mexican 4% Puerto Rican 9%
- Common ancestry
- Lithuanian 4% Romanian 3% Serbian 3%
- Foreign-born
- 9% · Canada, Vietnam
- Languages at home
- 85% English-only · Spanish 9% Tagalog/Filipino 1% Other Asian/Pacific 1%
Political lean MEDSL · Pasco
- 2024 margin
- Strong R (+25.2) · D 36.9% · R 62.1% · Other 1.0%
- 2008→2024 swing
- -21.6pp toward R · 2008: -3.6pp · 2024: -25.2pp
- All cycles
- 2024: R+25.2 2020: R+20.1 2016: R+21.6 2012: R+6.7 2008: R+3.6
Not yet ingested
- Civics
- —
Market trends
- HPI YoY
- ▼ -55.21%
- Current HPI
- 308.0619
- Rent YoY
- ▼ -2.51%
- Metro
- Tampa-St. Petersburg-Clearwater, FL
- State GDP YoY
- ▲ 3.28%
- F500 in state
- 36
Industry mix (Fortune 500 HQ in FL)
| Industry | F500 HQs | Revenue |
|---|---|---|
| Industrial Technology | 2 | $29B |
|
||
| Insurance | 2 | $17B |
|
||
| Retail | 1 | $60B |
|
||
| Technology Distribution | 1 | $58B |
|
||
| Homebuilding | 1 | $35B |
|
||
| Technology Manufacturing | 1 | $35B |
|
||
Price history
+256.0% since first listed8 events — show timeline
- 2026-04-23 Listing Removed — Stellar MLS as Distributed by MLS Grid
- 2026-04-23 Listed $89,000 Stellar MLS as Distributed by MLS Grid
- 2026-04-09 Listed $89,000 Stellar MLS as Distributed by MLS Grid
- 2025-04-02 Listing Removed — Stellar MLS as Distributed by MLS Grid
- 2025-03-07 Price Changed $109,000 Stellar MLS as Distributed by MLS Grid
- 2025-02-06 Price Changed $128,000 Stellar MLS as Distributed by MLS Grid
- 2024-12-27 Listed $135,000 Stellar MLS as Distributed by MLS Grid
- 1995-12-29 Sold (Public Records) $25,000 Public Records
Property tax history
+12.9%/yrLatest (2025): $1,852 · +295.8% YoY. Source: county tax records.
Cash-flow waterfall
monthlySold comps — $/sqft
last 12 mo · ≤1 miLoading sold comps…