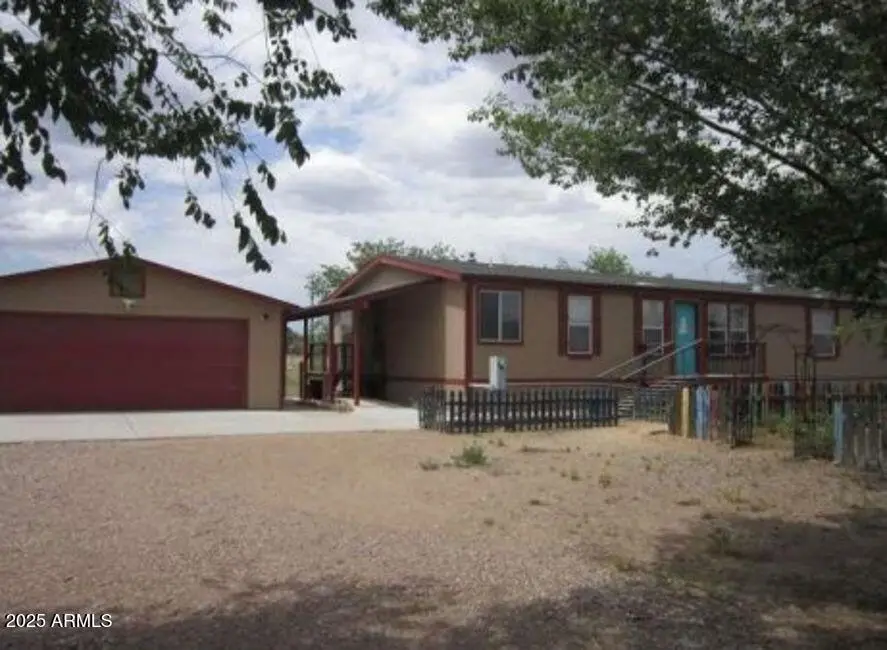
1495 W Buffalo Run Rd · Paulden, AZ
Flood risk 1/10 · Minimal
- FEMA flood zone
- X (unshaded)
- Chance of flooding over 30 yrs
- 0.0%
- Est. flood insurance / yr
- $507 – $1,088
Fire risk 4/10 · Minor
- Est. fire insurance / yr
- $610 – $1,132
Heat risk 5/10 · Moderate
- Hot days now (above 97°F)
- 7 days/yr
- Hot days in 30 yrs
- 18 days/yr
Wind risk 1/10 · Minimal
- Chance of severe wind over 30 yrs
- —
Air-quality risk 1/10 · Minimal
- Unhealthy air days now
- 0 days/yr
- Unhealthy air days in 30 yrs
- 0 days/yr
Risk factors via First Street. Map © Google.
Why this score? — see what drove the D grade
The composite is a weighted blend of 9 inputs, each scored 0–100. Each bar is that input's sub-score; the figure is the points it added to the 100-point composite (weight × sub-score).
- ARV discount +15.0/15.0
- Cash flow +11.6/30.0
- DSCR +3.4/10.0
- Livability +3.0/5.0
- Rent growth +2.5/5.0
- Schools +2.5/10.0
- Condition / age +2.5/5.0
- 1% rule +2.1/10.0
- Appreciation +0.0/10.0
$315,000
🖨 Deal sheet 📄 Offer letter ✓ Due diligence
Listing remarks MLS
This manufactured home offers 4 bedrooms and 2 bathrooms with approximately 2046 square feet of living space on a 2.44 acre lot. Closing is not contingent upon the status of the mobile home title. The purchaser may be responsible to de-title the mobile home after purchase. No Buyer Premium on this property. The data presented in this listing is deemed reliable but not guaranteed. This information should be used for informational use only and does not constitute a legal document for the description of this property. Buyer or Buyer's Agent to verify all facts, figures, schools, dimensions, Sq Ft, permits, HOA fees etc. that is of material importance to Buyer.
Key facts
- 2.44 acre lot
- 2 garage spots
- Built 2005
Neighborhood map
What this means for you Summary
Snapshot
- This is a 4-bed/2.0-bath manufactured listed at $315k.
Deal economics
- At list price, monthly cash flow is $-101 ($-1k/yr) — negative.
- To cash-flow at today's rent, offer at most $297k (5.6% below list).
- To meet the 1% rule (rent ≥ 1% of price), the offer needs to be $225k (28.5% below list).
- Recommended offer: $225k (28.5% below list) — sets the bar for 1% rule.
- Cap rate 5.9% vs local median 3.0% in Paulden — top-decile yield for the area; either an underpriced asset or a hidden risk that comps aren't pricing in. Stress-test before assuming the spread holds.
Location & tenants
- Location reads 59/100 on livability (#202 in AZ) — a working-class tenant base; expect higher turnover. Strengths: housing A+, cost of living A-; Watch: employment D, schools F, amenities F.
- Chino Valley Unified District (4474) (town): math 24% / reading 35% proficiency, ranked #112 of 249 in AZ (top 45%) — low school quality limits family demand, transient renter base, plan for 1-2y turnover.
- Market conditions: 260 active listings in the ZIP; 2,062 units permitted in Yavapai County in 2024 (98 in 5+ unit buildings).
Forward outlook
- Local home prices are declining (-3.0%/yr); year-one equity from $2k of loan paydown is wiped out by about $9k of value loss. Plan a longer hold.
- Yavapai County population projected at +10% by 2050 — modest demand growth; plan on rents tracking national, not racing it.
Negotiation context
- It's been on market 247 days — a 12% lower offer ($277k) is reasonable based on typical stale-listing flexibility.
- 5 sale attempts since 3y ago; this cycle's ask has dropped $34k (10%) from the opening price — seller is motivated, your offer sets the floor, not the list.
Risks & watch-outs
- Climate carrying-cost: extreme-heat days projected 7→18/yr by 2055 (HVAC capex compounding) — expect insurance premiums to compound above CPI over the hold.
Questions for the listing agent
- What do current leases actually rent for vs. the listed asking? Can we see a recent rent roll and the last 12 months of T-12 income?
- It's been on market 247 days. Have you received any prior offers? Is the seller open to a 29% concession, seller financing, or rate buy-down credit?
- Why hasn't it sold? Are there any deal-killer items the seller is aware of (foundation, flood, title, zoning, code violations)?
- Is there a deadline driving the sale (1031 exchange, divorce, estate, relocation)? That informs how much negotiation room exists.
- Schools are F-rated, which usually means shorter tenancies and higher turnover. Who's the typical renter profile here, and what's been the actual vacancy rate?
- The area grade is low — what's the realistic commute time and amenity access for the typical tenant pool here? Any planned neighborhood developments (good or bad) we should know about?
- What's the average days-on-market for RENTAL listings here right now (not sales)? A rising rental-DOM trend means longer vacancies and softer asking-rent achievability than the comps imply.
- What's the recent tenant-quality profile in this submarket — average credit score on applications, eviction rate, late-payment / NSF rate, and stable-employment percentage? A property-management company in the area should have these aggregated.
- How much new for-sale + rental construction is in the pipeline within 1–3 miles? Heavy new supply typically softens prices + rents 12–24 months out; constrained supply supports both.
Investment metrics
- 1% rule
- 0.71% ✗
- Cap rate
- 5.91%
- Cash-on-cash
- -1.37%
- DSCR
- 0.94
- GRM
- 11.7
CMA / ARV
- ARV (median comp)
- $390,819
- List price
- $315,000
- Delta
- -19.40%
- Verdict
- UNDERPRICED
- Comps
- 4 within 1.0 mi
Show comp detail 5 sales within ~0.75 mi
| Address | Dist | Beds/Ba | Sqft | Sold | Price | $/sf | Match |
|---|---|---|---|---|---|---|---|
| 6300 N Gray Gos Rd | 0.43mi | 3/2.0 (-1) | 2,100 (+3%) | 14mo | $302,600 | $144 | 59 |
| 6375 N Mangas Dr | 0.49mi | 3/2.0 (-1) | 1,870 (-9%) | 20mo | $392,000 | $210 | 41 |
| 1117 W Tatanka Cir | 0.37mi | 3/2.0 (-1) | 2,280 (+11%) | 22mo | $460,000 | $202 | 40 |
| 6390 Bison Walk Dr | 0.48mi | 4/2.0 | 1,765 (-14%) | 21mo | $404,000 | $229 | 38 |
| 6474 Bison Walk Dr | 0.50mi | 4/2.0 | 1,765 (-14%) | 21mo | $399,900 | $227 | 37 |
Match score weights: distance 35% · size 25% · config 20% · recency 20%. Top-matched comps best support the ARV.
Projected returns pro-forma
-3.0% appreciation · 3.0% rent growth · sell at horizon
- IRR
- -18.6%
- Equity multiple
- 0.35×
- Total profit
- $-57,595
- Equity at exit
- $46,968
- IRR
- -11.2%
- Equity multiple
- 0.33×
- Total profit
- $-59,003
- Equity at exit
- $27,235
Cash invested: $88,200 (down + closing). Projections, not guarantees.
Landlord ↔ Tenant lean methodology
- Overall (STATE)
- 87 Strongly Landlord-Friendly
- State Arizona
- 87 Strongly Landlord-Friendly · R+3
- County
- — inherits STATE
- City
- — inherits STATE
ZIP-level market 86323
- Home prices YoY
- -18.3%
- Active inventory
- 260
- Price-to-rent
- 11.7×
Monthly cashflow live
- Estimated rent
- $2,252 medium interval (Pro) →
- Mortgage (P&I)
- −$1,652
- Tax from tax record
- −$96 /mo · $1,156/yr
- Insurance
- −$131
- HOA
- −$0
- Vacancy / Maint / Mgmt
- −$473
- Net cashflow
- $-101
Break-even live
UW: 25.0% down · 7.5% · 30yr · 1.5% tax · 5.0% vac · 8.0% maint · 8.0% mgmt
Financing live
Cash to close
- Down payment
- $78,750
- Closing costs
- $9,450
- Reserves months
- —
- Total cash needed
- —
Loan-product check · same deal, 3 products live
Conventional
25% down · 7.5% · 30yr
- Down + closing
- —
- Monthly P&I
- —
- Monthly cashflow
- —
- DSCR
- —
- Eligible?
- —
Personal DTI + credit; lowest rate.
DSCR
20% down · 8.5% · 30yr
- Down + closing
- —
- Monthly P&I
- —
- Monthly cashflow
- —
- DSCR
- —
- Eligible?
- —
No personal income docs; deal must DSCR.
Hard money
10% down · 12.0% · 12mo
- Down + closing
- —
- Monthly P&I
- —
- Monthly cashflow
- —
- DSCR
- —
- Eligible?
- —
Short-term bridge; refi at stabilization.
Listing history 15 events
-
2026-05-05price $315,000 665-char remark
Show marketing remark (665 chars)
This manufactured home offers 4 bedrooms and 2 bathrooms with approximately 2046 square feet of living space on a 2.44 acre lot. Closing is not contingent upon the status of the mobile home title. The purchaser may be responsible to de-title the mobile home after purchase. No Buyer Premium on this property. The data presented in this listing is deemed reliable but not guaranteed. This information should be used for informational use only and does not constitute a legal document for the description of this property. Buyer or Buyer's Agent to verify all facts, figures, schools, dimensions, Sq Ft, permits, HOA fees etc. that is of material importance to Buyer.
-
2025-09-23historical
-
2025-09-22$348,600 Active 665-char remark
Show marketing remark (665 chars)
This manufactured home offers 4 bedrooms and 2 bathrooms with approximately 2046 square feet of living space on a 2.44 acre lot. Closing is not contingent upon the status of the mobile home title. The purchaser may be responsible to de-title the mobile home after purchase. No Buyer Premium on this property. The data presented in this listing is deemed reliable but not guaranteed. This information should be used for informational use only and does not constitute a legal document for the description of this property. Buyer or Buyer's Agent to verify all facts, figures, schools, dimensions, Sq Ft, permits, HOA fees etc. that is of material importance to Buyer.
-
2025-09-12$428,000 Active
-
2024-09-11historical
-
2024-07-30$459,900 Active
-
2023-07-19status Pending
-
2023-07-18soldstatus $428,000 Closed
-
2023-07-18soldstatus $428,000
-
2023-06-29historical Active with Contingency
-
2023-05-22price $415,000
-
2023-04-23status Active
-
2023-04-14historical Active with Contingency
-
2023-04-10$430,000 Active
-
2017-03-03soldstatus $210,000
ⓘ Source: listings_history table (triggers on properties + properties_extension) + one-shot
backfill from property_details.listing_events for pre-trigger history.
Tax reassessment forecast AZ · Resets to sale price
- Current annual tax
- $1,156 · $96/mo
- Projected year-2 tax
- $2,079 · $173/mo
- Expected delta
- +$923/yr (+$77/mo · 79.9%)
ⓘ Screening estimate from a state-policy table — verify with the county assessor before closing.
Climate risk First Street
- Flood 1/10 Low FEMA zone X (unshaded) · 0% chance over 30 yrs
- Wildfire 4/10 Moderate
- Heat 5/10 Major 7 d/yr ≥97°F today · 18 d/yr by 30 yrs out
- Wind 1/10 Low
- Air quality 1/10 Low 0 unhealthy d/yr today · 0 by 30 yrs out
Nearby sold comps map
Loading sold comps map…
Walkable amenities ~0.75 mi
Loading nearby amenities…
Taxation est. · year 1
- Rental income
- $27,021
- − Mortgage interest
- −$17,645
- − Property taxes
- −$1,156
- − Insurance
- −$1,575
- − Repairs & maintenance
- −$2,162
- − Management
- −$2,162
- − Depreciation
- −$9,164
- Taxable loss
- −$6,841
- Est. tax savings @ 24.0%
- +$1,642
- After-tax cash flow
- $435/yr
For passive investors: Depreciation is non-cash, so a rental often shows a tax loss while cash-flowing — sheltering income. Rental losses are passive: they offset passive income freely, and up to $25,000/yr can offset ordinary (W-2) income if you actively participate and your MAGI is under $100k (phasing out to $0 by $150k); unused losses carry forward. On sale, claimed depreciation is recaptured at up to 25%, and gains may owe capital-gains tax (a 1031 exchange can defer both). Figures are a year-1 estimate at your 24.0% rate — not tax advice; consult a CPA.
Schools (NCES district)
- District
- Chino Valley Unified District (4474)
- NCES district ID
- 0400003
- Math proficiency
- 24% ▼ -19.00%
- Reading proficiency
- 35% ▼ -13.00%
- Median HH income
- $44,429
- Composite
- 25.22/100
- National rank
- #7505
- State rank
- #112 of 249 in AZ
Livability — Paulden
- Score
- 59/100
- State rank
- #202
- US rank
- #20477
Category grades
Schools grade is shown separately in the Schools card above.
Census & demographics
- Census place
- Paulden, AZ
- City population
- 4,309
- Population (ZIP)
- 19,297
Population outlook (Yavapai County) Hauer SSP2
- Today (2025)
- 241,389 people
- By 2030
- 249,523 · +3.4%
- By 2040
- 259,966 · +7.7%
- By 2050
- 264,736 · +9.7%
- By 2075
- 269,334 · +11.6%
- By 2100
- 256,505 · +6.3%
Race, ethnicity, and origin ACS 2023
- Neighborhood character
- Predominantly White (80%)
- Race & ethnicity
- White 80% Hispanic / Latino 15% Two or more races 10%
- Hispanic origin (detail)
- Mexican 11%
- Common ancestry
- Portuguese 5% Lithuanian 5% Romanian 3%
- Foreign-born
- 4% · Canada, Vietnam
- Languages at home
- 92% English-only · Spanish 6% German/W. Germanic 1%
Political lean MEDSL · Yavapai
- 2024 margin
- Solid R (+33.9) · D 32.6% · R 66.5%
- 2008→2024 swing
- -9.5pp toward R · 2008: -24.4pp · 2024: -33.9pp
- All cycles
- 2024: R+33.9 2020: R+29.3 2016: R+31.4 2012: R+30.7 2008: R+24.4
Not yet ingested
- Civics
- —
Market trends
- HPI YoY
- ▼ -91.73%
- Current HPI
- 410.5632
- Rent YoY
- —
- Metro
- —
- State GDP YoY
- ▲ 4.54%
- F500 in state
- 20
Industry mix (Fortune 500 HQ in AZ)
| Industry | F500 HQs | Revenue |
|---|---|---|
| Technology | 2 | $13B |
|
||
| Mining / Metals | 1 | $23B |
|
||
| Environmental Services | 1 | $16B |
|
||
| Metals / Steel | 1 | $14B |
|
||
| Technology Distribution | 1 | $9B |
|
||
| Homebuilding | 1 | $8B |
|
||
Price history
+50.0% since first listed15 events — show timeline
- 2026-05-05 Price Changed $315,000 ARMLS
- 2025-09-23 Listing Removed — PAARMLS as Distributed by MLS Grid
- 2025-09-22 Listed $348,600 ARMLS
- 2025-09-12 Listed $428,000 PAARMLS as Distributed by MLS Grid
- 2024-09-11 Listing Removed — PAARMLS as Distributed by MLS Grid
- 2024-07-30 Listed $459,900 PAARMLS as Distributed by MLS Grid
- 2023-07-19 Pending — PAARMLS as Distributed by MLS Grid
- 2023-07-18 Sold (Public Records) $428,000 Public Records
- 2023-07-18 Sold (MLS) $428,000 PAARMLS as Distributed by MLS Grid
- 2023-06-29 Contingent — PAARMLS as Distributed by MLS Grid
- 2023-05-22 Price Changed $415,000 PAARMLS as Distributed by MLS Grid
- 2023-04-23 Relisted — PAARMLS as Distributed by MLS Grid
- 2023-04-14 Contingent — PAARMLS as Distributed by MLS Grid
- 2023-04-10 Listed $430,000 PAARMLS as Distributed by MLS Grid
- 2017-03-03 Sold (MLS) $210,000 PAARMLS as Distributed by MLS Grid
Property tax history
+6.8%/yrLatest (2025): $1,156 · +4.5% YoY. Source: county tax records.
Cash-flow waterfall
monthlySold comps — $/sqft
last 12 mo · ≤1 miLoading sold comps…