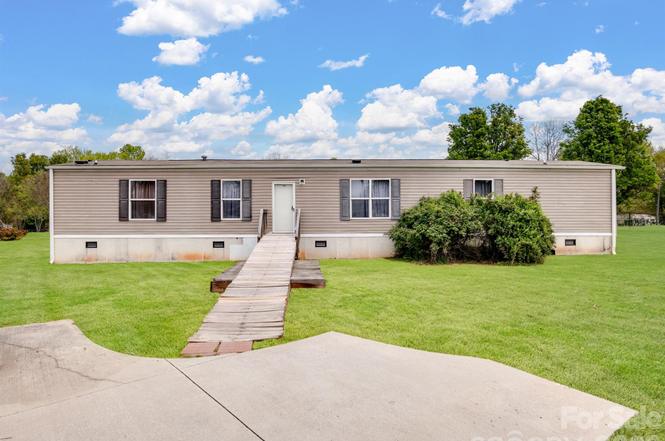
208 Daves Rd · York, SC
Flood risk 1/10 · Minimal
- FEMA flood zone
- X (unshaded)
- Chance of flooding over 30 yrs
- 0.0%
- Est. flood insurance / yr
- $507 – $1,088
Fire risk 5/10 · Moderate
- Est. fire insurance / yr
- $783 – $1,453
Heat risk 6/10 · Moderate
- Hot days now (above 105°F)
- 7 days/yr
- Hot days in 30 yrs
- 16 days/yr
Wind risk 6/10 · Moderate
- Chance of severe wind over 30 yrs
- 27.0%
Air-quality risk 3/10 · Minor
- Unhealthy air days now
- 2 days/yr
- Unhealthy air days in 30 yrs
- 3 days/yr
Risk factors via First Street. Map © Google.
Why this score? — see what drove the C+ grade
The composite is a weighted blend of 9 inputs, each scored 0–100. Each bar is that input's sub-score; the figure is the points it added to the 100-point composite (weight × sub-score).
- Cash flow +23.2/30.0
- ARV discount +15.0/15.0
- DSCR +7.4/10.0
- 1% rule +4.7/10.0
- Livability +3.2/5.0
- Schools +3.0/10.0
- Rent growth +2.5/5.0
- Condition / age +2.5/5.0
- Appreciation +0.0/10.0
$210,000
🖨 Deal sheet 📄 Offer letter ✓ Due diligence
Listing remarks
Situated on a spacious 1.27-acre corner lot, this home offers an open, level setting with plenty of room for entertaining. A wired, oversized detached garage provides the perfect space for a workshop or extra storage. Inside, the open floor plan connects the living room, dining area, and kitchen, creating a welcoming and functional layout. The kitchen features ample cabinetry and a large island with a breakfast bar, while the split-bedroom floor plan offers added privacy and comfort. Carpet replaced in 2 bedrooms. Plenty of parking in the driveway. Enjoy the Quiet Country life!
Key facts
- 1.27 acre lot
- Garage
- Built 2015
Property features AI
Finance
- HOA & community: No HOA
Exterior
- Parking: Detached garage (1-car); 720 sq ft garage; Driveway parking; 4 open parking spaces
- Utilities: Community well water; Septic system
- Home design: Manufactured singlewide residence; One story; Ramp(s) to main level; Zoning: RC-II
- Construction: Manufactured construction; Vinyl exterior
- Exterior features: Corner, level lot; Publicly maintained paved concrete road
Interior
- Kitchen: Dishwasher; Electric oven; Electric range; Exhaust hood; Self-cleaning oven
- Bedrooms: 3 bedrooms (all on the main level)
- Flooring: Carpet; Linoleum
- Bathrooms: 2 full bathrooms (main level)
- Heating & cooling: Central heating (electric); Central air conditioning (electric)
- Interior features: Breakfast bar; Kitchen island; Open floorplan; Insulated windows; 8 total rooms
- Laundry & utility: Laundry on the main level
Neighborhood map
What this means for you Summary
Snapshot
- This is a 3-bed/2.0-bath single-family listed at $210k.
Deal economics
- At list price, monthly cash flow is $379 ($5k/yr) — positive.
- The deal already cash-flows at list — no discount required.
- To meet the 1% rule (rent ≥ 1% of price), the offer needs to be $205k (2.6% below list).
- Recommended offer: $197k (6.0% below list) — sets the bar for market timing.
- Cap rate 8.5% vs local median 4.6% in York — top-decile yield for the area; either an underpriced asset or a hidden risk that comps aren't pricing in. Stress-test before assuming the spread holds.
Location & tenants
- Location reads 65/100 on livability (#139 in SC) — a middle-class / working-renter tenant base. Strengths: cost of living A+, housing A+, health & safety A+; Watch: crime F, amenities F, commute F.
- York 01 (rural): math 31% / reading 40% proficiency, ranked #41 of 80 in SC (top 51%) — families likely to look elsewhere, expect single-tenant / working-renter base with shorter leases.
- Zoned schools: Jefferson Elementary (math 37% / reading 37%, grade F, #315 of 597 statewide, top 55%, 418 students, 100% FRL); York Comprehensive High (math 39% / reading 82%, grade C+, #108 of 196 statewide, top 55%, 1,493 students, 68% FRL) — zoned schools average 84% FRL vs 54% district-wide (31 pts higher); higher-poverty schools than district average — tighter screening recommended.
- Zoned-school proficiency averages 49% at this address vs 36% district-wide (+13 pts) — the actual schools serving this property are materially stronger than the York 01 average implies; a family-tenant draw the district grade alone would hide.
- Market conditions: 541 active listings in the ZIP; solid renter incomes; 2,550 units permitted in York County in 2024 (350 in 5+ unit buildings).
- This rent runs 31% of the median local income ($79k/yr) — at the standard rent-burdened threshold; future hikes will face affordability resistance.
Forward outlook
- Local home prices are declining (-3.0%/yr); year-one equity from $1k of loan paydown is wiped out by about $6k of value loss. Plan a longer hold.
- York County population projected at +44% by 2050 — long-run rental-demand tailwind backs the buy-and-hold thesis.
Negotiation context
- It's been on market 79 days — a 6% lower offer ($197k) is reasonable based on typical stale-listing flexibility.
Risks & watch-outs
- Climate carrying-cost: major wind risk, 27% chance of damaging wind over 30y; moderate wildfire risk; extreme-heat days projected 7→16/yr by 2055 (HVAC capex compounding) — expect insurance premiums to compound above CPI over the hold.
Questions for the listing agent
- It's been on market 79 days. Have you received any prior offers? Is the seller open to a 6% concession, seller financing, or rate buy-down credit?
- Why hasn't it sold? Are there any deal-killer items the seller is aware of (foundation, flood, title, zoning, code violations)?
- Is there a deadline driving the sale (1031 exchange, divorce, estate, relocation)? That informs how much negotiation room exists.
- Schools are D-rated, which usually means shorter tenancies and higher turnover. Who's the typical renter profile here, and what's been the actual vacancy rate?
- Crime grade is F in this area — have there been break-ins, vandalism, or insurance claims at this property in the last 3 years? What carrier currently insures it and at what premium?
- What's the average days-on-market for RENTAL listings here right now (not sales)? A rising rental-DOM trend means longer vacancies and softer asking-rent achievability than the comps imply.
- What's the recent tenant-quality profile in this submarket — average credit score on applications, eviction rate, late-payment / NSF rate, and stable-employment percentage? A property-management company in the area should have these aggregated.
- How much new for-sale + rental construction is in the pipeline within 1–3 miles? Heavy new supply typically softens prices + rents 12–24 months out; constrained supply supports both.
Investment metrics
- 1% rule
- 0.97% ✗
- Cap rate
- 8.46%
- Cash-on-cash
- 7.74%
- DSCR
- 1.34
- GRM
- 8.6
CMA / ARV
- ARV (on-the-fly)
- $289,408
- Comps found
- 3
Show comp detail 3 sales within ~0.75 mi
| Address | Dist | Beds/Ba | Sqft | Sold | Price | $/sf | Match |
|---|---|---|---|---|---|---|---|
| 143 Flushing Dr | 0.69mi | 3/2.0 | 1,200 (-1%) | 5mo | $275,000 | $229 | 62 |
| 431 Stacy Ln | 0.64mi | 3/2.0 | 1,262 (+4%) | 6mo | $299,900 | $238 | 59 |
| 1274 Bicycle Ct | 0.58mi | 3/2.0 | 1,386 (+14%) | 14mo | $360,000 | $260 | 38 |
Match score weights: distance 35% · size 25% · config 20% · recency 20%. Top-matched comps best support the ARV.
Projected returns pro-forma
-3.0% appreciation · 3.0% rent growth · sell at horizon
- IRR
- -4.5%
- Equity multiple
- 0.83×
- Total profit
- $-9,962
- Equity at exit
- $31,312
- IRR
- 5.1%
- Equity multiple
- 1.37×
- Total profit
- $22,035
- Equity at exit
- $18,157
Cash invested: $58,800 (down + closing). Projections, not guarantees.
Landlord ↔ Tenant lean methodology
- Overall (STATE)
- 90 Strongly Landlord-Friendly
- State South Carolina
- 90 Strongly Landlord-Friendly · R+6
- County
- — inherits STATE
- City
- — inherits STATE
ZIP-level market 29745
- Home prices YoY
- -30.3%
- Active inventory
- 541
- Price-to-rent
- 8.6×
Monthly cashflow live
- Estimated rent
- $2,045 medium interval (Pro) →
- Mortgage (P&I)
- −$1,101
- Tax from tax record
- −$48 /mo · $570/yr
- Insurance
- −$88
- HOA
- −$0
- Vacancy / Maint / Mgmt
- −$430
- Net cashflow
- $379
Break-even live
UW: 25.0% down · 7.5% · 30yr · 1.5% tax · 5.0% vac · 8.0% maint · 8.0% mgmt
Financing live
Cash to close
- Down payment
- $52,500
- Closing costs
- $6,300
- Reserves months
- —
- Total cash needed
- —
Loan-product check · same deal, 3 products live
Conventional
25% down · 7.5% · 30yr
- Down + closing
- —
- Monthly P&I
- —
- Monthly cashflow
- —
- DSCR
- —
- Eligible?
- —
Personal DTI + credit; lowest rate.
DSCR
20% down · 8.5% · 30yr
- Down + closing
- —
- Monthly P&I
- —
- Monthly cashflow
- —
- DSCR
- —
- Eligible?
- —
No personal income docs; deal must DSCR.
Hard money
10% down · 12.0% · 12mo
- Down + closing
- —
- Monthly P&I
- —
- Monthly cashflow
- —
- DSCR
- —
- Eligible?
- —
Short-term bridge; refi at stabilization.
Listing history 17 events
-
2026-06-18days on market $210,000 Active 79 DOM
-
2026-06-17days on market $210,000 Active 78 DOM
-
2026-06-16days on market $210,000 Active 77 DOM
-
2026-06-15price $210,000 Active 76 DOM
-
2026-06-15days on market $212,000 Active 76 DOM
-
2026-06-13days on market $212,000 Active 74 DOM
-
2026-06-09days on market $212,000 Active 70 DOM
-
2026-06-08days on market $212,000 Active 69 DOM
-
2026-06-07days on market $212,000 Active 68 DOM
-
2026-06-04days on market $212,000 Active 65 DOM
-
2026-06-03days on market $212,000 Active 64 DOM
-
2026-06-02days on market $212,000 Active 63 DOM
-
2026-06-01days on market $212,000 Active 62 DOM
-
2026-05-31days on market $212,000 Active 61 DOM
-
2026-05-22price $212,000
-
2026-03-31status Active
-
2025-12-16historical $215,000
ⓘ Source: listings_history table (triggers on properties + properties_extension) + one-shot
backfill from property_details.listing_events for pre-trigger history.
Tax reassessment forecast SC · Resets to sale price
- Current annual tax
- $570 · $48/mo
- Projected year-2 tax
- $1,197 · $100/mo
- Expected delta
- +$627/yr (+$52/mo · 109.8%)
ⓘ Screening estimate from a state-policy table — verify with the county assessor before closing.
Climate risk First Street
- Flood 1/10 Low FEMA zone X (unshaded) · 0% chance over 30 yrs
- Wildfire 5/10 Major
- Heat 6/10 Major 7 d/yr ≥105°F today · 16 d/yr by 30 yrs out
- Wind 6/10 Major 27% chance of damaging wind over 30 yrs
- Air quality 3/10 Moderate 2 unhealthy d/yr today · 3 by 30 yrs out
Nearby sold comps map
Loading sold comps map…
Walkable amenities ~0.75 mi
Loading nearby amenities…
Taxation est. · year 1
- Rental income
- $24,543
- − Mortgage interest
- −$11,763
- − Property taxes
- −$570
- − Insurance
- −$1,050
- − Repairs & maintenance
- −$1,963
- − Management
- −$1,963
- − Depreciation
- −$6,109
- Taxable income
- $1,124
- Est. tax owed @ 24.0%
- −$270
- After-tax cash flow
- $4,284/yr
For passive investors: Depreciation is non-cash, so a rental often shows a tax loss while cash-flowing — sheltering income. Rental losses are passive: they offset passive income freely, and up to $25,000/yr can offset ordinary (W-2) income if you actively participate and your MAGI is under $100k (phasing out to $0 by $150k); unused losses carry forward. On sale, claimed depreciation is recaptured at up to 25%, and gains may owe capital-gains tax (a 1031 exchange can defer both). Figures are a year-1 estimate at your 24.0% rate — not tax advice; consult a CPA.
Schools (NCES district)
- District
- York 01
- NCES district ID
- 4503810
- Math proficiency
- 31% ▼ -16.00%
- Reading proficiency
- 40% ▬ 0.00%
- Median HH income
- $44,491
- Composite
- 30.21/100
- National rank
- #6305
- State rank
- #41 of 80 in SC
Livability — York
- Score
- 65/100
- State rank
- #139
- US rank
- #13425
Category grades
Schools grade is shown separately in the Schools card above.
Census & demographics
- County
- York County · 281,758 people
- City population
- 34,909
- Metro
- Charlotte-Concord-Gastonia, NC-SC
- Population (ZIP)
- 34,909
- Household income
- $79,117
- Rent vs Own
- Severe rent burden
- 321.0
Population outlook (York County) Hauer SSP2
- Today (2025)
- 307,757 people
- By 2030
- 335,979 · +9.2%
- By 2040
- 391,378 · +27.2%
- By 2050
- 443,234 · +44.0%
- By 2075
- 557,102 · +81.0%
- By 2100
- 625,837 · +103.4%
Race, ethnicity, and origin ACS 2023
- Neighborhood character
- Predominantly White (75%)
- Race & ethnicity
- White 75% Black 12% Two or more races 6% Hispanic / Latino 6% Asian 1%
- Hispanic origin (detail)
- Mexican 4%
- Common ancestry
- Romanian 3% Serbian 3% Italian 2%
- Foreign-born
- 4% · Canada
- Languages at home
- 94% English-only · Spanish 4%
Political lean MEDSL · York
- 2024 margin
- R (+19.1) · D 39.7% · R 58.8% · Other 1.5%
- 2008→2024 swing
- -1.4pp toward R · 2008: -17.7pp · 2024: -19.1pp
- All cycles
- 2024: R+19.1 2020: R+16.5 2016: R+22.1 2012: R+20.5 2008: R+17.7
Not yet ingested
- Civics
- —
Market trends
- HPI YoY
- ▼ -109.42%
- Current HPI
- 251.6848
- Rent YoY
- —
- Metro
- Charlotte-Concord-Gastonia, NC-SC
- State GDP YoY
- ▲ 4.51%
- F500 in state
- 2
Industry mix (Fortune 500 HQ in SC)
| Industry | F500 HQs | Revenue |
|---|---|---|
| Packaging | 1 | $7B |
|
||
Price history
-1.4% since first listed3 events — show timeline
- 2026-05-22 Price Changed $212,000 CANOPYMLS as Distributed by MLS Grid
- 2026-03-31 Relisted — CANOPYMLS as Distributed by MLS Grid
- 2025-12-16 Coming Soon $215,000 CANOPYMLS as Distributed by MLS Grid
Property tax history
-5.6%/yrLatest (2025): $570 · +3.0% YoY. Source: county tax records.
Cash-flow waterfall
monthlySold comps — $/sqft
last 12 mo · ≤1 miLoading sold comps…