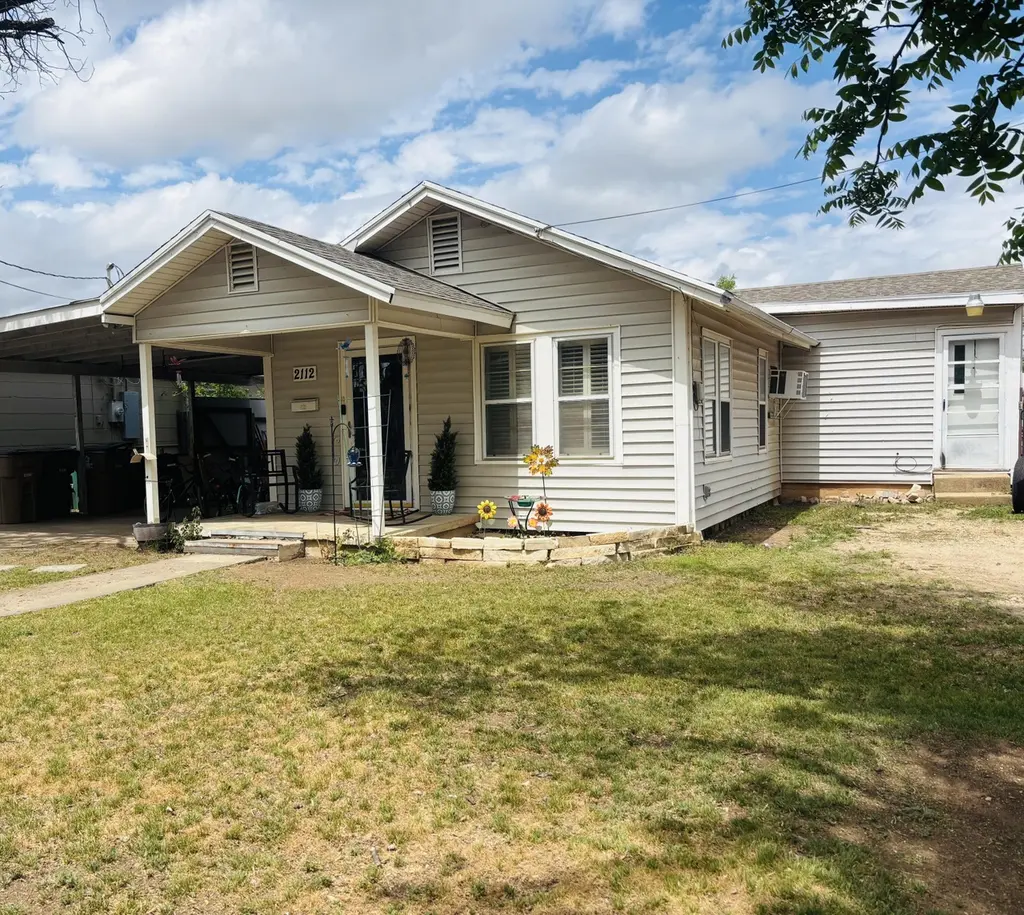
2112 San Antonio St · San Angelo, TX
Flood risk 1/10 · Minimal
- FEMA flood zone
- X (unshaded)
- Chance of flooding over 30 yrs
- 0.0%
- Est. flood insurance / yr
- $507 – $1,088
Fire risk 6/10 · Moderate
- Est. fire insurance / yr
- $1,222 – $2,270
Heat risk 7/10 · Major
- Hot days now (above 104°F)
- 7 days/yr
- Hot days in 30 yrs
- 22 days/yr
Wind risk 4/10 · Minor
- Chance of severe wind over 30 yrs
- 12.0%
Air-quality risk 1/10 · Minimal
- Unhealthy air days now
- 0 days/yr
- Unhealthy air days in 30 yrs
- 0 days/yr
Risk factors via First Street. Map © Google.
Why this score? — see what drove the D+ grade
The composite is a weighted blend of 9 inputs, each scored 0–100. Each bar is that input's sub-score; the figure is the points it added to the 100-point composite (weight × sub-score).
- Appreciation +10.0/10.0
- Cash flow +8.8/30.0
- ARV discount +8.8/15.0
- Rent growth +3.9/5.0
- Livability +3.7/5.0
- 1% rule +3.2/10.0
- Schools +2.6/10.0
- Condition / age +2.5/5.0
- DSCR +2.4/10.0
$190,000
🖨 Deal sheet 📄 Offer letter ✓ Due diligence
Listing remarks MLS
Perfectly positioned with convenience in mind, this centrally located property offers easy access to shopping, dining, schools, and entertainment—putting everything you need just minutes away. Inside, you'll find a spacious and functional layout designed for comfortable living. The generous living areas provide plenty of room to relax or entertain, while the well-appointed kitchen offers ample storage and workspace for everyday cooking. Each of the four bedrooms is thoughtfully sized, providing flexibility for family, guests, or a home office. Step outside to enjoy a sizable yard with endless potential—ideal for gatherings, gardening, or simply unwinding after a long day. Whether you're a first-time buyer, growing family, or investor, this home offers an unbeatable combination of location, space, and value. Don't miss your opportunity to own a centrally located gem in San Angelo!
Key facts
- Centrally located
- Spacious layout
- 6,273 sq ft lot
Tags
Neighborhood map
What this means for you Summary
Snapshot
- This is a 4-bed/2.0-bath single-family listed at $190k.
Deal economics
- At list price, monthly cash flow is $-157 ($-2k/yr) — negative.
- To cash-flow at today's rent, offer at most $162k (14.6% below list).
- To meet the 1% rule (rent ≥ 1% of price), the offer needs to be $157k (17.6% below list).
- Recommended offer: $157k (17.6% below list) — sets the bar for 1% rule.
- Cap rate 5.3% vs local median 3.8% in San Angelo — top-decile yield for the area; either an underpriced asset or a hidden risk that comps aren't pricing in. Stress-test before assuming the spread holds.
Location & tenants
- Location reads 73/100 on livability (#199 in TX) — a middle-class / working-renter tenant base. Strengths: cost of living A+, housing A+, health & safety A+; Watch: employment C-, schools F, amenities F.
- San Angelo ISD (urban): math 27% / reading 33% proficiency, ranked #627 of 826 in TX (top 76%) — families likely to look elsewhere, expect single-tenant / working-renter base with shorter leases.
- Market conditions: Rents rising fast (+5.8%/yr); 331 active listings in the ZIP; 233 units permitted in Tom Green County in 2024 (0 in 5+ unit buildings).
Forward outlook
- In year one you build about $20k of equity ($1k loan paydown + $19k appreciation (10.0% local appreciation)).
- Tom Green County population projected at +35% by 2050 — long-run rental-demand tailwind backs the buy-and-hold thesis.
- By year 2, paydown + projected appreciation supports a ~$33k cash-out refi (75% LTV) — recoverable capital for the next deal without selling this one.
Negotiation context
- It's been on market 69 days — a 6% lower offer ($179k) is reasonable based on typical stale-listing flexibility.
Risks & watch-outs
- Watch-outs: built in 1959 — expect roof / HVAC / electrical / plumbing capex.
- Climate carrying-cost: major wildfire risk; extreme-heat days projected 7→22/yr by 2055 (HVAC capex compounding) — expect insurance premiums to compound above CPI over the hold.
Questions for the listing agent
- What do current leases actually rent for vs. the listed asking? Can we see a recent rent roll and the last 12 months of T-12 income?
- It's been on market 69 days. Have you received any prior offers? Is the seller open to a 18% concession, seller financing, or rate buy-down credit?
- Built in 1959 — when were the roof, HVAC, electrical panel, plumbing, and water heater last replaced?
- Why hasn't it sold? Are there any deal-killer items the seller is aware of (foundation, flood, title, zoning, code violations)?
- Is there a deadline driving the sale (1031 exchange, divorce, estate, relocation)? That informs how much negotiation room exists.
- Schools are F-rated, which usually means shorter tenancies and higher turnover. Who's the typical renter profile here, and what's been the actual vacancy rate?
- The area grade is low — what's the realistic commute time and amenity access for the typical tenant pool here? Any planned neighborhood developments (good or bad) we should know about?
- What's the average days-on-market for RENTAL listings here right now (not sales)? A rising rental-DOM trend means longer vacancies and softer asking-rent achievability than the comps imply.
- What's the recent tenant-quality profile in this submarket — average credit score on applications, eviction rate, late-payment / NSF rate, and stable-employment percentage? A property-management company in the area should have these aggregated.
- How much new for-sale + rental construction is in the pipeline within 1–3 miles? Heavy new supply typically softens prices + rents 12–24 months out; constrained supply supports both.
Investment metrics
- 1% rule
- 0.82% ✗
- Cap rate
- 5.30%
- Cash-on-cash
- -3.53%
- DSCR
- 0.84
- GRM
- 10.1
CMA / ARV
- ARV (median comp)
- $195,429
- List price
- $190,000
- Delta
- -2.78%
- Verdict
- FAIR
- Comps
- 20 within 1.0 mi
Projected returns pro-forma
10.0% appreciation · 5.78% rent growth · sell at horizon
- IRR
- 22.7%
- Equity multiple
- 2.84×
- Total profit
- $98,082
- Equity at exit
- $171,167
- IRR
- 21.0%
- Equity multiple
- 6.77×
- Total profit
- $307,048
- Equity at exit
- $369,128
Cash invested: $53,200 (down + closing). Projections, not guarantees.
Landlord ↔ Tenant lean methodology
- Overall (STATE)
- 87 Strongly Landlord-Friendly
- State Texas
- 87 Strongly Landlord-Friendly · R+5
- County
- — inherits STATE
- City
- — inherits STATE
ZIP-level market 76901
- Home prices YoY
- 6.4%
- Rents YoY
- 5.8%
- Active inventory
- 331
- Price-to-rent
- 10.1×
Monthly cashflow live
- Estimated rent
- $1,566 medium interval (Pro) →
- Mortgage (P&I)
- −$996
- Tax from tax record
- −$318 /mo · $3,821/yr
- Insurance
- −$79
- HOA
- −$0
- Vacancy / Maint / Mgmt
- −$329
- Net cashflow
- $-157
Break-even live
UW: 25.0% down · 7.5% · 30yr · 1.5% tax · 5.0% vac · 8.0% maint · 8.0% mgmt
Financing live
Cash to close
- Down payment
- $47,500
- Closing costs
- $5,700
- Reserves months
- —
- Total cash needed
- —
Loan-product check · same deal, 3 products live
Conventional
25% down · 7.5% · 30yr
- Down + closing
- —
- Monthly P&I
- —
- Monthly cashflow
- —
- DSCR
- —
- Eligible?
- —
Personal DTI + credit; lowest rate.
DSCR
20% down · 8.5% · 30yr
- Down + closing
- —
- Monthly P&I
- —
- Monthly cashflow
- —
- DSCR
- —
- Eligible?
- —
No personal income docs; deal must DSCR.
Hard money
10% down · 12.0% · 12mo
- Down + closing
- —
- Monthly P&I
- —
- Monthly cashflow
- —
- DSCR
- —
- Eligible?
- —
Short-term bridge; refi at stabilization.
Listing history 20 events
-
2026-06-19days on market $190,000 Active 69 DOM
-
2026-06-18days on market $190,000 Active 68 DOM
-
2026-06-17days on market $190,000 Active 67 DOM
-
2026-06-16days on market $190,000 Active 66 DOM
-
2026-06-15days on market $190,000 Active 65 DOM
-
2026-06-14days on market $190,000 Active 63 DOM
-
2026-06-13days on market $190,000 Active 62 DOM
-
2026-06-10days on market $190,000 Active 60 DOM
-
2026-06-09days on market $190,000 Active 59 DOM
-
2026-06-09price $190,000 Active 58 DOM
-
2026-06-08days on market $200,000 Active 58 DOM
-
2026-06-07days on market $200,000 Active 57 DOM
-
2026-06-02days on market $200,000 Active 52 DOM
-
2026-06-01days on market $200,000 Active 51 DOM
-
2026-05-31days on market $200,000 Active 50 DOM
-
2026-05-30days on market $200,000 Active 49 DOM
-
2026-05-03price $200,000 904-char remark
Show marketing remark (904 chars)
Perfectly positioned with convenience in mind, this centrally located property offers easy access to shopping, dining, schools, and entertainment—putting everything you need just minutes away. Inside, you'll find a spacious and functional layout designed for comfortable living. The generous living areas provide plenty of room to relax or entertain, while the well-appointed kitchen offers ample storage and workspace for everyday cooking. Each of the four bedrooms is thoughtfully sized, providing flexibility for family, guests, or a home office. Step outside to enjoy a sizable yard with endless potential—ideal for gatherings, gardening, or simply unwinding after a long day. Whether you're a first-time buyer, growing family, or investor, this home offers an unbeatable combination of location, space, and value. Don't miss your opportunity to own a centrally located gem in San Angelo!
-
2026-04-12$215,000 Active 904-char remark
Show marketing remark (904 chars)
Perfectly positioned with convenience in mind, this centrally located property offers easy access to shopping, dining, schools, and entertainment—putting everything you need just minutes away. Inside, you'll find a spacious and functional layout designed for comfortable living. The generous living areas provide plenty of room to relax or entertain, while the well-appointed kitchen offers ample storage and workspace for everyday cooking. Each of the four bedrooms is thoughtfully sized, providing flexibility for family, guests, or a home office. Step outside to enjoy a sizable yard with endless potential—ideal for gatherings, gardening, or simply unwinding after a long day. Whether you're a first-time buyer, growing family, or investor, this home offers an unbeatable combination of location, space, and value. Don't miss your opportunity to own a centrally located gem in San Angelo!
-
2025-03-13soldstatus
-
2022-02-07soldstatus
ⓘ Source: listings_history table (triggers on properties + properties_extension) + one-shot
backfill from property_details.listing_events for pre-trigger history.
Tax reassessment forecast TX · Resets to sale price
- Current annual tax
- $3,821 · $318/mo
- Projected year-2 tax
- $3,821 · $318/mo
- Expected delta
- $0/yr ($0/mo · 0.0%)
ⓘ Screening estimate from a state-policy table — verify with the county assessor before closing.
Climate risk First Street
- Flood 1/10 Low FEMA zone X (unshaded) · 0% chance over 30 yrs
- Wildfire 6/10 Major
- Heat 7/10 Severe 7 d/yr ≥104°F today · 22 d/yr by 30 yrs out
- Wind 4/10 Moderate 12% chance of damaging wind over 30 yrs
- Air quality 1/10 Low 0 unhealthy d/yr today · 0 by 30 yrs out
Nearby sold comps map
Loading sold comps map…
Walkable amenities ~0.75 mi
Loading nearby amenities…
Taxation est. · year 1
- Rental income
- $18,795
- − Mortgage interest
- −$10,643
- − Property taxes
- −$3,821
- − Insurance
- −$950
- − Repairs & maintenance
- −$1,504
- − Management
- −$1,504
- − Depreciation
- −$5,527
- Taxable loss
- −$5,153
- Est. tax savings @ 24.0%
- +$1,237
- After-tax cash flow
- $-642/yr
For passive investors: Depreciation is non-cash, so a rental often shows a tax loss while cash-flowing — sheltering income. Rental losses are passive: they offset passive income freely, and up to $25,000/yr can offset ordinary (W-2) income if you actively participate and your MAGI is under $100k (phasing out to $0 by $150k); unused losses carry forward. On sale, claimed depreciation is recaptured at up to 25%, and gains may owe capital-gains tax (a 1031 exchange can defer both). Figures are a year-1 estimate at your 24.0% rate — not tax advice; consult a CPA.
Schools (NCES district)
- District
- San Angelo ISD
- NCES district ID
- 4838700
- Math proficiency
- 27% ▼ -9.00%
- Reading proficiency
- 33% ▼ -3.00%
- Median HH income
- $43,501
- Composite
- 25.56/100
- National rank
- #7427
- State rank
- #627 of 826 in TX
Livability — San Angelo
- Score
- 73/100
- State rank
- #199
- US rank
- #5030
Category grades
Schools grade is shown separately in the Schools card above.
Census & demographics
- Census place
- San Angelo, TX
- County
- Tom Green County · 113,188 people
- City population
- 81,357
- Metro
- San Angelo, TX
- Population (ZIP)
- 31,831
- Household income
- $69,450
- Rent vs Own
- Severe rent burden
- 1034.0
Population outlook (Tom Green County) Hauer SSP2
- Today (2025)
- 135,110 people
- By 2030
- 144,090 · +6.6%
- By 2040
- 162,561 · +20.3%
- By 2050
- 182,158 · +34.8%
- By 2075
- 232,274 · +71.9%
- By 2100
- 268,218 · +98.5%
Race, ethnicity, and origin ACS 2023
- Neighborhood character
- Majority White (55%)
- Race & ethnicity
- White 55% Hispanic / Latino 41% Two or more races 17% Black 2%
- Hispanic origin (detail)
- Mexican 38%
- Common ancestry
- Lithuanian 3% Slovak 3% Iranian 1%
- Foreign-born
- 5% · Canada
- Languages at home
- 77% English-only · Spanish 21% German/W. Germanic 1%
Political lean MEDSL · Tom Green
- 2024 margin
- Solid R (+48.0) · D 25.5% · R 73.5% · Other 1.0%
- 2008→2024 swing
- -6.3pp toward R · 2008: -41.7pp · 2024: -48.0pp
- All cycles
- 2024: R+48.0 2020: R+44.4 2016: R+47.9 2012: R+47.9 2008: R+41.7
Not yet ingested
- Civics
- —
Market trends
- HPI YoY
- ▲ 47.96%
- Current HPI
- 798.58
- Rent YoY
- ▲ 5.78%
- Metro
- San Angelo, TX
- State GDP YoY
- ▲ 3.95%
- F500 in state
- 110
Industry mix (Fortune 500 HQ in TX)
| Industry | F500 HQs | Revenue |
|---|---|---|
| Energy | 16 | $1,198B |
|
||
| Technology | 5 | $198B |
|
||
| Engineering / Construction | 4 | $72B |
|
||
| Energy Services | 3 | $60B |
|
||
| Utilities | 3 | $41B |
|
||
| Healthcare | 2 | $330B |
|
||
Price history
-7.0% since first listed4 events — show timeline
- 2026-05-03 Price Changed $200,000 SAAR TX
- 2026-04-12 Listed $215,000 SAAR TX
- 2025-03-13 Sold (Public Records) — Public Records
- 2022-02-07 Sold (Public Records) — Public Records
Property tax history
+13.5%/yrLatest (2025): $3,821 · +24.2% YoY. Source: county tax records.
Cash-flow waterfall
monthlySold comps — $/sqft
last 12 mo · ≤1 miLoading sold comps…