2624 Mura St · Baltimore, MD
Flood risk 1/10 · Minimal
- FEMA flood zone
- X (unshaded)
- Chance of flooding over 30 yrs
- 0.0%
- Est. flood insurance / yr
- $473 – $860
Fire risk 1/10 · Minimal
- Est. fire insurance / yr
- $755 – $1,403
Heat risk 8/10 · Major
- Hot days now (above 103°F)
- 7 days/yr
- Hot days in 30 yrs
- 15 days/yr
Wind risk 6/10 · Moderate
- Chance of severe wind over 30 yrs
- 27.0%
Air-quality risk 4/10 · Minor
- Unhealthy air days now
- 6 days/yr
- Unhealthy air days in 30 yrs
- 7 days/yr
Risk factors via First Street. Map © Google.
Why this score? — see what drove the A- grade
The composite is a weighted blend of 9 inputs, each scored 0–100. Each bar is that input's sub-score; the figure is the points it added to the 100-point composite (weight × sub-score).
- Cash flow +30.0/30.0
- ARV discount +15.0/15.0
- 1% rule +10.0/10.0
- DSCR +10.0/10.0
- Appreciation +4.7/10.0
- Rent growth +3.8/5.0
- Livability +3.8/5.0
- Condition / age +2.5/5.0
- Schools +1.0/10.0
$79,900
🖨 Deal sheet 📄 Offer letter ✓ Due diligence
Listing remarks MLS
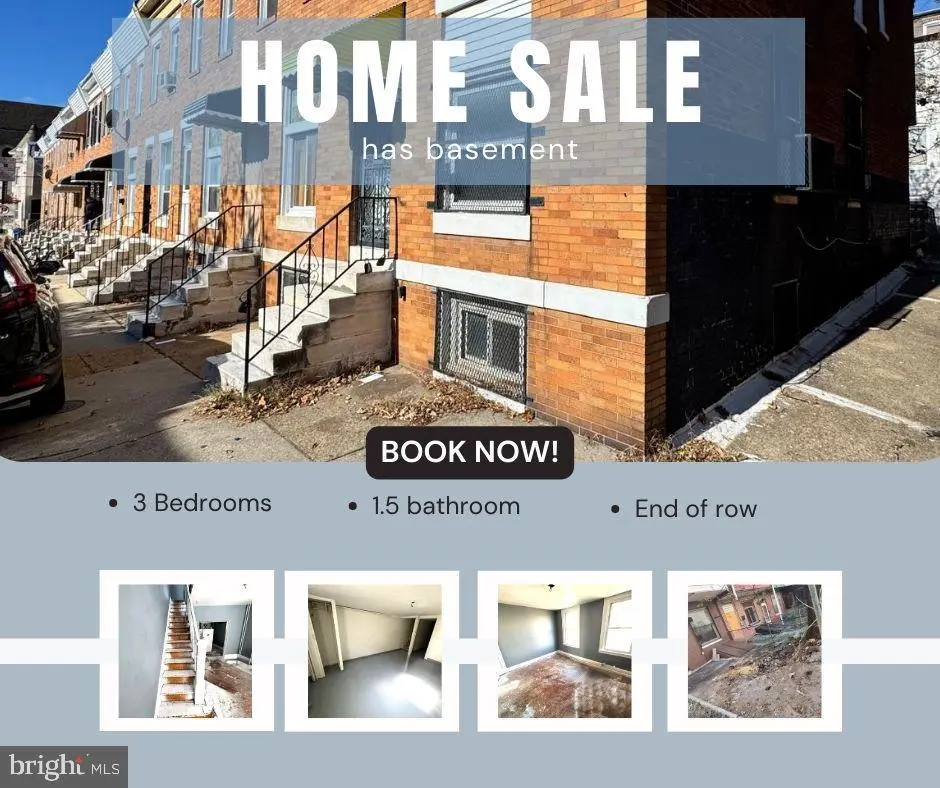
End-of-row home with incredible potential! This 3-bedroom property features a tall, stand-up basement, freshly painted walls, and a spacious backyard—perfect for outdoor living or future expansion. The owner began renovations but wasn’t able to finish, giving you the opportunity to complete it exactly the way you want. Located in a quiet, friendly neighborhood, this home is priced well below market value and truly priced to sell. Whether you’re an investor looking to add to your rental portfolio or a buyer who wants to own a home with a mortgage payment lower than rent, this is a rare opportunity you don’t want to miss.
Key facts
- Spacious backyard
- Stand-up basement
- Built 1936
Tags
Neighborhood map
What this means for you Summary
Snapshot
- This is a 3-bed/1.5-bath townhouse listed at $80k.
Deal economics
- At list price, monthly cash flow is $938 ($11k/yr) — positive.
- The deal already cash-flows at list — no discount required.
- Meets the 1% rule at list price ($2k rent vs $80k).
- Recommended offer: $70k (12.0% below list) — sets the bar for market timing.
- Cap rate 20.4% vs local median 6.0% in Baltimore — top-decile yield for the area; either an underpriced asset or a hidden risk that comps aren't pricing in. Stress-test before assuming the spread holds.
Location & tenants
- Location reads 76/100 on livability (#90 in MD, #3,396 nationally) — a middle-class / working-renter tenant base. Strengths: amenities A+, commute A+, housing A+; Watch: schools D, crime F.
- Baltimore City Public Schools (urban): math 7% / reading 16% proficiency, ranked #24 of 24 in MD (top 100%) — low school quality limits family demand, transient renter base, plan for 1-2y turnover; 79% free/reduced lunch — lower-income household profile, screen leases tightly.
- Market conditions: Rents rising fast (+5.2%/yr); 319 active listings in the ZIP; 7 comparable units currently listed for rent nearby; rentals at typical pace (median 24d on market — plan ~3-4 weeks tenant-placement turnaround); 43% of comp listings sitting > 30 days — soft ceiling on asking rent; 1,273 units permitted in Baltimore city in 2024 (1,104 in 5+ unit buildings).
- This rent runs 44% of the median local income ($51k/yr) — at the standard rent-burdened threshold; future hikes will face affordability resistance.
Forward outlook
- In year one you build about $98 of equity ($552 loan paydown + $-454 appreciation (-0.6% local appreciation)).
- Baltimore County population projected to shrink 4% by 2050 — rents likely to lag national; underwrite the cash flow, not the appreciation.
- At projected returns (-0.6% appreciation + 5.2% rent growth), your $22k cash investment doubles in ~2 years — after that, you're playing with house money.
Negotiation context
- It's been on market 206 days — a 12% lower offer ($70k) is reasonable based on typical stale-listing flexibility.
- 14 sale attempts since 27y ago; this cycle's ask has dropped $5k (6%) from the opening price — seller is motivated, your offer sets the floor, not the list.
- Current owner paid $57k; 40% above their basis — modest negotiation headroom, anchor on the comps not their cost.
Risks & watch-outs
- Watch-outs: built in 1936 — expect roof / HVAC / electrical / plumbing capex.
- Climate carrying-cost: major wind risk, 27% chance of damaging wind over 30y; extreme-heat days projected 7→15/yr by 2055 (HVAC capex compounding) — expect insurance premiums to compound above CPI over the hold.
Questions for the listing agent
- It's been on market 206 days. Have you received any prior offers? Is the seller open to a 12% concession, seller financing, or rate buy-down credit?
- Built in 1936 — when were the roof, HVAC, electrical panel, plumbing, and water heater last replaced?
- Why hasn't it sold? Are there any deal-killer items the seller is aware of (foundation, flood, title, zoning, code violations)?
- Is there a deadline driving the sale (1031 exchange, divorce, estate, relocation)? That informs how much negotiation room exists.
- Schools are D-rated, which usually means shorter tenancies and higher turnover. Who's the typical renter profile here, and what's been the actual vacancy rate?
- Crime grade is F in this area — have there been break-ins, vandalism, or insurance claims at this property in the last 3 years? What carrier currently insures it and at what premium?
- What's the average days-on-market for RENTAL listings here right now (not sales)? A rising rental-DOM trend means longer vacancies and softer asking-rent achievability than the comps imply.
- What's the recent tenant-quality profile in this submarket — average credit score on applications, eviction rate, late-payment / NSF rate, and stable-employment percentage? A property-management company in the area should have these aggregated.
- How much new for-sale + rental construction is in the pipeline within 1–3 miles? Heavy new supply typically softens prices + rents 12–24 months out; constrained supply supports both.
Investment metrics
- 1% rule
- 2.33% ✓
- Cap rate
- 20.39%
- Cash-on-cash
- 50.34%
- DSCR
- 3.24
- GRM
- 3.6
CMA / ARV
- ARV (median comp)
- $126,353
- List price
- $79,900
- Delta
- -36.76%
- Verdict
- UNDERPRICED
- Comps
- 20 within 1.0 mi
Show comp detail 4 sales within ~0.75 mi
| Address | Dist | Beds/Ba | Sqft | Sold | Price | $/sf | Match |
|---|---|---|---|---|---|---|---|
| 2305 Ashland Ave | 0.40mi | 3/1.0 | 616 (-14%) | 4mo | $78,000 | $127 | 54 |
| 506 N Patterson Park Ave | 0.65mi | 3/1.5 | 640 (-10%) | 8mo | $78,000 | $122 | 46 |
| 1614 N Port St | 0.34mi | 3/1.0 | 800 (+12%) | 20mo | $25,000 | $31 | 45 |
| 220 N Port St N | 0.74mi | 2/1.0 (-1) | 792 (+11%) | 15mo | $98,000 | $124 | 28 |
Match score weights: distance 35% · size 25% · config 20% · recency 20%. Top-matched comps best support the ARV.
Projected returns pro-forma
-0.57% appreciation · 5.25% rent growth · sell at horizon
- IRR
- 53.4%
- Equity multiple
- 3.67×
- Total profit
- $59,655
- Equity at exit
- $20,957
- IRR
- 57.3%
- Equity multiple
- 7.96×
- Total profit
- $155,682
- Equity at exit
- $23,464
Cash invested: $22,372 (down + closing). Projections, not guarantees.
Landlord ↔ Tenant lean methodology
- Overall (CITY)
- 12 Strongly Tenant-Friendly
- State Maryland
- 27 Tenant-Leaning · D+14
- County
- — inherits STATE
- City Baltimore
- 12 Strongly Tenant-Friendly · D+58
ZIP-level market 21213
- Home prices YoY
- -0.1%
- Rents YoY
- 5.2%
- Active inventory
- 319
- Price-to-rent
- 3.6×
Monthly cashflow live
- Estimated rent
- $1,864 high interval (Pro) →
- Mortgage (P&I)
- −$419
- Tax from tax record
- −$82 /mo · $986/yr
- Insurance
- −$33
- HOA
- −$0
- Vacancy / Maint / Mgmt
- −$392
- Net cashflow
- $938
Break-even live
UW: 25.0% down · 7.5% · 30yr · 1.5% tax · 5.0% vac · 8.0% maint · 8.0% mgmt
Financing live
Cash to close
- Down payment
- $19,975
- Closing costs
- $2,397
- Reserves months
- —
- Total cash needed
- —
Loan-product check · same deal, 3 products live
Conventional
25% down · 7.5% · 30yr
- Down + closing
- —
- Monthly P&I
- —
- Monthly cashflow
- —
- DSCR
- —
- Eligible?
- —
Personal DTI + credit; lowest rate.
DSCR
20% down · 8.5% · 30yr
- Down + closing
- —
- Monthly P&I
- —
- Monthly cashflow
- —
- DSCR
- —
- Eligible?
- —
No personal income docs; deal must DSCR.
Hard money
10% down · 12.0% · 12mo
- Down + closing
- —
- Monthly P&I
- —
- Monthly cashflow
- —
- DSCR
- —
- Eligible?
- —
Short-term bridge; refi at stabilization.
Rent comps 7 comps
| Address | Beds | Baths | Sqft | Rent | $/sqft | DOM | Units | Dist |
|---|---|---|---|---|---|---|---|---|
| 2410 E Federal St Baltimore, MD | 4.0 | 2.0 | 720 | $2,200 | $3.06 | 23d | 1 | 0.30mi |
| 2221 E Preston St Baltimore, MD | 2.0 | 1.0 | 658 | $1,200 | $1.82 | 23d | 1 | 0.35mi |
| 500 N Rose St Baltimore, MD | 3.0 | 2.0 | 520 | $1,200 | $2.31 | 4d | 1 | 0.62mi |
| 1607 Hakesley Pl Baltimore, MD | 3.0 | 1.0 | 720 | $1,400 | $1.94 | 43d | 1 | 0.86mi |
| 4300 Orchard Ridge Blvd Baltimore, MD | 1.0–3.0 | 1.0–2.0 | 1021 | $1,809 | $1.77 | 43d | 1 | 1.20mi |
| 520 Somerset St Baltimore, MD | 1.0–2.0 | 1.0–2.0 | 634 | $1,578 | $2.49 | 43d | 1 | 1.31mi |
| 305 S Collington Ave Baltimore, MD | 3.0 | 2.5 | 722 | $2,895 | $4.01 | 17d | 1 | 1.31mi |
Listing history 50 events
-
2026-06-18days on market $79,900 Active 206 DOM
-
2026-06-17days on market $79,900 Active 205 DOM
-
2026-06-16days on market $79,900 Active 204 DOM
-
2026-06-15days on market $79,900 Active 203 DOM
-
2026-06-13days on market $79,900 Active 201 DOM
-
2026-06-09days on market $79,900 Active 197 DOM
-
2026-06-08days on market $79,900 Active 196 DOM
-
2026-06-07days on market $79,900 Active 195 DOM
-
2026-06-04days on market $79,900 Active 192 DOM
-
2026-06-03days on market $79,900 Active 191 DOM
-
2026-06-02days on market $79,900 Active 190 DOM
-
2026-06-01days on market $79,900 Active 189 DOM
-
2026-05-31days on market $79,900 Active 188 DOM
-
2026-03-04price $79,900 651-char remark
Show marketing remark (651 chars)
End-of-row home with incredible potential! This 3-bedroom property features a tall, stand-up basement, freshly painted walls, and a spacious backyard—perfect for outdoor living or future expansion. The owner began renovations but wasn’t able to finish, giving you the opportunity to complete it exactly the way you want. Located in a quiet, friendly neighborhood, this home is priced well below market value and truly priced to sell. Whether you’re an investor looking to add to your rental portfolio or a buyer who wants to own a home with a mortgage payment lower than rent, this is a rare opportunity you don’t want to miss.
-
2025-11-24$85,000 Active 651-char remark
Show marketing remark (651 chars)
End-of-row home with incredible potential! This 3-bedroom property features a tall, stand-up basement, freshly painted walls, and a spacious backyard—perfect for outdoor living or future expansion. The owner began renovations but wasn’t able to finish, giving you the opportunity to complete it exactly the way you want. Located in a quiet, friendly neighborhood, this home is priced well below market value and truly priced to sell. Whether you’re an investor looking to add to your rental portfolio or a buyer who wants to own a home with a mortgage payment lower than rent, this is a rare opportunity you don’t want to miss.
-
2025-10-23historical
-
2025-10-03$85,900 Active
-
2025-09-13historical
-
2025-09-10price $81,999
-
2025-08-28price $84,999
-
2025-08-11$90,000 Active
-
2023-01-31soldstatus $56,966
-
2023-01-10soldstatus $115,000
-
2019-12-11soldstatus $63,900
-
2019-08-10soldstatus $60,000 Closed
-
2019-06-25$52,000 Active
-
2019-05-07historical
-
2019-04-26status Active
-
2019-03-21historical
-
2019-03-21status Active
-
2019-03-21historical
-
2018-04-17price $52,000
-
2018-04-17status Active
-
2018-04-09status Pending
-
2018-04-09historical
-
2018-04-04status Active
-
2018-03-27status Pending
-
2018-03-11$45,000 Active
-
2017-01-23historical
-
2017-01-23historical Expired
-
2016-04-23Active
-
2016-04-22$45,000
-
2015-06-11historical
-
2015-06-05soldstatus $17,400
-
2015-06-05soldstatus $17,400 Sold
-
2015-05-11status Contract
-
2015-03-11$14,800 Active
-
2015-03-11$14,800
-
2000-04-14soldstatus $17,500
-
2000-02-14historical
ⓘ Source: listings_history table (triggers on properties + properties_extension) + one-shot
backfill from property_details.listing_events for pre-trigger history.
Tax reassessment forecast MD · Partial reset (capped growth)
- Current annual tax
- $986 · $82/mo
- Projected year-2 tax
- $986 · $82/mo
- Expected delta
- $0/yr ($0/mo · 0.0%)
ⓘ Screening estimate from a state-policy table — verify with the county assessor before closing.
Climate risk First Street
- Flood 1/10 Low FEMA zone X (unshaded) · 0% chance over 30 yrs
- Wildfire 1/10 Low
- Heat 8/10 Severe 7 d/yr ≥103°F today · 15 d/yr by 30 yrs out
- Wind 6/10 Major 27% chance of damaging wind over 30 yrs
- Air quality 4/10 Moderate 6 unhealthy d/yr today · 7 by 30 yrs out
Nearby sold comps map
Loading sold comps map…
Walkable amenities ~0.75 mi
Loading nearby amenities…
Taxation est. · year 1
- Rental income
- $22,374
- − Mortgage interest
- −$4,476
- − Property taxes
- −$986
- − Insurance
- −$400
- − Repairs & maintenance
- −$1,790
- − Management
- −$1,790
- − Depreciation
- −$2,324
- Taxable income
- $10,608
- Est. tax owed @ 24.0%
- −$2,546
- After-tax cash flow
- $8,715/yr
For passive investors: Depreciation is non-cash, so a rental often shows a tax loss while cash-flowing — sheltering income. Rental losses are passive: they offset passive income freely, and up to $25,000/yr can offset ordinary (W-2) income if you actively participate and your MAGI is under $100k (phasing out to $0 by $150k); unused losses carry forward. On sale, claimed depreciation is recaptured at up to 25%, and gains may owe capital-gains tax (a 1031 exchange can defer both). Figures are a year-1 estimate at your 24.0% rate — not tax advice; consult a CPA.
Schools (NCES district)
- District
- Baltimore City Public Schools
- NCES district ID
- 2400090
- Math proficiency
- 7% ▼ -9.00%
- Reading proficiency
- 16% ▼ -5.00%
- Median HH income
- $42,108
- Composite
- 10.08/100
- National rank
- #9805
- State rank
- #24 of 24 in MD
Livability — Baltimore
- Score
- 76/100
- State rank
- #90
- US rank
- #3396
Category grades
Schools grade is shown separately in the Schools card above.
Census & demographics
- Census place
- Baltimore, MD
- County
- Baltimore City · 558,601 people
- City population
- 588,727
- Metro
- Baltimore-Columbia-Towson, MD
- Population (ZIP)
- 28,058
- Household income
- $51,344
- Rent vs Own
- Severe rent burden
- 1868.0
Population outlook (Baltimore County) Hauer SSP2
- Today (2025)
- 624,249 people
- By 2030
- 621,541 · -0.4%
- By 2040
- 609,756 · -2.3%
- By 2050
- 597,249 · -4.3%
- By 2075
- 552,236 · -11.5%
- By 2100
- 513,934 · -17.7%
Race, ethnicity, and origin ACS 2023
- Neighborhood character
- Predominantly Black (86%)
- Race & ethnicity
- Black 86% White 6% Hispanic / Latino 4% Two or more races 3%
- Foreign-born
- 3% · Canada
- Languages at home
- 96% English-only · Spanish 3%
Political lean MEDSL · Baltimore
- 2024 margin
- Solid D (+73.0) · D 85.2% · R 12.2% · Other 2.6%
- 2008→2024 swing
- -2.5pp toward R · 2008: 75.5pp · 2024: 73.0pp
- All cycles
- 2024: D+73.0 2020: D+76.6 2016: D+74.6 2012: D+76.4 2008: D+75.5
Not yet ingested
- Civics
- —
Market trends
- HPI YoY
- ▼ -0.57%
- Current HPI
- 427.4453
- Rent YoY
- ▲ 5.25%
- Metro
- Baltimore-Columbia-Towson, MD
- State GDP YoY
- ▲ 2.97%
- F500 in state
- 12
Industry mix (Fortune 500 HQ in MD)
| Industry | F500 HQs | Revenue |
|---|---|---|
| Aerospace / Defense | 1 | $71B |
|
||
| Utilities | 1 | $25B |
|
||
| Hotels | 1 | $24B |
|
||
| Consumer Goods | 1 | $7B |
|
||
| Real Estate | 1 | $6B |
|
||
| Chemicals | 1 | $2B |
|
||
Price history
+301.5% since first listed38 events — show timeline
- 2026-03-04 Price Changed $79,900 BRIGHT MLS
- 2025-11-24 Listed $85,000 BRIGHT MLS
- 2025-10-23 Listing Removed — BRIGHT MLS
- 2025-10-03 Listed $85,900 BRIGHT MLS
- 2025-09-13 Listing Removed — BRIGHT MLS
- 2025-09-10 Price Changed $81,999 BRIGHT MLS
- 2025-08-28 Price Changed $84,999 BRIGHT MLS
- 2025-08-11 Listed $90,000 BRIGHT MLS
- 2023-01-31 Sold (Public Records) $56,966 Public Records
- 2023-01-10 Sold (Public Records) $115,000 Public Records
- 2019-12-11 Sold (Public Records) $63,900 Public Records
- 2019-08-10 Sold (MLS) $60,000 BRIGHT MLS
- 2019-06-25 Listed $52,000 BRIGHT MLS
- 2019-05-07 Listing Removed — BRIGHT MLS
- 2019-04-26 Relisted — BRIGHT MLS
- 2019-03-21 Listing Removed — BRIGHT MLS
- 2019-03-21 Relisted — BRIGHT MLS
- 2019-03-21 Listing Removed — BRIGHT MLS
- 2018-04-17 Price Changed $52,000 BRIGHT MLS
- 2018-04-17 Relisted — BRIGHT MLS
- 2018-04-09 Pending — BRIGHT MLS
- 2018-04-09 Listing Removed — BRIGHT MLS
- 2018-04-04 Relisted — BRIGHT MLS
- 2018-03-27 Pending — BRIGHT MLS
- 2018-03-11 Listed $45,000 BRIGHT MLS
- 2017-01-23 Delisted — MRIS
- 2017-01-23 Listing Removed — BRIGHT MLS
- 2016-04-23 Listed — MRIS
- 2016-04-22 Listed $45,000 BRIGHT MLS
- 2015-06-11 Listing Removed — BRIGHT MLS
- 2015-06-05 Sold (MLS) $17,400 MRIS
- 2015-06-05 Sold (MLS) $17,400 BRIGHT MLS
- 2015-05-11 Pending — MRIS
- 2015-03-11 Listed $14,800 MRIS
- 2015-03-11 Listed $14,800 BRIGHT MLS
- 2000-04-14 Sold (MLS) $17,500 MRIS
- 2000-02-14 Delisted — MRIS
- 1999-10-08 Listed $19,900 MRIS
Property tax history
+5.2%/yrLatest (2025): $986 · +9.6% YoY. Source: county tax records.
Cash-flow waterfall
monthlySold comps — $/sqft
last 12 mo · ≤1 miLoading sold comps…