 Multi-family
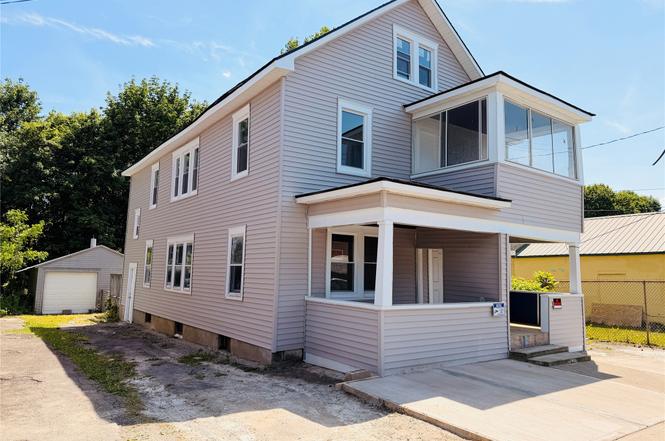
224 Corliss Ave · Johnson City, NY
Flood risk 8/10 · Major
- FEMA flood zone
- X
- Chance of flooding over 30 yrs
- 0.79%
- Est. flood insurance / yr
- $473 – $860
Fire risk 3/10 · Minor
- Est. fire insurance / yr
- $691 – $1,283
Heat risk 3/10 · Minor
- Hot days now (above 94°F)
- 8 days/yr
- Hot days in 30 yrs
- 17 days/yr
Wind risk 2/10 · Minimal
- Chance of severe wind over 30 yrs
- 1.0%
Air-quality risk 2/10 · Minimal
- Unhealthy air days now
- 0 days/yr
- Unhealthy air days in 30 yrs
- 1 days/yr
Risk factors via First Street. Map © Google.
Why this score? — see what drove the D grade
The composite is a weighted blend of 9 inputs, each scored 0–100. Each bar is that input's sub-score; the figure is the points it added to the 100-point composite (weight × sub-score).
- Appreciation +10.0/10.0
- ARV discount +7.5/15.0
- Cash flow +7.2/30.0
- Rent growth +4.9/5.0
- Livability +3.8/5.0
- Schools +3.3/10.0
- Condition / age +2.5/5.0
- 1% rule +2.1/10.0
- DSCR +1.4/10.0
$275,000
🖨 Deal sheet 📄 Offer letter ✓ Due diligence
Multi-family units
County records classify this as Multi-Family (2-4 Unit). Listing-text estimate: 1 unit. estimate disagrees with records
Listing remarks
Completely remodeled home in a prime location in Johnson City. This move-in-ready property features a new roof, new boiler, and new electrical panel, along with updates throughout the home. Conveniently located to the highway, hospitals, shopping, and restaurants, this home is great for a primary residence or investment.
Key facts
- New boiler
- Move-in-ready
- New electrical panel
Tags
Property features AI
Exterior
- Parking: Detached garage with 1 garage space
- Utilities: Public water; Public sewer
- Home design: Duplex; Residential income property; Level lot; Zoned UMF 2 family
- Construction: Vinyl siding; Block foundation
- Exterior features: Enclosed deck
Interior
- Kitchen: Range; Refrigerator
- Bedrooms: Two 2-bedroom units (each unit with 2 bedrooms)
- Flooring: Carpet; Hardwood
- Bathrooms: Two full bathrooms total; each unit has 1 bathroom
- Heating & cooling: Baseboard heating; No central cooling
- Interior features: Storm windows; Basement
- Laundry & utility: Gas water heater
Neighborhood map
What this means for you Summary
Snapshot
- This is a 4-bed/2.0-bath multifamily listed at $275k.
Deal economics
- At list price, monthly cash flow is $-429 ($-5k/yr) — negative.
- To cash-flow at today's rent, offer at most $199k (27.6% below list).
- To meet the 1% rule (rent ≥ 1% of price), the offer needs to be $196k (28.8% below list).
- Recommended offer: $196k (28.8% below list) — sets the bar for 1% rule.
- Cap rate 4.7% vs local median 6.2% in Johnson City — below-typical yield; the buyer is paying a premium for something (appreciation thesis, condition, location) that the cap rate doesn't capture.
Location & tenants
- Location reads 76/100 on livability (#238 in NY, #3,739 nationally) — a middle-class / working-renter tenant base. Strengths: cost of living A+, housing A+, health & safety A+; Watch: crime F, employment D-.
- Johnson City Central School District (suburban): math 38% / reading 41% proficiency, ranked #535 of 590 in NY (top 91%) — families likely to look elsewhere, expect single-tenant / working-renter base with shorter leases.
- Zoned schools: Johnson City Elementary/Primary School (496 students, 55% FRL) — zoned schools at 55% FRL track the district average.
- Market conditions: Rents rising fast (+9.5%/yr); 99 active listings in the ZIP; 4 comparable units currently listed for rent nearby; rentals at typical pace (median 21d on market — plan ~3-4 weeks tenant-placement turnaround); 340 units permitted in Broome County in 2024 (269 in 5+ unit buildings).
Forward outlook
- In year one you build about $29k of equity ($2k loan paydown + $28k appreciation (10.0% local appreciation)).
- Broome County population projected at -13% by 2050 — secular population decline; favor cash flow + early exit over multi-decade hold.
- By year 2, paydown + projected appreciation supports a ~$47k cash-out refi (75% LTV) — recoverable capital for the next deal without selling this one.
Negotiation context
- Only 8 days on market — expect competitive offers; lowballing is unlikely to land.
- 8 sale attempts since 11y ago with the ask held roughly flat each time — persistent listings suggest the price (not the market) is what's stuck; bring a comps-based counter.
- Current owner paid $46k; list at $275k implies a 491% gain — meaningful room to come down on a strong offer.
Risks & watch-outs
- Watch-outs: flood insurance adds $56/mo; built in 1940 — expect roof / HVAC / electrical / plumbing capex.
- Climate carrying-cost: severe flood risk — expect insurance premiums to compound above CPI over the hold.
Questions for the listing agent
- What do current leases actually rent for vs. the listed asking? Can we see a recent rent roll and the last 12 months of T-12 income?
- Built in 1940 — when were the roof, HVAC, electrical panel, plumbing, and water heater last replaced?
- What's the actual annual flood-insurance premium (NFIP or private), and is the property in a SFHA with mandatory coverage?
- Is there a deadline driving the sale (1031 exchange, divorce, estate, relocation)? That informs how much negotiation room exists.
- Crime grade is F in this area — have there been break-ins, vandalism, or insurance claims at this property in the last 3 years? What carrier currently insures it and at what premium?
- The area grade is low — what's the realistic commute time and amenity access for the typical tenant pool here? Any planned neighborhood developments (good or bad) we should know about?
- What's the average days-on-market for RENTAL listings here right now (not sales)? A rising rental-DOM trend means longer vacancies and softer asking-rent achievability than the comps imply.
- What's the recent tenant-quality profile in this submarket — average credit score on applications, eviction rate, late-payment / NSF rate, and stable-employment percentage? A property-management company in the area should have these aggregated.
- How much new apartment / multifamily construction is in the pipeline within 1–3 miles? Heavy new supply (>2% of stock underway) typically softens rents 12–24 months out; light construction supports rent growth.
Investment metrics
- 1% rule
- 0.71% ✗
- Cap rate
- 4.66%
- Cash-on-cash
- -5.82%
- DSCR
- 0.74
- GRM
- 11.7
CMA / ARV
- ARV (on-the-fly)
- $95,760
- Comps found
- 3
Show comp detail 3 sales within ~0.75 mi
| Address | Dist | Beds/Ba | Sqft | Sold | Price | $/sf | Match |
|---|---|---|---|---|---|---|---|
| 28 St Charles St | 0.23mi | 4/2.0 | 2,602 (+3%) | 22mo | $100,000 | $38 | 66 |
| 203 Hudson St | 0.24mi | 3/3.0 (-1) | 2,206 (-12%) | 8mo | $54,000 | $24 | 52 |
| 210 Baldwin St | 0.31mi | 4/2.0 | 2,142 (-15%) | 13mo | $130,000 | $61 | 49 |
Match score weights: distance 35% · size 25% · config 20% · recency 20%. Top-matched comps best support the ARV.
Projected returns pro-forma
10.0% appreciation · 8.0% rent growth · sell at horizon
- IRR
- 21.0%
- Equity multiple
- 2.73×
- Total profit
- $132,866
- Equity at exit
- $247,742
- IRR
- 20.2%
- Equity multiple
- 6.70×
- Total profit
- $438,560
- Equity at exit
- $534,265
Cash invested: $77,000 (down + closing). Projections, not guarantees.
Landlord ↔ Tenant lean methodology
- Overall (STATE)
- 15 Strongly Tenant-Friendly
- State New York
- 15 Strongly Tenant-Friendly · D+10
- County
- — inherits STATE
- City
- — inherits STATE
ZIP-level market 13790
- Home prices YoY
- 6.8%
- Rents YoY
- 9.5%
- Active inventory
- 99
- Price-to-rent
- 11.7×
Monthly cashflow live
- Estimated rent
- $1,959 medium interval (Pro) →
- Mortgage (P&I)
- −$1,442
- Tax from tax record
- −$364 /mo · $4,372/yr
- Insurance
- −$115
- Flood insurance flood zone
- −$56 /mo · $666/yr
- HOA
- −$0
- Vacancy / Maint / Mgmt
- −$411
- Net cashflow
- $-429
Break-even live
UW: 25.0% down · 7.5% · 30yr · 1.5% tax · 5.0% vac · 8.0% maint · 8.0% mgmt
Financing live
Cash to close
- Down payment
- $68,750
- Closing costs
- $8,250
- Reserves months
- —
- Total cash needed
- —
Loan-product check · same deal, 3 products live
Conventional
25% down · 7.5% · 30yr
- Down + closing
- —
- Monthly P&I
- —
- Monthly cashflow
- —
- DSCR
- —
- Eligible?
- —
Personal DTI + credit; lowest rate.
DSCR
20% down · 8.5% · 30yr
- Down + closing
- —
- Monthly P&I
- —
- Monthly cashflow
- —
- DSCR
- —
- Eligible?
- —
No personal income docs; deal must DSCR.
Hard money
10% down · 12.0% · 12mo
- Down + closing
- —
- Monthly P&I
- —
- Monthly cashflow
- —
- DSCR
- —
- Eligible?
- —
Short-term bridge; refi at stabilization.
Rent comps 4 comps
| Address | Beds | Baths | Sqft | Rent | $/sqft | DOM | Units | Dist |
|---|---|---|---|---|---|---|---|---|
| 57 Fowler Ave Johnson City, NY | 3.0 | 2.5 | 2497 | $2,000 | $0.80 | 13d | 1 | 0.78mi |
| 4 Baxter St Unit Left Binghamton, NY | 4.0 | 2.5 | 1800 | $1,500 | $0.83 | 13d | 1 | 1.25mi |
| 74 Matthews St Binghamton, NY | 3.0 | 2.0 | 2510 | $2,300 | $0.92 | 21d | 1 | 1.27mi |
| 129 Helen St Unit 1 Binghamton, NY | 4.0 | 2.0 | 1850 | $2,200 | $1.19 | 44d | 1 | 1.29mi |
Listing history 8 events
-
2026-06-19days on market $275,000 Active 8 DOM
-
2026-06-18days on market $275,000 Active 7 DOM
-
2026-06-17days on market $275,000 Active 6 DOM
-
2026-06-16days on market $275,000 Active 5 DOM
-
2026-06-15days on market $275,000 Active 4 DOM
-
2026-06-14days on market $275,000 Active 2 DOM
-
2026-06-13remarks 322-char remark
-
2026-06-13$275,000 Active 1 DOM
ⓘ Source: listings_history table (triggers on properties + properties_extension) + one-shot
backfill from property_details.listing_events for pre-trigger history.
Tax reassessment forecast NY · Partial reset (capped growth)
- Current annual tax
- $4,372 · $364/mo
- Projected year-2 tax
- $4,510 · $376/mo
- Expected delta
- +$138/yr (+$11/mo · 3.2%)
ⓘ Screening estimate from a state-policy table — verify with the county assessor before closing.
Climate risk First Street
- Flood 8/10 Severe FEMA zone X · 79% chance over 30 yrs
- Wildfire 3/10 Moderate
- Heat 3/10 Moderate 8 d/yr ≥94°F today · 17 d/yr by 30 yrs out
- Wind 2/10 Low 100% chance of damaging wind over 30 yrs
- Air quality 2/10 Low 0 unhealthy d/yr today · 1 by 30 yrs out
Nearby sold comps map
Loading sold comps map…
Walkable amenities ~0.75 mi
Loading nearby amenities…
Taxation est. · year 1
- Rental income
- $23,505
- − Mortgage interest
- −$15,404
- − Property taxes
- −$4,372
- − Insurance
- −$2,042
- − Repairs & maintenance
- −$1,880
- − Management
- −$1,880
- − Depreciation
- −$8,000
- Taxable loss
- −$10,073
- Est. tax savings @ 24.0%
- +$2,418
- After-tax cash flow
- $-2,732/yr
For passive investors: Depreciation is non-cash, so a rental often shows a tax loss while cash-flowing — sheltering income. Rental losses are passive: they offset passive income freely, and up to $25,000/yr can offset ordinary (W-2) income if you actively participate and your MAGI is under $100k (phasing out to $0 by $150k); unused losses carry forward. On sale, claimed depreciation is recaptured at up to 25%, and gains may owe capital-gains tax (a 1031 exchange can defer both). Figures are a year-1 estimate at your 24.0% rate — not tax advice; consult a CPA.
Schools (NCES district)
- District
- Johnson City Central School District
- NCES district ID
- 3615900
- Math proficiency
- 38% ▼ -8.00%
- Reading proficiency
- 41% ▲ 2.00%
- Median HH income
- $40,514
- Composite
- 33.17/100
- National rank
- #5545
- State rank
- #535 of 590 in NY
Livability — Johnson City
- Score
- 76/100
- State rank
- #238
- US rank
- #3739
Category grades
Schools grade is shown separately in the Schools card above.
Census & demographics
- Census place
- Johnson City, NY
- County
- Broome County · 126,805 people
- City population
- 18,739
- Metro
- Binghamton, NY
- Population (ZIP)
- 18,739
- Household income
- $59,045
- Rent vs Own
- Severe rent burden
- 1233.0
Population outlook (Broome County) Hauer SSP2
- Today (2025)
- 187,989 people
- By 2030
- 183,066 · -2.6%
- By 2040
- 172,228 · -8.4%
- By 2050
- 163,161 · -13.2%
- By 2075
- 153,641 · -18.3%
- By 2100
- 140,851 · -25.1%
Race, ethnicity, and origin ACS 2023
- Neighborhood character
- Predominantly White (75%)
- Race & ethnicity
- White 75% Two or more races 9% Asian 8% Black 6% Hispanic / Latino 4%
- Common ancestry
- Romanian 6% Lithuanian 3% Scotch-Irish 2%
- Foreign-born
- 9% · Canada, China, Vietnam
- Languages at home
- 88% English-only · Other Indo-European 4% French/Haitian/Cajun 2% Spanish 2%
Political lean MEDSL · Broome
- 2024 margin
- Toss-up / Even · D 50.2% · R 49.8%
- 2008→2024 swing
- -7.6pp toward R · 2008: 8.0pp · 2024: 0.4pp
- All cycles
- 2024: D+0.4 2020: D+3.5 2016: R+3.7 2012: D+4.6 2008: D+8.0
Not yet ingested
- Civics
- —
Market trends
- HPI YoY
- ▲ 18.06%
- Current HPI
- 285.3668
- Rent YoY
- ▲ 9.47%
- Metro
- Binghamton, NY
- State GDP YoY
- ▲ 2.60%
- F500 in state
- 92
Industry mix (Fortune 500 HQ in NY)
| Industry | F500 HQs | Revenue |
|---|---|---|
| Financial Services | 10 | $950B |
|
||
| Consumer Goods | 9 | $162B |
|
||
| Insurance | 4 | $225B |
|
||
| Telecommunications | 2 | $144B |
|
||
| Pharmaceuticals | 2 | $112B |
|
||
| Media / Entertainment | 2 | $69B |
|
||
Price history
+685.7% since first listed14 events — show timeline
- 2026-06-11 Listed $275,000 GBAOR
- 2024-10-03 Sold (Public Records) $46,500 Public Records
- 2019-07-24 Sold (MLS) — ODBOR
- 2019-07-24 Listing Removed — UNYREIS
- 2019-07-09 Listed $32,900 ODBOR
- 2019-07-09 Listed $32,900 UNYREIS
- 2019-06-10 Listed $30,900 UNYREIS
- 2019-03-29 Listed $32,900 UNYREIS
- 2019-03-28 Listing Removed — UNYREIS
- 2018-09-28 Listed $35,900 UNYREIS
- 2018-02-28 Listed $42,900 GBAOR
- 2015-06-09 Listed $37,500 GBAOR
- 2005-08-09 Sold (Public Records) $50,000 Public Records
- 1999-01-05 Sold (Public Records) $35,000 Public Records
Property tax history
+2.2%/yrLatest (2025): $4,372 · +1.7% YoY. Source: county tax records.
Cash-flow waterfall
monthlySold comps — $/sqft
last 12 mo · ≤1 miLoading sold comps…