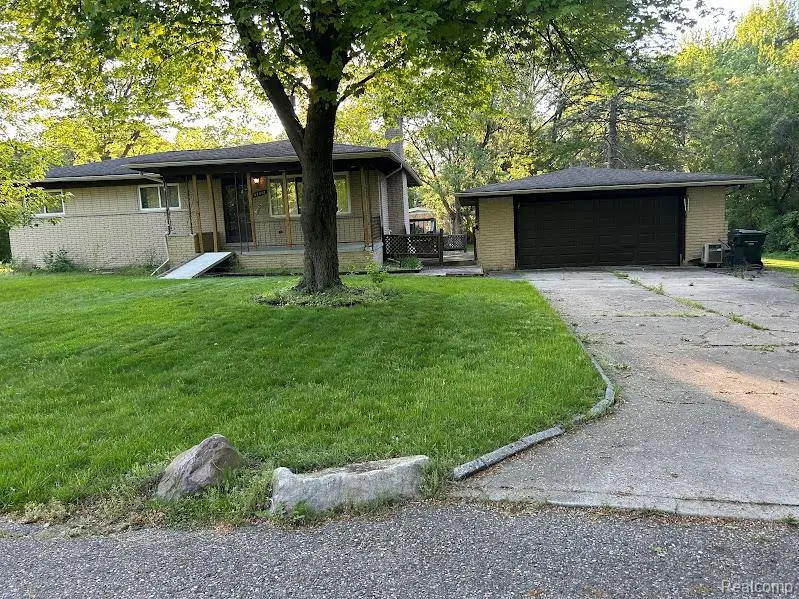
52412 Pappy Ln · Shelby, MI
Flood risk 1/10 · Minimal
- FEMA flood zone
- X (unshaded)
- Chance of flooding over 30 yrs
- 0.0%
- Est. flood insurance / yr
- $473 – $860
Fire risk 3/10 · Minor
- Est. fire insurance / yr
- $784 – $1,456
Heat risk 2/10 · Minimal
- Hot days now (above 97°F)
- 7 days/yr
- Hot days in 30 yrs
- 15 days/yr
Wind risk 1/10 · Minimal
- Chance of severe wind over 30 yrs
- —
Air-quality risk 3/10 · Minor
- Unhealthy air days now
- 2 days/yr
- Unhealthy air days in 30 yrs
- 4 days/yr
Risk factors via First Street. Map © Google.
Why this score? — see what drove the B+ grade
The composite is a weighted blend of 9 inputs, each scored 0–100. Each bar is that input's sub-score; the figure is the points it added to the 100-point composite (weight × sub-score).
- Cash flow +30.0/30.0
- ARV discount +15.0/15.0
- DSCR +10.0/10.0
- 1% rule +9.0/10.0
- Schools +4.1/10.0
- Livability +3.5/5.0
- Rent growth +2.5/5.0
- Condition / age +2.5/5.0
- Appreciation +0.0/10.0
$225,000
🖨 Deal sheet 📄 Offer letter ✓ Due diligence
Listing remarks MLS
Huge lot w/ North Branch Creek running through property. Call listing broker for more details.
Key facts
- North branch creek
- Huge lot
- 0.34 acre lot
Tags
Property features AI
Exterior
- Parking: Detached garage with approximately 2.5 parking spaces
- Utilities: Natural gas; Public water; Septic
- Home design: Residential single-story home; Built in 1960
- Construction: Brick construction; Basement foundation; Year built 1960
- Exterior features: Brick exterior; Shed on property; Paved street access; Frontage ~141 feet; Approximately 0.34 acre lot
Interior
- Kitchen: Kitchen on entry level (approx. 17 x 10)
- Bedrooms: Three bedrooms on entry level (approx. 13 x 10, 13 x 10, ~10 wide)
- Bathrooms: One full bathroom and one lavatory (two total), both on entry level
- Heating & cooling: Forced air heating; Central air conditioning; Ceiling fans; Attic fan
- Interior features: Total of 7 rooms; Finished basement
- Laundry & utility: Basement access (finished)
Neighborhood map
What this means for you Summary
Snapshot
- This is a 3-bed/1.5-bath single-family listed at $225k.
Deal economics
- At list price, monthly cash flow is $955 ($11k/yr) — positive.
- The deal already cash-flows at list — no discount required.
- Meets the 1% rule at list price ($3k rent vs $225k).
- Cap rate 11.4% vs local median 3.2% in Shelby — top-decile yield for the area; either an underpriced asset or a hidden risk that comps aren't pricing in. Stress-test before assuming the spread holds.
Location & tenants
- Location reads 70/100 on livability (#324 in MI) — a middle-class / working-renter tenant base. Strengths: crime A+, cost of living A+, housing A+; Watch: employment D+, schools F, amenities F.
- Utica Community Schools (suburban): math 38% / reading 53% proficiency, ranked #126 of 540 in MI (top 23%) — families likely to look elsewhere, expect single-tenant / working-renter base with shorter leases.
- Market conditions: 167 active listings in the ZIP; 2 comparable units currently listed for rent nearby; 1,321 units permitted in Macomb County in 2024 (86 in 5+ unit buildings).
Forward outlook
- Local home prices are declining (-3.0%/yr); year-one equity from $2k of loan paydown is wiped out by about $7k of value loss. Plan a longer hold.
- Macomb County population projected at +9% by 2050 — modest demand growth; plan on rents tracking national, not racing it.
- At projected returns (-3.0% appreciation + 3.0% rent growth), your $63k cash investment doubles in ~7 years — after that, you're playing with house money.
Negotiation context
- Only 4 days on market — expect competitive offers; lowballing is unlikely to land.
- 3 sale attempts since 25y ago with the ask held roughly flat each time — persistent listings suggest the price (not the market) is what's stuck; bring a comps-based counter.
- Current owner paid $176k; 28% above their basis — modest negotiation headroom, anchor on the comps not their cost.
Questions for the listing agent
- Built in 1960 — when were the roof, HVAC, electrical panel, plumbing, and water heater last replaced?
- Is there a deadline driving the sale (1031 exchange, divorce, estate, relocation)? That informs how much negotiation room exists.
- Schools are F-rated, which usually means shorter tenancies and higher turnover. Who's the typical renter profile here, and what's been the actual vacancy rate?
- What's the average days-on-market for RENTAL listings here right now (not sales)? A rising rental-DOM trend means longer vacancies and softer asking-rent achievability than the comps imply.
- What's the recent tenant-quality profile in this submarket — average credit score on applications, eviction rate, late-payment / NSF rate, and stable-employment percentage? A property-management company in the area should have these aggregated.
- How much new for-sale + rental construction is in the pipeline within 1–3 miles? Heavy new supply typically softens prices + rents 12–24 months out; constrained supply supports both.
Investment metrics
- 1% rule
- 1.40% ✓
- Cap rate
- 11.39%
- Cash-on-cash
- 18.19%
- DSCR
- 1.81
- GRM
- 6.0
CMA / ARV
- ARV (on-the-fly)
- $287,385
- Comps found
- 7
Show comp detail 7 sales within ~0.75 mi
| Address | Dist | Beds/Ba | Sqft | Sold | Price | $/sf | Match |
|---|---|---|---|---|---|---|---|
| 52742 Pappy Ln | 0.23mi | 3/1.5 | 1,189 (+6%) | 1mo | $365,000 | $307 | 79 |
| 53333 Aulgur Dr | 0.49mi | 3/1.5 | 1,099 (-2%) | 10mo | $337,500 | $307 | 65 |
| 53432 Bruce Hill Dr | 0.50mi | 3/1.5 | 1,256 (+11%) | 1mo | $365,000 | $291 | 56 |
| 4625 Maeder St | 0.49mi | 3/1.0 | 1,150 (+2%) | 23mo | $250,000 | $217 | 52 |
| 3880 24 Mile Rd | 0.30mi | 3/1.0 | 1,019 (-10%) | 21mo | $260,000 | $255 | 50 |
| 51270 Shelby Rd | 0.66mi | 3/1.0 | 1,053 (-7%) | 18mo | $258,000 | $245 | 41 |
| 4224 23 Mile Rd | 0.72mi | 3/1.5 | 1,008 (-11%) | 11mo | $240,000 | $238 | 39 |
Match score weights: distance 35% · size 25% · config 20% · recency 20%. Top-matched comps best support the ARV.
Projected returns pro-forma
-3.0% appreciation · 3.0% rent growth · sell at horizon
- IRR
- 9.8%
- Equity multiple
- 1.39×
- Total profit
- $24,389
- Equity at exit
- $33,548
- IRR
- 19.0%
- Equity multiple
- 2.58×
- Total profit
- $99,672
- Equity at exit
- $19,454
Cash invested: $63,000 (down + closing). Projections, not guarantees.
Landlord ↔ Tenant lean methodology
- Overall (STATE)
- 62 Landlord-Friendly
- State Michigan
- 62 Landlord-Friendly · EVEN
- County
- — inherits STATE
- City
- — inherits STATE
ZIP-level market 48316
- Active inventory
- 167
- Price-to-rent
- 6.0×
Monthly cashflow live
- Estimated rent
- $3,141 medium interval (Pro) →
- Mortgage (P&I)
- −$1,180
- Tax from tax record
- −$253 /mo · $3,035/yr
- Insurance
- −$94
- HOA
- −$0
- Vacancy / Maint / Mgmt
- −$660
- Net cashflow
- $955
Break-even live
UW: 25.0% down · 7.5% · 30yr · 1.5% tax · 5.0% vac · 8.0% maint · 8.0% mgmt
Financing live
Cash to close
- Down payment
- $56,250
- Closing costs
- $6,750
- Reserves months
- —
- Total cash needed
- —
Loan-product check · same deal, 3 products live
Conventional
25% down · 7.5% · 30yr
- Down + closing
- —
- Monthly P&I
- —
- Monthly cashflow
- —
- DSCR
- —
- Eligible?
- —
Personal DTI + credit; lowest rate.
DSCR
20% down · 8.5% · 30yr
- Down + closing
- —
- Monthly P&I
- —
- Monthly cashflow
- —
- DSCR
- —
- Eligible?
- —
No personal income docs; deal must DSCR.
Hard money
10% down · 12.0% · 12mo
- Down + closing
- —
- Monthly P&I
- —
- Monthly cashflow
- —
- DSCR
- —
- Eligible?
- —
Short-term bridge; refi at stabilization.
Rent comps 2 comps
| Address | Beds | Baths | Sqft | Rent | $/sqft | DOM | Units | Dist |
|---|---|---|---|---|---|---|---|---|
| 1880 E Avon Rd Rochester Hills, MI | 2.0 | 2.0 | 1294 | $4,470 | $3.45 | 1d | 1 | 1.35mi |
| 1908 Flagstone Cir Rochester, MI | 2.0 | 2.0 | 1338 | $1,750 | $1.31 | 4d | 1 | 1.37mi |
Listing history 6 events
-
2026-06-18days on market $225,000 Active 4 DOM
-
2026-06-17days on market $225,000 Active 3 DOM
-
2026-06-16days on market $225,000 Active 2 DOM
-
2026-06-15$225,000 Active 1 DOM
-
2026-06-15remarks 94-char remark
-
2026-06-15$225,000 Active 1 DOM
ⓘ Source: listings_history table (triggers on properties + properties_extension) + one-shot
backfill from property_details.listing_events for pre-trigger history.
Tax reassessment forecast MI · Partial reset (capped growth)
- Current annual tax
- $3,035 · $253/mo
- Projected year-2 tax
- $3,250 · $271/mo
- Expected delta
- +$215/yr (+$18/mo · 7.1%)
ⓘ Screening estimate from a state-policy table — verify with the county assessor before closing.
Climate risk First Street
- Flood 1/10 Low FEMA zone X (unshaded) · 0% chance over 30 yrs
- Wildfire 3/10 Moderate
- Heat 2/10 Low 7 d/yr ≥97°F today · 15 d/yr by 30 yrs out
- Wind 1/10 Low
- Air quality 3/10 Moderate 2 unhealthy d/yr today · 4 by 30 yrs out
Nearby sold comps map
Loading sold comps map…
Walkable amenities ~0.75 mi
Loading nearby amenities…
Taxation est. · year 1
- Rental income
- $37,694
- − Mortgage interest
- −$12,603
- − Property taxes
- −$3,035
- − Insurance
- −$1,125
- − Repairs & maintenance
- −$3,016
- − Management
- −$3,016
- − Depreciation
- −$6,545
- Taxable income
- $8,354
- Est. tax owed @ 24.0%
- −$2,005
- After-tax cash flow
- $9,454/yr
For passive investors: Depreciation is non-cash, so a rental often shows a tax loss while cash-flowing — sheltering income. Rental losses are passive: they offset passive income freely, and up to $25,000/yr can offset ordinary (W-2) income if you actively participate and your MAGI is under $100k (phasing out to $0 by $150k); unused losses carry forward. On sale, claimed depreciation is recaptured at up to 25%, and gains may owe capital-gains tax (a 1031 exchange can defer both). Figures are a year-1 estimate at your 24.0% rate — not tax advice; consult a CPA.
Schools (NCES district)
- District
- Utica Community Schools
- NCES district ID
- 2634470
- Math proficiency
- 38% ▼ -13.00%
- Reading proficiency
- 53% ▼ -7.00%
- Median HH income
- $65,953
- Composite
- 40.52/100
- National rank
- #3709
- State rank
- #126 of 540 in MI
Livability — Shelby
- Score
- 70/100
- State rank
- #324
- US rank
- #7973
Category grades
Schools grade is shown separately in the Schools card above.
Census & demographics
- Population (ZIP)
- 28,355
Population outlook (Macomb County) Hauer SSP2
- Today (2025)
- 925,296 people
- By 2030
- 948,226 · +2.5%
- By 2040
- 983,961 · +6.3%
- By 2050
- 1,010,200 · +9.2%
- By 2075
- 1,076,222 · +16.3%
- By 2100
- 1,077,065 · +16.4%
Race, ethnicity, and origin ACS 2023
- Neighborhood character
- Predominantly White (89%)
- Race & ethnicity
- White 89% Hispanic / Latino 3% Two or more races 3% Asian 3% Black 2%
- Common ancestry
- Romanian 16% Lithuanian 4% Slovak 3%
- Foreign-born
- 12% · Canada, China, South Korea
- Languages at home
- 83% English-only · Other Indo-European 6% Russian/Polish/Slavic 4% Spanish 2%
Political lean MEDSL · Macomb
- 2024 margin
- R (+13.7) · D 42.2% · R 55.9% · Other 1.9%
- 2008→2024 swing
- -22.3pp toward R · 2008: 8.6pp · 2024: -13.7pp
- All cycles
- 2024: R+13.7 2020: R+8.1 2016: R+11.6 2012: D+4.0 2008: D+8.6
Not yet ingested
- Civics
- —
Market trends
- HPI YoY
- ▼ -200.39%
- Current HPI
- 186.8397
- Rent YoY
- —
- Metro
- —
- State GDP YoY
- ▲ 1.37%
- F500 in state
- 28
Industry mix (Fortune 500 HQ in MI)
| Industry | F500 HQs | Revenue |
|---|---|---|
| Automotive Parts | 3 | $48B |
|
||
| Automotive | 2 | $372B |
|
||
| Chemicals | 1 | $45B |
|
||
| Automotive Retail | 1 | $29B |
|
||
| Healthcare / Medical Devices | 1 | $23B |
|
||
| Automotive Technology | 1 | $20B |
|
||
Price history
+120.6% since first listed7 events — show timeline
- 2026-06-14 Listed $225,000 REALCOMP
- 2026-06-14 Listed $225,000 MiRealSource-MiMLS
- 2002-03-12 Sold (Public Records) $176,130 Public Records
- 2001-12-04 Sold (MLS) $176,130 MiRealSource-MiMLS
- 2001-10-19 Listing Removed — MiRealSource-MiMLS
- 2001-10-15 Listed $174,900 MiRealSource-MiMLS
- 1990-10-02 Sold (Public Records) $102,000 Public Records
Property tax history
-1.2%/yrLatest (2025): $3,035 · -0.2% YoY. Source: county tax records.
Cash-flow waterfall
monthlySold comps — $/sqft
last 12 mo · ≤1 miLoading sold comps…