2517 W Hefner Rd · Oklahoma City, OK
Flood risk No data
- FEMA flood zone
- —
- Chance of flooding over 30 yrs
- —
- Est. flood insurance / yr
- —
Fire risk No data
- Est. fire insurance / yr
- —
Heat risk No data
- Hot days now (above threshold)
- —
- Hot days in 30 yrs
- —
Wind risk No data
- Chance of severe wind over 30 yrs
- —
Air-quality risk No data
- Unhealthy air days now
- —
- Unhealthy air days in 30 yrs
- —
Risk factors via First Street. Map © Google.
Why this score? — see what drove the D+ grade
The composite is a weighted blend of 9 inputs, each scored 0–100. Each bar is that input's sub-score; the figure is the points it added to the 100-point composite (weight × sub-score).
- ARV discount +15.0/15.0
- Cash flow +14.7/30.0
- 1% rule +4.8/10.0
- DSCR +4.5/10.0
- Livability +4.0/5.0
- Rent growth +3.0/5.0
- Condition / age +2.5/5.0
- Schools +0.7/10.0
- Appreciation +0.0/10.0
$145,000
🖨 Deal sheet 📄 Offer letter ✓ Due diligence
Listing remarks MLS
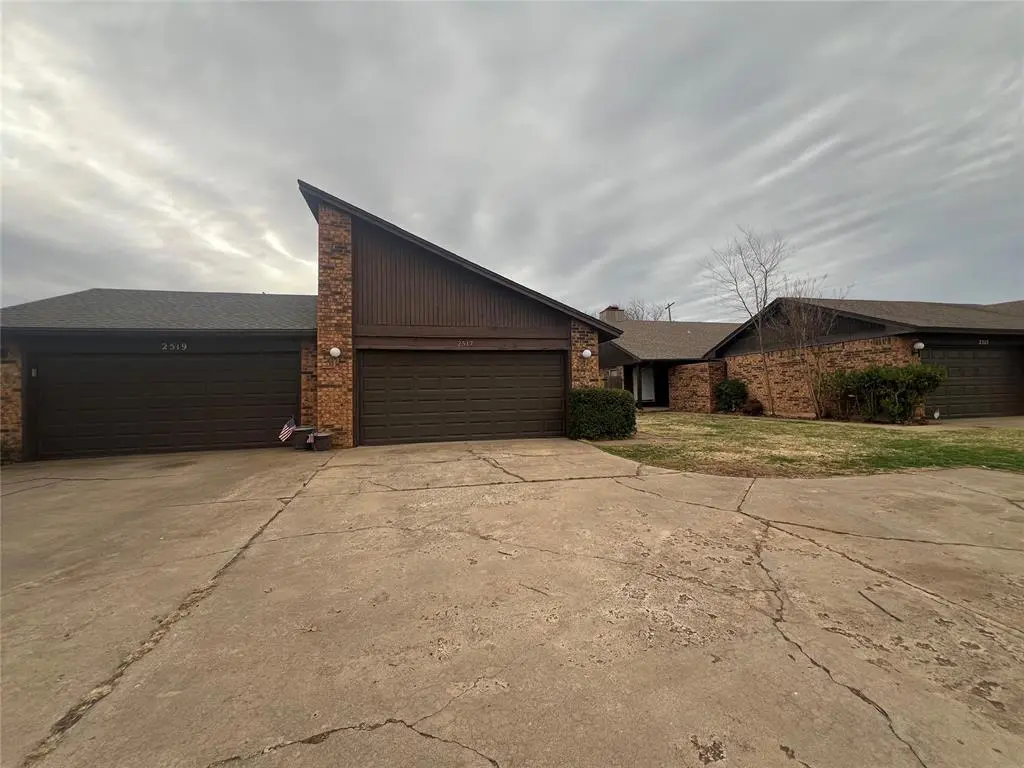
As-Is Half Duplex Near Lake Hefner – Priced Below Market! Located just minutes from Lake Hefner and convenient shopping in The Village, this 2-bedroom, 2-bath half duplex offers a great opportunity for buyers looking to add their personal touch. The home features tile flooring and carpet throughout, a spacious primary bedroom, and a second well-sized bedroom. Enjoy a comfortable living room along with a functional kitchen and dining area, perfect for everyday living. Priced below market value to allow room for updates — a fantastic investment or owner-occupant opportunity!
Key facts
- Functional kitchen
- Dining area
- Tile flooring
Tags
Neighborhood map
What this means for you Summary
Snapshot
- This is a 2-bed/2.0-bath condo listed at $145k.
Deal economics
- At list price, monthly cash flow is $37 ($441/yr) — positive.
- The deal already cash-flows at list — no discount required.
- To meet the 1% rule (rent ≥ 1% of price), the offer needs to be $143k (1.7% below list).
- Recommended offer: $132k (9.0% below list) — sets the bar for market timing.
- Cap rate 6.6% vs local median 3.7% in Oklahoma City — top-decile yield for the area; either an underpriced asset or a hidden risk that comps aren't pricing in. Stress-test before assuming the spread holds.
Location & tenants
- Location reads 80/100 on livability (#3 in OK, #1,635 nationally) — a professional / high-income tenant draw. Strengths: amenities A+, commute A+, cost of living A+; Watch: schools F, crime F.
- Oklahoma City (urban): math 7% / reading 10% proficiency, ranked #254 of 270 in OK (top 94%) — low school quality limits family demand, transient renter base, plan for 1-2y turnover; 82% free/reduced lunch — lower-income household profile, screen leases tightly.
- Market conditions: Rents rising (+2.0%/yr); 333 active listings in the ZIP; 40 comparable units currently listed for rent nearby; rentals at typical pace (median 21d on market — plan ~3-4 weeks tenant-placement turnaround); 5,365 units permitted in Oklahoma County in 2024 (569 in 5+ unit buildings).
Forward outlook
- Local home prices are declining (-3.0%/yr); year-one equity from $1k of loan paydown is wiped out by about $4k of value loss. Plan a longer hold.
- Oklahoma County population projected at +41% by 2050 — long-run rental-demand tailwind backs the buy-and-hold thesis.
Negotiation context
- It's been on market 115 days — a 9% lower offer ($132k) is reasonable based on typical stale-listing flexibility.
- Current owner paid $65k; list at $145k implies a 123% gain — meaningful room to come down on a strong offer.
Questions for the listing agent
- It's been on market 115 days. Have you received any prior offers? Is the seller open to a 9% concession, seller financing, or rate buy-down credit?
- Built in 1978 — when were the roof, HVAC, electrical panel, plumbing, and water heater last replaced?
- What does the HOA fee cover, when was the last increase, and are there any pending special assessments or reserve-fund shortfalls?
- Any open or pending special assessments — roof, HVAC, plumbing, elevator, façade? What's the per-unit balance and payoff schedule, and is the seller paying it off at close or rolling it to the buyer?
- Why hasn't it sold? Are there any deal-killer items the seller is aware of (foundation, flood, title, zoning, code violations)?
- Is there a deadline driving the sale (1031 exchange, divorce, estate, relocation)? That informs how much negotiation room exists.
- Schools are F-rated, which usually means shorter tenancies and higher turnover. Who's the typical renter profile here, and what's been the actual vacancy rate?
- Crime grade is F in this area — have there been break-ins, vandalism, or insurance claims at this property in the last 3 years? What carrier currently insures it and at what premium?
- The area grade is low — what's the realistic commute time and amenity access for the typical tenant pool here? Any planned neighborhood developments (good or bad) we should know about?
- What's the average days-on-market for RENTAL listings here right now (not sales)? A rising rental-DOM trend means longer vacancies and softer asking-rent achievability than the comps imply.
- What's the recent tenant-quality profile in this submarket — average credit score on applications, eviction rate, late-payment / NSF rate, and stable-employment percentage? A property-management company in the area should have these aggregated.
- How much new apartment / multifamily construction is in the pipeline within 1–3 miles? Heavy new supply (>2% of stock underway) typically softens rents 12–24 months out; light construction supports rent growth.
Investment metrics
- 1% rule
- 0.98% ✗
- Cap rate
- 6.60%
- Cash-on-cash
- 1.09%
- DSCR
- 1.05
- GRM
- 8.5
CMA / ARV
- ARV (median comp)
- $194,886
- List price
- $145,000
- Delta
- -25.60%
- Verdict
- UNDERPRICED
- Comps
- 20 within 1.0 mi
Projected returns pro-forma
-3.0% appreciation · 2.05% rent growth · sell at horizon
- IRR
- -15.7%
- Equity multiple
- 0.45×
- Total profit
- $-22,429
- Equity at exit
- $21,620
- IRR
- -9.0%
- Equity multiple
- 0.47×
- Total profit
- $-21,643
- Equity at exit
- $12,537
Cash invested: $40,600 (down + closing). Projections, not guarantees.
Landlord ↔ Tenant lean methodology
- Overall (STATE)
- 83 Strongly Landlord-Friendly
- State Oklahoma
- 83 Strongly Landlord-Friendly · R+20
- County
- — inherits STATE
- City
- — inherits STATE
ZIP-level market 73120
- Rents YoY
- 2.0%
- Active inventory
- 333
- Price-to-rent
- 8.5×
Monthly cashflow live
- Estimated rent
- $1,426 high interval (Pro) →
- Mortgage (P&I)
- −$760
- Tax from tax record
- −$119 /mo · $1,424/yr
- Insurance
- −$60
- HOA
- −$150
- Vacancy / Maint / Mgmt
- −$299
- Net cashflow
- $37
Break-even live
UW: 25.0% down · 7.5% · 30yr · 1.5% tax · 5.0% vac · 8.0% maint · 8.0% mgmt
Financing live
Cash to close
- Down payment
- $36,250
- Closing costs
- $4,350
- Reserves months
- —
- Total cash needed
- —
Loan-product check · same deal, 3 products live
Conventional
25% down · 7.5% · 30yr
- Down + closing
- —
- Monthly P&I
- —
- Monthly cashflow
- —
- DSCR
- —
- Eligible?
- —
Personal DTI + credit; lowest rate.
DSCR
20% down · 8.5% · 30yr
- Down + closing
- —
- Monthly P&I
- —
- Monthly cashflow
- —
- DSCR
- —
- Eligible?
- —
No personal income docs; deal must DSCR.
Hard money
10% down · 12.0% · 12mo
- Down + closing
- —
- Monthly P&I
- —
- Monthly cashflow
- —
- DSCR
- —
- Eligible?
- —
Short-term bridge; refi at stabilization.
Rent comps 40 comps
| Address | Beds | Baths | Sqft | Rent | $/sqft | DOM | Units | Dist |
|---|---|---|---|---|---|---|---|---|
| 11007 Greystone Ave Oklahoma City, OK | 2.0 | 2.0 | 1269 | $1,500 | $1.18 | 4d | 1 | 0.07mi |
| 10904 N Linn Ave Oklahoma City, OK | 3.0 | 2.0 | 1452 | $1,650 | $1.14 | 44d | 1 | 0.10mi |
| 2737 Plymouth Ln Oklahoma City, OK | 3.0 | 1.5 | 1372 | $1,395 | $1.02 | 44d | 1 | 0.37mi |
| 11004 N May Ave Oklahoma City, OK | 1.0–2.0 | 1.0–2.5 | 1129 | $1,170 | $1.04 | 12d | 1 | 0.43mi |
| 11239 N Pennsylvania Ave Oklahoma City, OK | 1.0–2.0 | 1.0–2.0 | 850 | $1,155 | $1.36 | 4d | 30 | 0.52mi |
| 10412 Major Ave Oklahoma City, OK | 3.0 | 2.0 | 1286 | $1,750 | $1.36 | 44d | 1 | 0.56mi |
| 11417 N May Ave Unit D Oklahoma City, OK | 3.0 | 2.0 | 1275 | $1,345 | $1.05 | 3d | 1 | 0.59mi |
| 9913 Sunnymeade Pl Oklahoma City, OK | 3.0 | 1.5 | 1284 | $1,695 | $1.32 | 24d | 1 | 0.70mi |
| 9909 Sunnymeade Pl Oklahoma City, OK | 3.0 | 2.0 | 1325 | $1,695 | $1.28 | 2d | 1 | 0.71mi |
| 2632 Kings Way Oklahoma City, OK | 3.0 | 1.5 | 1496 | $1,600 | $1.07 | 44d | 1 | 0.71mi |
| 2126 NW 118th St Oklahoma City, OK | 2.0 | 2.5 | 1360 | $1,445 | $1.06 | 24d | 1 | 0.85mi |
| 2300 Carlton Way Oklahoma City, OK | 1.0 | 1.0 | 700 | $899 | $1.28 | 16d | 1 | 0.85mi |
| 2000 Lanesboro Dr Oklahoma City, OK | 3.0 | 2.0 | 1236 | $1,550 | $1.25 | 44d | 1 | 0.88mi |
| 10104 Haverhill Pl Oklahoma City, OK | 3.0 | 2.0 | 1188 | $1,550 | $1.30 | 14d | 1 | 0.98mi |
| 1800 NW 115th St Oklahoma City, OK | 1.0–3.0 | 1.0–2.0 | 1019 | $1,705 | $1.67 | 2d | 8 | 1.01mi |
| 1720 Castle St Oklahoma City, OK | 3.0 | 2.0 | 1428 | $1,800 | $1.26 | 44d | 1 | 1.01mi |
| 9519 Stratford Dr Oklahoma City, OK | 3.0 | 1.0 | 1141 | $1,450 | $1.27 | 2d | 1 | 1.03mi |
| 11141 Springhollow Rd Oklahoma City, OK | 3.0 | 2.0 | 1330 | $1,499 | $1.13 | 24d | 1 | 1.05mi |
| 11141 Springhollow Rd Unit 208 Oklahoma City, OK | 2.0 | 2.0 | 1088 | $1,125 | $1.03 | 44d | 1 | 1.06mi |
| 11141 Springhollow Rd Unit 251 Oklahoma City, OK | 3.0 | 2.0 | 1330 | $1,499 | $1.13 | 21d | 1 | 1.06mi |
| 2700 Indian Creek Blvd Oklahoma City, OK | 1.0–3.0 | 1.0–2.0 | 1261 | $1,164 | $0.92 | 2d | 5 | 1.08mi |
| 12305 Cedar Springs Ln Oklahoma City, OK | 2.0 | 2.5 | 1472 | $1,250 | $0.85 | 44d | 1 | 1.10mi |
| 2401 NW 122nd St Oklahoma City, OK | 1.0–2.0 | 1.0–2.0 | 844 | $899 | $1.06 | 24d | 1 | 1.10mi |
| 2301 NW 122nd St Oklahoma City, OK | 1.0 | 1.0 | 723 | $940 | $1.30 | 2d | 28 | 1.14mi |
| 10517 N McKinley Ave Oklahoma City, OK | 3.0 | 1.5 | 1219 | $1,695 | $1.39 | 4d | 1 | 1.15mi |
| 2204 Downing St Oklahoma City, OK | 2.0 | 1.0 | 750 | $1,295 | $1.73 | 20d | 1 | 1.16mi |
| 2801 Croydon Ct Oklahoma City, OK | 2.0 | 1.0 | 1102 | $1,550 | $1.41 | 2d | 1 | 1.17mi |
| 1913 Downing St Oklahoma City, OK | 2.0 | 1.0 | 940 | $1,245 | $1.32 | 2d | 1 | 1.19mi |
| 1913 Downing St Oklahoma City, OK | 2.0 | 1.0 | 940 | $1,245 | $1.32 | 2d | 1 | 1.19mi |
| 10905 N Brauer Ave Oklahoma City, OK | 3.0 | 1.5 | 1424 | $1,505 | $1.06 | 44d | 1 | 1.20mi |
| 1413 NW 106th St Oklahoma City, OK | 3.0 | 2.0 | 1345 | $1,495 | $1.11 | 44d | 1 | 1.21mi |
| 2611 Silvertree Dr Oklahoma City, OK | 3.0 | 2.0 | 1500 | $1,550 | $1.03 | 44d | 1 | 1.21mi |
| 2216 Hasley Dr Oklahoma City, OK | 2.0 | 1.0 | 750 | $1,400 | $1.87 | 44d | 1 | 1.21mi |
| 2216 Hasley Dr Oklahoma City, OK | 2.0 | 1.0 | 750 | $1,400 | $1.87 | 20d | 1 | 1.21mi |
| 9721 Georgia Ave Oklahoma City, OK | 3.0 | 2.0 | 1442 | $1,685 | $1.17 | 4d | 1 | 1.23mi |
| 11409 Springhollow Rd #505 Oklahoma City, OK | 1.0 | 1.0 | 801 | $1,250 | $1.56 | 44d | 1 | 1.25mi |
| 2841 Indian Creek Blvd Oklahoma City, OK | 2.0 | 2.0 | 1129 | $1,100 | $0.97 | 16d | 1 | 1.25mi |
| 2841 Indian Creek Blvd Oklahoma City, OK | 2.0 | 2.0 | 1129 | $1,100 | $0.97 | 24d | 1 | 1.25mi |
| 3200 W Britton Rd Oklahoma City, OK | 1.0–2.0 | 1.0–2.0 | 905 | $1,495 | $1.65 | 4d | 1 | 1.28mi |
| 2104 Churchill Way Oklahoma City, OK | 3.0 | 1.0 | 866 | $1,365 | $1.58 | 2d | 1 | 1.28mi |
HOA detail condo
- Monthly dues
- $150 · $1,800/yr
- Assessments
- None detected in remarks — confirm with the listing agent.
Listing history 15 events
-
2026-06-18days on market $145,000 Active 115 DOM
-
2026-06-17days on market $145,000 Active 114 DOM
-
2026-06-16days on market $145,000 Active 113 DOM
-
2026-06-15days on market $145,000 Active 112 DOM
-
2026-06-13days on market $145,000 Active 110 DOM
-
2026-06-09days on market $145,000 Active 106 DOM
-
2026-06-08days on market $145,000 Active 105 DOM
-
2026-06-07days on market $145,000 Active 104 DOM
-
2026-06-05days on market $145,000 Active 101 DOM
-
2026-06-03days on market $145,000 Active 100 DOM
-
2026-06-02days on market $145,000 Active 99 DOM
-
2026-06-01days on market $145,000 Active 98 DOM
-
2026-05-31days on market $145,000 Active 97 DOM
-
2026-02-23$145,000 Active 594-char remark
Show marketing remark (594 chars)
As-Is Half Duplex Near Lake Hefner – Priced Below Market! Located just minutes from Lake Hefner and convenient shopping in The Village, this 2-bedroom, 2-bath half duplex offers a great opportunity for buyers looking to add their personal touch. The home features tile flooring and carpet throughout, a spacious primary bedroom, and a second well-sized bedroom. Enjoy a comfortable living room along with a functional kitchen and dining area, perfect for everyday living. Priced below market value to allow room for updates — a fantastic investment or owner-occupant opportunity!
-
1984-05-01soldstatus $65,000
ⓘ Source: listings_history table (triggers on properties + properties_extension) + one-shot
backfill from property_details.listing_events for pre-trigger history.
Tax reassessment forecast OK · Resets to sale price
- Current annual tax
- $1,424 · $119/mo
- Projected year-2 tax
- $1,424 · $119/mo
- Expected delta
- $0/yr ($0/mo · 0.0%)
ⓘ Screening estimate from a state-policy table — verify with the county assessor before closing.
Nearby sold comps map
Loading sold comps map…
Walkable amenities ~0.75 mi
Loading nearby amenities…
Taxation est. · year 1
- Rental income
- $17,108
- − Mortgage interest
- −$8,122
- − Property taxes
- −$1,424
- − Insurance
- −$725
- − Repairs & maintenance
- −$1,369
- − Management
- −$1,369
- − HOA
- −$1,800
- − Depreciation
- −$4,218
- Taxable loss
- −$1,919
- Est. tax savings @ 24.0%
- +$461
- After-tax cash flow
- $902/yr
For passive investors: Depreciation is non-cash, so a rental often shows a tax loss while cash-flowing — sheltering income. Rental losses are passive: they offset passive income freely, and up to $25,000/yr can offset ordinary (W-2) income if you actively participate and your MAGI is under $100k (phasing out to $0 by $150k); unused losses carry forward. On sale, claimed depreciation is recaptured at up to 25%, and gains may owe capital-gains tax (a 1031 exchange can defer both). Figures are a year-1 estimate at your 24.0% rate — not tax advice; consult a CPA.
Schools (NCES district)
- District
- Oklahoma City
- NCES district ID
- 4022770
- Math proficiency
- 7% ▼ -5.00%
- Reading proficiency
- 10% ▼ -6.00%
- Median HH income
- $35,606
- Composite
- 7.0/100
- National rank
- #9970
- State rank
- #254 of 270 in OK
Livability — Oklahoma City
- Score
- 80/100
- State rank
- #3
- US rank
- #1635
Category grades
Schools grade is shown separately in the Schools card above.
Census & demographics
- Census place
- Oklahoma City, OK
- County
- Oklahoma County · 771,644 people
- City population
- 498,656
- Metro
- Oklahoma City, OK
- Population (ZIP)
- 35,559
- Household income
- $64,745
- Rent vs Own
- Severe rent burden
- 2029.0
Population outlook (Oklahoma County) Hauer SSP2
- Today (2025)
- 911,875 people
- By 2030
- 982,413 · +7.7%
- By 2040
- 1,130,468 · +24.0%
- By 2050
- 1,288,422 · +41.3%
- By 2075
- 1,711,482 · +87.7%
- By 2100
- 2,088,448 · +129.0%
Race, ethnicity, and origin ACS 2023
- Neighborhood character
- Diverse neighborhood (Simpson 0.62)
- Race & ethnicity
- White 57% Black 21% Two or more races 11% Hispanic / Latino 7% Native American 3% Asian 2%
- Hispanic origin (detail)
- Mexican 4%
- Common ancestry
- Italian 3% Slovak 2% Lithuanian 2%
- Foreign-born
- 7% · Canada, China, Jamaica
- Languages at home
- 92% English-only · Spanish 4% French/Haitian/Cajun 1% Other Asian/Pacific 1%
Political lean MEDSL · Oklahoma
- 2024 margin
- Toss-up / Even · D 48.0% · R 49.7% · Other 2.3%
- 2008→2024 swing
- +15.1pp toward D · 2008: -16.8pp · 2024: -1.7pp
- All cycles
- 2024: R+1.7 2020: R+1.1 2016: R+10.5 2012: R+16.7 2008: R+16.8
Not yet ingested
- Civics
- —
Market trends
- HPI YoY
- ▼ -279.69%
- Current HPI
- 227.2832
- Rent YoY
- ▲ 2.05%
- Metro
- Oklahoma City, OK
- State GDP YoY
- ▲ 1.55%
- F500 in state
- 6
Industry mix (Fortune 500 HQ in OK)
| Industry | F500 HQs | Revenue |
|---|---|---|
| Energy | 3 | $48B |
|
||
Price history
+123.1% since first listed2 events — show timeline
- 2026-02-23 Listed $145,000 MLSOK
- 1984-05-01 Sold (Public Records) $65,000 Public Records
Property tax history
+3.1%/yrLatest (2025): $1,424 · +4.2% YoY. Source: county tax records.
Cash-flow waterfall
monthlySold comps — $/sqft
last 12 mo · ≤1 miLoading sold comps…