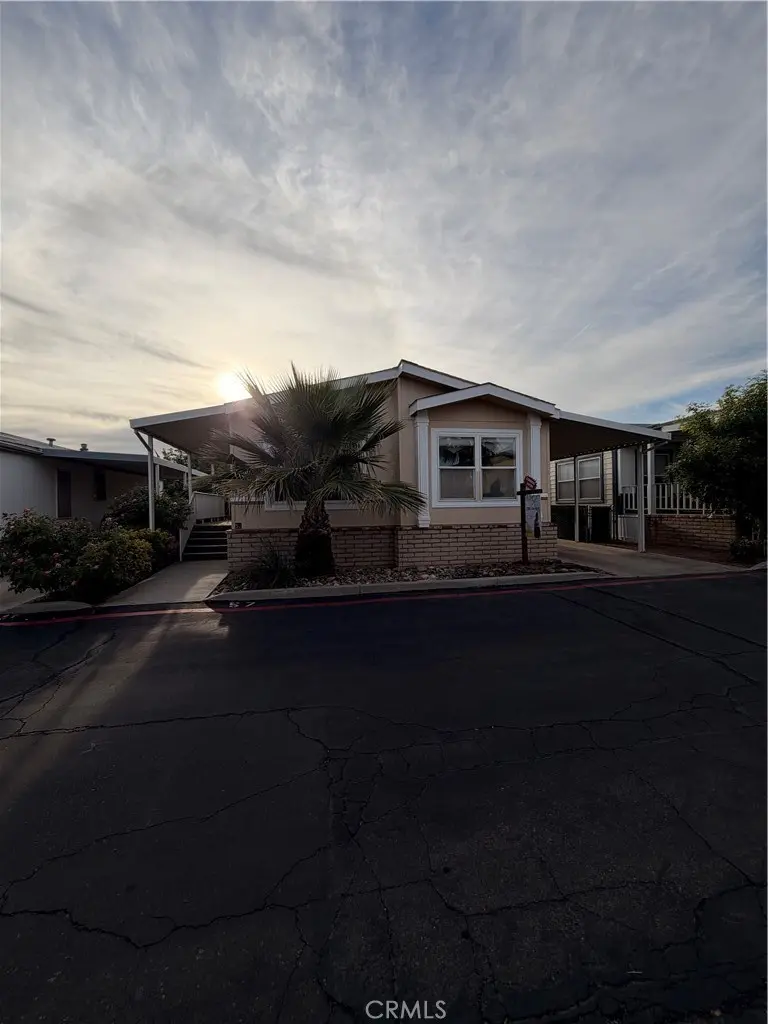
8450 G Ave #57 · Hesperia, CA
Flood risk 1/10 · Minimal
- FEMA flood zone
- X (unshaded)
- Chance of flooding over 30 yrs
- 0.0%
- Est. flood insurance / yr
- $507 – $1,088
Fire risk 6/10 · Moderate
- Est. fire insurance / yr
- $659 – $1,223
Heat risk 6/10 · Moderate
- Hot days now (above 98°F)
- 5 days/yr
- Hot days in 30 yrs
- 13 days/yr
Wind risk 1/10 · Minimal
- Chance of severe wind over 30 yrs
- —
Air-quality risk 10/10 · Severe
- Unhealthy air days now
- 24 days/yr
- Unhealthy air days in 30 yrs
- 29 days/yr
Risk factors via First Street. Map © Google.
Why this score? — see what drove the C+ grade
The composite is a weighted blend of 9 inputs, each scored 0–100. Each bar is that input's sub-score; the figure is the points it added to the 100-point composite (weight × sub-score).
- Cash flow +30.0/30.0
- 1% rule +10.0/10.0
- DSCR +10.0/10.0
- Rent growth +3.2/5.0
- Schools +2.6/10.0
- Livability +2.6/5.0
- Condition / age +2.5/5.0
- ARV discount +0.0/15.0
- Appreciation +0.0/10.0
$120,000
🖨 Deal sheet 📄 Offer letter ✓ Due diligence
Listing remarks MLS
Welcome to this beautifully remodeled manufactured home located in the highly desirable Chaparral Estates! This charming home features 3 spacious bedrooms and 2 full bathrooms, offering a comfortable and functional layout perfect for beginning families or first time home buyers. The interior has been fully remodeled with modern finishes, creating a fresh and inviting atmosphere throughout. Mater bedroom is nicely sized, providing plenty of room to relax, while the two full bathrooms add convenience for everyday living. Ideally located close to schools, shopping, dining, and everyday amenities, this home combines comfort with convenience. Nestled within the beautiful family-friendly community of Chaparral Estates, residents enjoy a peaceful setting while still being near everything you need. Don’t miss the opportunity to own this move-in-ready home in one of the most sought-after parks in the area!
Key facts
- Move-in-ready home
- Modern finishes
- Garage
Tags
Neighborhood map
What this means for you Summary
Snapshot
- This is a 3-bed/2.0-bath manufactured listed at $120k.
Deal economics
- At list price, monthly cash flow is $1k ($13k/yr) — positive.
- The deal already cash-flows at list — no discount required.
- Meets the 1% rule at list price ($2k rent vs $120k).
- Recommended offer: $113k (6.0% below list) — sets the bar for market timing.
- Cap rate 17.3% vs local median 3.7% in Hesperia — top-decile yield for the area; either an underpriced asset or a hidden risk that comps aren't pricing in. Stress-test before assuming the spread holds.
Location & tenants
- Location reads 52/100 on livability (#1,009 in CA) — a working-class tenant base; expect higher turnover. Strengths: housing A+; Watch: employment D, schools F, crime D-.
- Hesperia Unified (suburban): math 20% / reading 39% proficiency, ranked #353 of 517 in CA (top 68%) — low school quality limits family demand, transient renter base, plan for 1-2y turnover; 61% free/reduced lunch — lower-income household profile, screen leases tightly.
- Market conditions: Rents rising (+2.9%/yr); 463 active listings in the ZIP; 13 comparable units currently listed for rent nearby; rentals lingering (median 44d on market — plan ~5-8 weeks vacancy on turnover, expect pricing pressure); 77% of comp listings sitting > 30 days — soft ceiling on asking rent; 5,458 units permitted in San Bernardino County in 2024 (1,500 in 5+ unit buildings).
- This rent runs 39% of the median local income ($69k/yr) — at the standard rent-burdened threshold; future hikes will face affordability resistance.
Forward outlook
- Local home prices are declining (-3.0%/yr); year-one equity from $830 of loan paydown is wiped out by about $4k of value loss. Plan a longer hold.
- San Bernardino County population projected at +15% by 2050 — modest demand growth; plan on rents tracking national, not racing it.
- At projected returns (-3.0% appreciation + 2.9% rent growth), your $34k cash investment doubles in ~3 years — after that, you're playing with house money.
Negotiation context
- It's been on market 70 days — a 6% lower offer ($113k) is reasonable based on typical stale-listing flexibility.
- 2 sale attempts since 11y ago with the ask held roughly flat each time — persistent listings suggest the price (not the market) is what's stuck; bring a comps-based counter.
- Current owner paid $32k; list at $120k implies a 275% gain — meaningful room to come down on a strong offer.
Risks & watch-outs
- Climate carrying-cost: major wildfire risk; extreme-heat days projected 5→13/yr by 2055 (HVAC capex compounding) — expect insurance premiums to compound above CPI over the hold.
Questions for the listing agent
- It's been on market 70 days. Have you received any prior offers? Is the seller open to a 6% concession, seller financing, or rate buy-down credit?
- Why hasn't it sold? Are there any deal-killer items the seller is aware of (foundation, flood, title, zoning, code violations)?
- Is there a deadline driving the sale (1031 exchange, divorce, estate, relocation)? That informs how much negotiation room exists.
- Schools are F-rated, which usually means shorter tenancies and higher turnover. Who's the typical renter profile here, and what's been the actual vacancy rate?
- Crime grade is D in this area — have there been break-ins, vandalism, or insurance claims at this property in the last 3 years? What carrier currently insures it and at what premium?
- What's the average days-on-market for RENTAL listings here right now (not sales)? A rising rental-DOM trend means longer vacancies and softer asking-rent achievability than the comps imply.
- What's the recent tenant-quality profile in this submarket — average credit score on applications, eviction rate, late-payment / NSF rate, and stable-employment percentage? A property-management company in the area should have these aggregated.
- How much new for-sale + rental construction is in the pipeline within 1–3 miles? Heavy new supply typically softens prices + rents 12–24 months out; constrained supply supports both.
Investment metrics
- 1% rule
- 1.90% ✓
- Cap rate
- 17.31%
- Cash-on-cash
- 39.34%
- DSCR
- 2.75
- GRM
- 4.4
CMA / ARV
- ARV (median comp)
- $80,000
- List price
- $120,000
- Delta
- 50.00%
- Verdict
- OVERPRICED
- Comps
- 5 within 2.0 mi
Show comp detail 6 sales within ~0.75 mi
| Address | Dist | Beds/Ba | Sqft | Sold | Price | $/sf | Match |
|---|---|---|---|---|---|---|---|
| 8450 G Ave #36 | 0.00mi | 3/2.0 | 1,344 (+9%) | 15mo | $110,000 | $82 | 73 |
| 8450 G Ave #26 | 0.02mi | 3/2.0 | 1,152 (-7%) | 20mo | $119,000 | $103 | 71 |
| 8450 G Ave #53 | 0.00mi | 2/2.0 (-1) | 1,352 (+9%) | 13mo | $115,000 | $85 | 69 |
| 8450 G Ave | 0.02mi | 2/2.0 (-1) | 1,120 (-9%) | 21mo | $90,000 | $80 | 61 |
| 8450 G Ave #7 | 0.00mi | 3/2.0 | 1,408 (+14%) | 19mo | $110,000 | $78 | 61 |
| 8655 Santa Fe E | 0.62mi | 2/2.0 (-1) | 1,248 (+1%) | 5mo | $70,000 | $56 | 60 |
Match score weights: distance 35% · size 25% · config 20% · recency 20%. Top-matched comps best support the ARV.
Projected returns pro-forma
-3.0% appreciation · 2.85% rent growth · sell at horizon
- IRR
- 35.4%
- Equity multiple
- 2.50×
- Total profit
- $50,331
- Equity at exit
- $17,892
- IRR
- 42.1%
- Equity multiple
- 4.95×
- Total profit
- $132,587
- Equity at exit
- $10,375
Cash invested: $33,600 (down + closing). Projections, not guarantees.
Landlord ↔ Tenant lean methodology
- Overall (STATE)
- 18 Strongly Tenant-Friendly
- State California
- 18 Strongly Tenant-Friendly · D+13
- County
- — inherits STATE
- City
- — inherits STATE
ZIP-level market 92345
- Rents YoY
- 2.9%
- Active inventory
- 463
- Price-to-rent
- 4.4×
Monthly cashflow live
- Estimated rent
- $2,280 high interval (Pro) →
- Mortgage (P&I)
- −$629
- Tax from tax record
- −$20 /mo · $245/yr
- Insurance
- −$50
- HOA
- −$0
- Vacancy / Maint / Mgmt
- −$479
- Net cashflow
- $1,102
Break-even live
UW: 25.0% down · 7.5% · 30yr · 1.5% tax · 5.0% vac · 8.0% maint · 8.0% mgmt
Financing live
Cash to close
- Down payment
- $30,000
- Closing costs
- $3,600
- Reserves months
- —
- Total cash needed
- —
Loan-product check · same deal, 3 products live
Conventional
25% down · 7.5% · 30yr
- Down + closing
- —
- Monthly P&I
- —
- Monthly cashflow
- —
- DSCR
- —
- Eligible?
- —
Personal DTI + credit; lowest rate.
DSCR
20% down · 8.5% · 30yr
- Down + closing
- —
- Monthly P&I
- —
- Monthly cashflow
- —
- DSCR
- —
- Eligible?
- —
No personal income docs; deal must DSCR.
Hard money
10% down · 12.0% · 12mo
- Down + closing
- —
- Monthly P&I
- —
- Monthly cashflow
- —
- DSCR
- —
- Eligible?
- —
Short-term bridge; refi at stabilization.
Rent comps 13 comps
| Address | Beds | Baths | Sqft | Rent | $/sqft | DOM | Units | Dist |
|---|---|---|---|---|---|---|---|---|
| 16854 Muscatel St Hesperia, CA | 3.0 | 2.5 | 1281 | $2,395 | $1.87 | 44d | 1 | 0.38mi |
| 16850 Muscatel St Hesperia, CA | 2.0 | 1.5 | 1026 | $2,150 | $2.10 | 44d | 1 | 0.42mi |
| 8601 C Ave Unit C Hesperia, CA | 2.0 | 1.0 | 840 | $1,550 | $1.85 | 44d | 1 | 0.45mi |
| 8550 C Ave Hesperia, CA | 3.0 | 2.0 | 1500 | $2,300 | $1.53 | 44d | 1 | 0.48mi |
| 16837 Sultana St Apt 4 Hesperia, CA | 2.0 | 1.0 | 750 | $1,624 | $2.17 | 44d | 1 | 0.57mi |
| 8922 I Ave Unit 3 Hesperia, CA | 2.0 | 2.0 | 1150 | $1,695 | $1.47 | 44d | 1 | 0.69mi |
| 17593 Sultana St Hesperia, CA | 2.0 | 2.0 | 1268 | $2,000 | $1.58 | 44d | 1 | 0.90mi |
| 16550 Olive St Unit 105 Hesperia, CA | 2.0 | 1.5 | 990 | $2,000 | $2.02 | 24d | 1 | 1.06mi |
| 9175 3rd Ave Hesperia, CA | 2.0–3.0 | 2.0 | 1190 | $2,640 | $2.22 | 2d | 4 | 1.13mi |
| 7625 Montrose Ave Hesperia, CA | 3.0 | 2.0 | 1338 | $2,700 | $2.02 | 44d | 1 | 1.21mi |
| 8274 Madera Ave Hesperia, CA | 4.0 | 2.0 | 1300 | $3,295 | $2.53 | 44d | 1 | 1.29mi |
| 16507 Juniper St Hesperia, CA | 3.0 | 2.0 | 1297 | $2,400 | $1.85 | 44d | 1 | 1.41mi |
| 16149 Orange St Hesperia, CA | 2.0 | 1.0 | 902 | $1,800 | $2.00 | 24d | 1 | 1.50mi |
Listing history 17 events
-
2026-06-18days on market $120,000 Active 70 DOM
-
2026-06-17days on market $120,000 Active 69 DOM
-
2026-06-16days on market $120,000 Active 68 DOM
-
2026-06-15days on market $120,000 Active 67 DOM
-
2026-06-13days on market $120,000 Active 65 DOM
-
2026-06-13days on market $120,000 Active 64 DOM
-
2026-06-09days on market $120,000 Active 61 DOM
-
2026-06-08days on market $120,000 Active 60 DOM
-
2026-06-07days on market $120,000 Active 59 DOM
-
2026-06-04days on market $120,000 Active 56 DOM
-
2026-06-03days on market $120,000 Active 55 DOM
-
2026-06-02days on market $120,000 Active 54 DOM
-
2026-06-01days on market $120,000 Active 53 DOM
-
2026-05-31days on market $120,000 Active 52 DOM
-
2026-04-09$120,000 Active 916-char remark
Show marketing remark (916 chars)
Welcome to this beautifully remodeled manufactured home located in the highly desirable Chaparral Estates! This charming home features 3 spacious bedrooms and 2 full bathrooms, offering a comfortable and functional layout perfect for beginning families or first time home buyers. The interior has been fully remodeled with modern finishes, creating a fresh and inviting atmosphere throughout. Mater bedroom is nicely sized, providing plenty of room to relax, while the two full bathrooms add convenience for everyday living. Ideally located close to schools, shopping, dining, and everyday amenities, this home combines comfort with convenience. Nestled within the beautiful family-friendly community of Chaparral Estates, residents enjoy a peaceful setting while still being near everything you need. Don’t miss the opportunity to own this move-in-ready home in one of the most sought-after parks in the area!
-
2015-04-10soldstatus $32,000 309-char remark
Show marketing remark (309 chars)
Beautiful home. Great Condition. Move in ready. Large kitchen and living room. Oversized tub in master bath. # of RV Spaces: 0 Special Features: NoneFRON, AUTS Lot Location Type: Standard Location FireplaceFeatures: None Zoning: Residential 1 # of Attached Spaces: 0 # of Detached Spaces: 0 # of RV Spaces: 0
-
2015-02-26$33,000 309-char remark
Show marketing remark (309 chars)
Beautiful home. Great Condition. Move in ready. Large kitchen and living room. Oversized tub in master bath. # of RV Spaces: 0 Special Features: NoneFRON, AUTS Lot Location Type: Standard Location FireplaceFeatures: None Zoning: Residential 1 # of Attached Spaces: 0 # of Detached Spaces: 0 # of RV Spaces: 0
ⓘ Source: listings_history table (triggers on properties + properties_extension) + one-shot
backfill from property_details.listing_events for pre-trigger history.
Tax reassessment forecast CA · Resets to sale price
- Current annual tax
- $245 · $20/mo
- Projected year-2 tax
- $912 · $76/mo
- Expected delta
- +$667/yr (+$56/mo · 272.7%)
ⓘ Screening estimate from a state-policy table — verify with the county assessor before closing.
Climate risk First Street
- Flood 1/10 Low FEMA zone X (unshaded) · 0% chance over 30 yrs
- Wildfire 6/10 Major
- Heat 6/10 Major 5 d/yr ≥98°F today · 13 d/yr by 30 yrs out
- Wind 1/10 Low
- Air quality 10/10 Extreme 24 unhealthy d/yr today · 29 by 30 yrs out
Nearby sold comps map
Loading sold comps map…
Walkable amenities ~0.75 mi
Loading nearby amenities…
Taxation est. · year 1
- Rental income
- $27,362
- − Mortgage interest
- −$6,722
- − Property taxes
- −$245
- − Insurance
- −$600
- − Repairs & maintenance
- −$2,189
- − Management
- −$2,189
- − Depreciation
- −$3,491
- Taxable income
- $11,927
- Est. tax owed @ 24.0%
- −$2,862
- After-tax cash flow
- $10,357/yr
For passive investors: Depreciation is non-cash, so a rental often shows a tax loss while cash-flowing — sheltering income. Rental losses are passive: they offset passive income freely, and up to $25,000/yr can offset ordinary (W-2) income if you actively participate and your MAGI is under $100k (phasing out to $0 by $150k); unused losses carry forward. On sale, claimed depreciation is recaptured at up to 25%, and gains may owe capital-gains tax (a 1031 exchange can defer both). Figures are a year-1 estimate at your 24.0% rate — not tax advice; consult a CPA.
Schools (NCES district)
- District
- Hesperia Unified
- NCES district ID
- 0600014
- Math proficiency
- 20% ▼ -4.00%
- Reading proficiency
- 39% ▲ 4.00%
- Median HH income
- $49,376
- Composite
- 25.66/100
- National rank
- #7397
- State rank
- #353 of 517 in CA
Livability — Hesperia
- Score
- 52/100
- State rank
- #1009
- US rank
- #24896
Category grades
Schools grade is shown separately in the Schools card above.
Census & demographics
- Census place
- Hesperia, CA
- County
- San Bernardino County · 2,030,291 people
- City population
- 110,055
- Metro
- Riverside-San Bernardino-Ontario, CA
- Population (ZIP)
- 88,706
- Household income
- $69,485
- Rent vs Own
- Severe rent burden
- 2768.0
Population outlook (San Bernardino County) Hauer SSP2
- Today (2025)
- 2,300,329 people
- By 2030
- 2,378,907 · +3.4%
- By 2040
- 2,523,137 · +9.7%
- By 2050
- 2,642,388 · +14.9%
- By 2075
- 2,880,769 · +25.2%
- By 2100
- 2,909,436 · +26.5%
Race, ethnicity, and origin ACS 2023
- Neighborhood character
- Majority Hispanic (61%)
- Race & ethnicity
- Hispanic / Latino 61% White 30% Two or more races 19% Black 4% Asian 1% Native American 1%
- Hispanic origin (detail)
- Mexican 54%
- Common ancestry
- Italian 1% Lithuanian 1% Iranian 1%
- Foreign-born
- 17% · Canada
- Languages at home
- 65% English-only · Spanish 34%
Political lean MEDSL · San Bernardino
- 2024 margin
- Toss-up / Even · D 47.5% · R 49.7% · Other 2.8%
- 2008→2024 swing
- -8.5pp toward R · 2008: 6.3pp · 2024: -2.1pp
- All cycles
- 2024: R+2.1 2020: D+10.7 2016: D+9.8 2012: D+5.4 2008: D+6.3
Not yet ingested
- Civics
- —
Market trends
- HPI YoY
- ▼ -375.87%
- Current HPI
- 433.2103
- Rent YoY
- ▲ 2.85%
- Metro
- Riverside-San Bernardino-Ontario, CA
- State GDP YoY
- ▲ 3.21%
- F500 in state
- 116
Industry mix (Fortune 500 HQ in CA)
| Industry | F500 HQs | Revenue |
|---|---|---|
| Technology | 27 | $1,492B |
|
||
| Financial Services | 3 | $174B |
|
||
| Retail | 3 | $44B |
|
||
| Insurance | 3 | $26B |
|
||
| Media / Entertainment | 2 | $115B |
|
||
| Pharmaceuticals / Biotech | 2 | $62B |
|
||
Price history
+263.6% since first listed3 events — show timeline
- 2026-04-09 Listed $120,000 CRMLS
- 2015-04-10 Sold (MLS) $32,000 CRMLS
- 2015-02-26 Listed $33,000 CRMLS
Property tax history
-5.1%/yrLatest (2025): $245 · +0.4% YoY. Source: county tax records.
Cash-flow waterfall
monthlySold comps — $/sqft
last 12 mo · ≤1 miLoading sold comps…