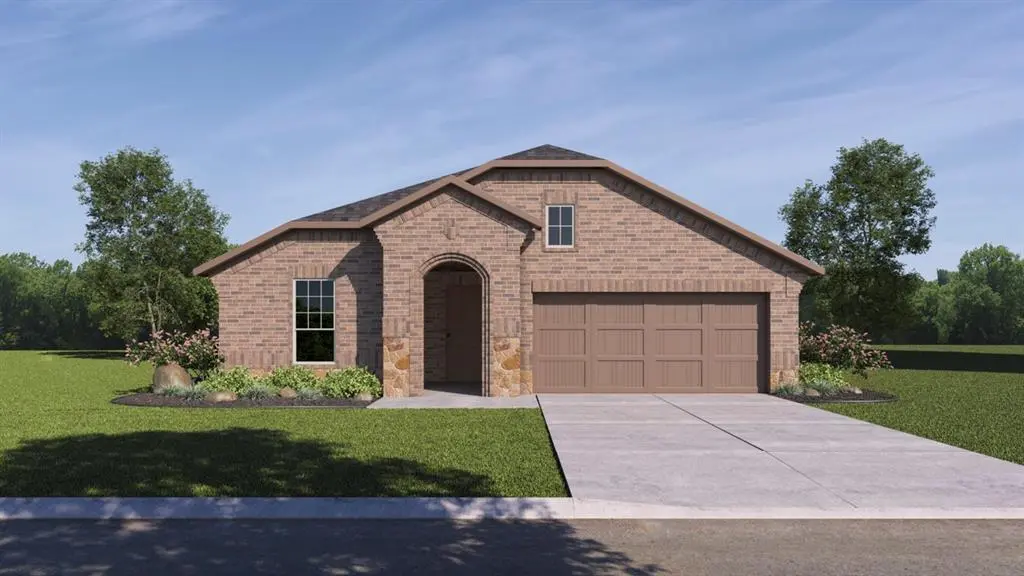
2213 Tacoma Way · Anna, TX
Flood risk No data
- FEMA flood zone
- —
- Chance of flooding over 30 yrs
- —
- Est. flood insurance / yr
- —
Fire risk No data
- Est. fire insurance / yr
- —
Heat risk No data
- Hot days now (above threshold)
- —
- Hot days in 30 yrs
- —
Wind risk No data
- Chance of severe wind over 30 yrs
- —
Air-quality risk No data
- Unhealthy air days now
- —
- Unhealthy air days in 30 yrs
- —
Risk factors via First Street. Map © Google.
Why this score? — see what drove the D- grade
The composite is a weighted blend of 9 inputs, each scored 0–100. Each bar is that input's sub-score; the figure is the points it added to the 100-point composite (weight × sub-score).
- ARV discount +15.0/15.0
- Cash flow +7.8/30.0
- Schools +3.8/10.0
- Livability +3.8/5.0
- 1% rule +2.5/10.0
- Condition / age +2.5/5.0
- Rent growth +2.0/5.0
- DSCR +1.9/10.0
- Appreciation +0.0/10.0
$296,990
🖨 Deal sheet (PDF) 📄 Offer letter ✓ Due diligence
Listing remarks
This 3 bed 2 bath home is the perfect starter home . Home offers an open floor plan with covered patio, separate eating area and large ensuite.
Key facts
- Open floor plan
- Covered patio
- Separate eating area
Tags
Property features AI
Finance
- Other: Builder special listing condition; Directions included for property access
- HOA & community: Mandatory association; HOA managed by Homewise Neighborhood Management; Annual association fee of $480; Association fee includes grounds maintenance
Exterior
- Parking: Attached garage; 2-car garage (approx. 19' wide x 20' long); Garage listed as parking feature
- Utilities: City water; City sewer; Not in a municipal utility district
- Home design: Single family residence; One-story; New construction (incomplete, year built 2026); Property facing/address matched
- Construction: New construction (2026)
- Exterior features: Lot in a subdivision (The Woods at Lindsay Place); Lot less than 0.5 acre
Interior
- Kitchen: Dishwasher; Microwave
- Bedrooms: Primary bedroom (Level 1) — approx. 17 x 14; Bedroom (Level 1) — approx. 10 x 11; Bedroom (Level 1) — approx. 10 x 11
- Bathrooms: 2 full bathrooms
- Interior features: Cable TV available; Flat screen wiring; Smart home system; Sound system wiring; One living area; One dining area; Total of 5 rooms; Electric fireplace
- Laundry & utility: Smart home features (app or pass supported)
Neighborhood map
What this means for you Summary
Snapshot
- This is a 3-bed/2.0-bath single-family listed at $297k.
Deal economics
- At list price, monthly cash flow is $-326 ($-4k/yr) — negative.
- To cash-flow at today's rent, offer at most $250k (15.9% below list).
- To meet the 1% rule (rent ≥ 1% of price), the offer needs to be $224k (24.7% below list).
- Recommended offer: $224k (24.7% below list) — sets the bar for 1% rule.
- Cap rate 5.0% vs local median 3.6% in Anna — top-decile yield for the area; either an underpriced asset or a hidden risk that comps aren't pricing in. Stress-test before assuming the spread holds.
Location & tenants
- Location reads 75/100 on livability (#127 in TX, #3,880 nationally) — a middle-class / working-renter tenant base. Strengths: employment A+, housing A+, crime A; Watch: amenities F, commute F.
- Anna ISD (rural): math 44% / reading 41% proficiency, ranked #271 of 826 in TX (top 33%) — families likely to look elsewhere, expect single-tenant / working-renter base with shorter leases.
- Zoned schools: Joe K Bryant El (math 45% / reading 38%, grade F, #1,437 of 4,322 statewide, top 34%, 626 students, 53% FRL); Anna Middle (math 39% / reading 37%, grade F, #717 of 1,662 statewide, top 44%, 1,089 students, 51% FRL); Anna H S (math 58% / reading 57%, grade C, #327 of 1,632 statewide, top 20%, 1,405 students, 52% FRL).
- Market conditions: Rents soft (-1.9%/yr); 1205 active listings in the ZIP; 40 comparable units currently listed for rent nearby; rentals at typical pace (median 27d on market — plan ~3-4 weeks tenant-placement turnaround); solid renter incomes; 19,194 units permitted in Collin County in 2024 (3,988 in 5+ unit buildings).
Forward outlook
- Local home prices are declining (-3.0%/yr); year-one equity from $2k of loan paydown is wiped out by about $9k of value loss. Plan a longer hold.
- Collin County population projected at +60% by 2050 — long-run rental-demand tailwind backs the buy-and-hold thesis.
Negotiation context
- It's been on market 20 days — a 2% lower offer ($293k) is reasonable based on typical stale-listing flexibility.
Questions for the listing agent
- What do current leases actually rent for vs. the listed asking? Can we see a recent rent roll and the last 12 months of T-12 income?
- What does the HOA fee cover, when was the last increase, and are there any pending special assessments or reserve-fund shortfalls?
- Is there a deadline driving the sale (1031 exchange, divorce, estate, relocation)? That informs how much negotiation room exists.
- Schools are B-rated — typically a magnet for longer-tenancy family renters. What's the average tenant stay here, and is there a school-zone premium baked into asking?
- The area grade is low — what's the realistic commute time and amenity access for the typical tenant pool here? Any planned neighborhood developments (good or bad) we should know about?
- What's the average days-on-market for RENTAL listings here right now (not sales)? A rising rental-DOM trend means longer vacancies and softer asking-rent achievability than the comps imply.
- What's the recent tenant-quality profile in this submarket — average credit score on applications, eviction rate, late-payment / NSF rate, and stable-employment percentage? A property-management company in the area should have these aggregated.
- How much new for-sale + rental construction is in the pipeline within 1–3 miles? Heavy new supply typically softens prices + rents 12–24 months out; constrained supply supports both.
Investment metrics
- 1% rule
- 0.75% ✗
- Cap rate
- 4.97%
- Cash-on-cash
- -4.71%
- DSCR
- 0.79
- GRM
- 11.1
CMA / ARV
- ARV (median comp)
- $359,497
- List price
- $296,990
- Delta
- -17.39%
- Verdict
- UNDERPRICED
- Comps
- 20 within 1.0 mi
Show comp detail 12 sales within ~0.75 mi
| Address | Dist | Beds/Ba | Sqft | Sold | Price | $/sf | Match |
|---|---|---|---|---|---|---|---|
| 2020 Tacoma Way | 0.15mi | 3/2.0 | 1,646 (0%) | 1mo | $356,990 | $217 | 92 |
| 2148 Mantua Farms Blvd | 0.24mi | 3/2.0 | 1,646 (0%) | 2mo | $346,990 | $211 | 87 |
| 2104 Foggy Woods Ln | 0.21mi | 3/2.0 | 1,646 (0%) | 4mo | $281,990 | $171 | 87 |
| 2100 Foggy Woods Ln | 0.21mi | 3/2.0 | 1,703 (+4%) | 4mo | $296,990 | $174 | 81 |
| 2141 Mantua Farm Ln | 0.25mi | 3/2.0 | 1,703 (+4%) | 2mo | $296,990 | $174 | 81 |
| 2016 Ozark Hills Ln | 0.24mi | 3/2.0 | 1,703 (+4%) | 3mo | $361,990 | $213 | 81 |
| 2109 Tacoma Way | 0.24mi | 3/2.0 | 1,646 (0%) | 10mo | $346,990 | $211 | 80 |
| 2217 Ozark Hills Ln | 0.24mi | 3/2.0 | 1,703 (+4%) | 10mo | $326,990 | $192 | 75 |
| 1020 Calhoun Dr | 0.75mi | 3/2.0 | 1,647 (+0%) | 2mo | $298,000 | $181 | 64 |
| 2341 Chloe Ln | 0.28mi | 3/2.5 | 1,841 (+12%) | 4mo | $298,990 | $162 | 62 |
| 2205 Willie Ray St | 0.05mi | 2/2.5 (-1) | 1,802 (+10%) | 22mo | $2,240,000 | $1,243 | 57 |
| 1004 Santa Lucia Dr | 0.74mi | 3/2.5 | 1,777 (+8%) | 16mo | $394,600 | $222 | 37 |
Match score weights: distance 35% · size 25% · config 20% · recency 20%. Top-matched comps best support the ARV.
Projected returns pro-forma
-3.0% appreciation · 0.0% rent growth · sell at horizon
- IRR
- -27.7%
- Equity multiple
- 0.09×
- Total profit
- $-75,406
- Equity at exit
- $44,282
- IRR
- -42.9%
- Equity multiple
- -0.41×
- Total profit
- $-117,511
- Equity at exit
- $25,678
Cash invested: $83,157 (down + closing). Projections, not guarantees.
Landlord ↔ Tenant lean methodology
- Overall (STATE)
- 87 Strongly Landlord-Friendly
- State Texas
- 87 Strongly Landlord-Friendly · R+5
- County
- — inherits STATE
- City
- — inherits STATE
ZIP-level market 75409
- Home prices YoY
- -20.1%
- Rents YoY
- -1.9%
- Active inventory
- 1205
- Price-to-rent
- 11.1×
Monthly cashflow live
- Estimated rent
- $2,236 high interval (Pro) →
- Mortgage (P&I)
- −$1,557
- Tax est. 1.5%
- −$371 /mo · $4,455/yr
- Insurance
- −$124
- HOA
- −$40
- Vacancy / Maint / Mgmt
- −$469
- Net cashflow
- $-326
Break-even live
Sensitivity live
| Price | -10% $-121 | -5% $-224 | +0% $-326 | +5% $-429 | +10% $-532 |
|---|---|---|---|---|---|
| Rent | -10% $-503 | -5% $-415 | +0% $-326 | +5% $-238 | +10% $-150 |
| Rate | -1.0pp $-177 | -0.5pp $-251 | base $-326 | +0.5pp $-403 | +1.0pp $-482 |
UW: 25.0% down · 7.5% · 30yr · 1.5% tax · 5.0% vac · 8.0% maint · 8.0% mgmt
Financing live
Cash to close
- Down payment
- $74,248
- Closing costs
- $8,910
- Reserves months
- —
- Total cash needed
- —
Loan-product check · same deal, 3 products live
Conventional
25% down · 7.5% · 30yr
- Down + closing
- —
- Monthly P&I
- —
- Monthly cashflow
- —
- DSCR
- —
- Eligible?
- —
Personal DTI + credit; lowest rate.
DSCR
20% down · 8.5% · 30yr
- Down + closing
- —
- Monthly P&I
- —
- Monthly cashflow
- —
- DSCR
- —
- Eligible?
- —
No personal income docs; deal must DSCR.
Hard money
10% down · 12.0% · 12mo
- Down + closing
- —
- Monthly P&I
- —
- Monthly cashflow
- —
- DSCR
- —
- Eligible?
- —
Short-term bridge; refi at stabilization.
Rent comps 40 comps
| Address | Beds | Baths | Sqft | Rent | $/sqft | DOM | Units | Dist |
|---|---|---|---|---|---|---|---|---|
| 2144 Mantua Farm Blvd Anna, TX | 4.0 | 2.0 | 2121 | $2,395 | $1.13 | 22d | 1 | 0.21mi |
| 2144 Mantua Farm Blvd Anna, TX | 4.0 | 2.0 | 2121 | $2,395 | $1.13 | 45d | 1 | 0.21mi |
| 2117 Mantua Farm Blvd Anna, TX | 3.0 | 2.0 | 1646 | $1,990 | $1.21 | 24d | 1 | 0.23mi |
| 2200 N Buddy Hayes Blvd Unit 022 Anna, TX | 2.0 | 2.0 | 1195 | $1,749 | $1.46 | 45d | 1 | 0.24mi |
| 2137 Mantua Farm Blvd Anna, TX | 4.0 | 2.0 | 1960 | $2,150 | $1.10 | 45d | 1 | 0.26mi |
| 2152 Mantua Farm Blvd Anna, TX | 4.0 | 2.0 | 1960 | $2,300 | $1.17 | 45d | 1 | 0.31mi |
| 1016 Calhoun Dr Anna, TX | 3.0 | 3.0 | 1647 | $1,995 | $1.21 | 0d | 1 | 0.75mi |
| 1016 Portina Dr Anna, TX | 4.0 | 3.0 | 1906 | $2,500 | $1.31 | 20d | 1 | 0.75mi |
| 1020 Calhoun Dr Anna, TX | 3.0 | 2.0 | 1620 | $2,100 | $1.30 | 26d | 1 | 0.75mi |
| 929 Emerson Dr Anna, TX | 3.0 | 2.0 | 1620 | $1,995 | $1.23 | 14d | 1 | 0.79mi |
| 1913 McKee Ct Anna, TX | 3.0 | 2.0 | 1620 | $1,999 | $1.23 | 26d | 1 | 0.80mi |
| 925 Emerson Dr Anna, TX | 3.0 | 2.0 | 1647 | $2,050 | $1.24 | 26d | 1 | 0.80mi |
| 909 Emerson Dr Anna, TX | 3.0 | 2.0 | 1647 | $2,085 | $1.27 | 14d | 1 | 0.84mi |
| 808 Portina Dr Anna, TX | 4.0 | 3.0 | 2250 | $2,250 | $1.00 | 45d | 1 | 0.86mi |
| 737 Santa Lucia Dr Anna, TX | 4.0 | 2.5 | 1845 | $2,350 | $1.27 | 45d | 1 | 0.86mi |
| 1808 Willowhurst Ln Anna, TX | 3.0 | 2.0 | 2114 | $2,550 | $1.21 | 8d | 1 | 0.89mi |
| 809 Jackel Dr Anna, TX | 4.0 | 2.0 | 2025 | $2,025 | $1.00 | 9d | 1 | 0.89mi |
| 804 Emerson Dr Anna, TX | 3.0 | 2.0 | 1640 | $3,300 | $2.01 | 45d | 1 | 0.91mi |
| 748 Thorncreek Dr Anna, TX | 3.0 | 2.5 | 1715 | $2,100 | $1.22 | 0d | 1 | 0.96mi |
| 732 Thorncreek Dr Anna, TX | 3.0 | 2.5 | 1954 | $2,050 | $1.05 | 26d | 1 | 0.97mi |
| 2100 Hardwick Dr Anna, TX | 4.0 | 2.0 | 2025 | $2,190 | $1.08 | 26d | 1 | 1.00mi |
| 3036 Still Creek Ln Anna, TX | 3.0 | 2.5 | 1675 | $2,100 | $1.25 | 45d | 1 | 1.00mi |
| 517 Amenduni Ln Anna, TX | 4.0 | 2.0 | 1983 | $2,345 | $1.18 | 26d | 1 | 1.01mi |
| 509 Amenduni Ln Anna, TX | 3.0 | 2.0 | 1800 | $2,295 | $1.27 | 26d | 1 | 1.02mi |
| 1817 Atwood Dr Anna, TX | 4.0 | 2.0 | 1801 | $2,100 | $1.17 | 45d | 1 | 1.02mi |
| 2113 Atwood Dr Anna, TX | 4.0 | 2.0 | 2006 | $2,095 | $1.04 | 14d | 1 | 1.03mi |
| 501 Amenduni Ln Anna, TX | 4.0 | 2.0 | 1981 | $2,250 | $1.14 | 45d | 1 | 1.04mi |
| 311 Charleston Dr Anna, TX | 3.0 | 2.0 | 1648 | $1,850 | $1.12 | 26d | 1 | 1.04mi |
| 1309 Lazy Grove Dr Anna, TX | 4.0 | 2.0 | 1838 | $2,295 | $1.25 | 0d | 1 | 1.06mi |
| 2049 Helmoken Falls Dr Anna, TX | 4.0 | 2.0 | 2180 | $1,995 | $0.92 | 5d | 1 | 1.06mi |
| 629 Harbor Oaks Dr Anna, TX | 3.0 | 2.0 | 1620 | $2,100 | $1.30 | 45d | 1 | 1.06mi |
| 311 Olivia Ln Anna, TX | 3.0 | 2.0 | 1601 | $1,899 | $1.19 | 5d | 1 | 1.07mi |
| 512 Tartane Dr Anna, TX | 3.0 | 2.0 | 1974 | $2,190 | $1.11 | 45d | 1 | 1.07mi |
| 2105 Meadow Dr Anna, TX | 4.0 | 2.0 | 2006 | $2,075 | $1.03 | 26d | 1 | 1.08mi |
| 2121 Meadow Dr Anna, TX | 4.0 | 2.0 | 2006 | $2,430 | $1.21 | 4d | 1 | 1.08mi |
| 324 Amenduni Ln Anna, TX | 3.0 | 2.0 | 1796 | $2,000 | $1.11 | 45d | 1 | 1.10mi |
| 324 Amenduni Ln Anna, TX | 3.0 | 2.0 | 1796 | $2,000 | $1.11 | 26d | 1 | 1.10mi |
| 132 Stanley Falls Dr Anna, TX | 3.0 | 2.0 | 1841 | $1,995 | $1.08 | 45d | 1 | 1.10mi |
| 613 Emerson Dr Anna, TX | 4.0 | 2.0 | 1801 | $2,050 | $1.14 | 26d | 1 | 1.10mi |
| 1608 Helmoken Falls Dr Anna, TX | 4.0 | 2.0 | 2010 | $2,295 | $1.14 | 3d | 1 | 1.12mi |
HOA detail
- Monthly dues
- $40 · $480/yr
Listing history 2 events
-
2026-05-15status Pending 143-char remark
-
2026-04-24$296,990 Active 143-char remark
ⓘ Source: listings_history table (triggers on properties + properties_extension) + one-shot
backfill from property_details.listing_events for pre-trigger history.
Nearby sold comps map
Loading sold comps map…
Walkable amenities ~0.75 mi
Loading nearby amenities…
Taxation est. · year 1
- Rental income
- $26,826
- − Mortgage interest
- −$16,636
- − Property taxes
- −$4,455
- − Insurance
- −$1,485
- − Repairs & maintenance
- −$2,146
- − Management
- −$2,146
- − HOA
- −$480
- − Depreciation
- −$8,640
- Taxable loss
- −$9,162
- Est. tax savings @ 24.0%
- +$2,199
- After-tax cash flow
- $-1,718/yr
For passive investors: Depreciation is non-cash, so a rental often shows a tax loss while cash-flowing — sheltering income. Rental losses are passive: they offset passive income freely, and up to $25,000/yr can offset ordinary (W-2) income if you actively participate and your MAGI is under $100k (phasing out to $0 by $150k); unused losses carry forward. On sale, claimed depreciation is recaptured at up to 25%, and gains may owe capital-gains tax (a 1031 exchange can defer both). Figures are a year-1 estimate at your 24.0% rate — not tax advice; consult a CPA.
Schools (NCES district)
- District
- Anna ISD
- NCES district ID
- 4808340
- Math proficiency
- 44% ▼ -9.00%
- Reading proficiency
- 41% ▼ -4.00%
- Median HH income
- $67,456
- Composite
- 38.26/100
- National rank
- #4241
- State rank
- #271 of 826 in TX
Livability — Anna
- Score
- 75/100
- State rank
- #127
- US rank
- #3880
Category grades
Schools grade is shown separately in the Schools card above.
Census & demographics
- Census place
- Anna, TX
- County
- Collin County · 1,159,394 people
- City population
- 27,131
- Metro
- Dallas-Fort Worth-Arlington, TX
- Population (ZIP)
- 27,131
- Household income
- $104,814
- Rent vs Own
- Severe rent burden
- 454.0
Population outlook (Collin County) Hauer SSP2
- Today (2025)
- 1,210,074 people
- By 2030
- 1,358,201 · +12.2%
- By 2040
- 1,654,061 · +36.7%
- By 2050
- 1,937,359 · +60.1%
- By 2075
- 2,567,039 · +112.1%
- By 2100
- 2,952,048 · +144.0%
Race, ethnicity, and origin ACS 2023
- Neighborhood character
- Diverse neighborhood (Simpson 0.56)
- Race & ethnicity
- White 61% Hispanic / Latino 20% Black 15% Two or more races 6% Asian 1%
- Hispanic origin (detail)
- Mexican 16% Puerto Rican 1%
- Common ancestry
- Italian 3% Lithuanian 2% Slovak 1%
- Foreign-born
- 10% · Canada
- Languages at home
- 79% English-only · Spanish 18% French/Haitian/Cajun 2%
Political lean MEDSL · Collin
- 2024 margin
- R (+11.1) · D 43.1% · R 54.3% · Other 2.6%
- 2008→2024 swing
- +14.4pp toward D · 2008: -25.6pp · 2024: -11.1pp
- All cycles
- 2024: R+11.1 2020: R+4.3 2016: R+17.0 2012: R+31.6 2008: R+25.6
Not yet ingested
- Civics
- —
Market trends
- HPI YoY
- ▼ -58.99%
- Current HPI
- 235.0945
- Rent YoY
- ▼ -1.92%
- Metro
- Dallas-Fort Worth-Arlington, TX
- State GDP YoY
- ▲ 3.95%
- F500 in state
- 110
Industry mix (Fortune 500 HQ in TX)
| Industry | F500 HQs | Revenue |
|---|---|---|
| Energy | 16 | $1,198B |
|
||
| Technology | 5 | $198B |
|
||
| Engineering / Construction | 4 | $72B |
|
||
| Energy Services | 3 | $60B |
|
||
| Utilities | 3 | $41B |
|
||
| Healthcare | 2 | $330B |
|
||
Price history
2 events — show timeline
- 2026-05-15 Pending — NTREIS
- 2026-04-24 Listed $296,990 NTREIS
Cash-flow waterfall
monthlySold comps — $/sqft
last 12 mo · ≤1 miLoading sold comps…