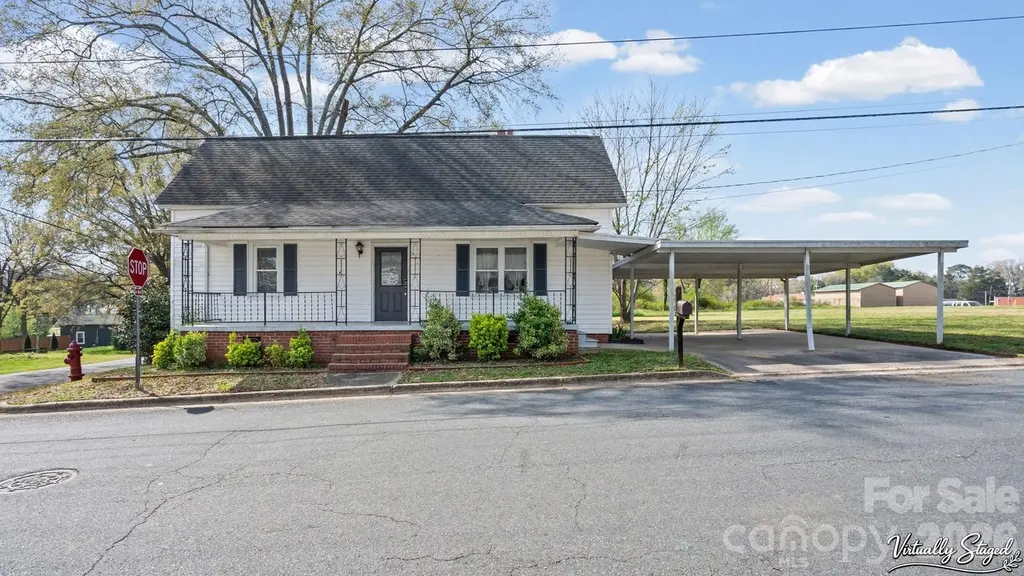
901 Mill St · Albemarle, NC
Flood risk 1/10 · Minimal
- FEMA flood zone
- X (unshaded)
- Chance of flooding over 30 yrs
- 0.0%
- Est. flood insurance / yr
- $507 – $1,088
Fire risk 1/10 · Minimal
- Est. fire insurance / yr
- $906 – $1,684
Heat risk 6/10 · Moderate
- Hot days now (above 106°F)
- 7 days/yr
- Hot days in 30 yrs
- 16 days/yr
Wind risk 6/10 · Moderate
- Chance of severe wind over 30 yrs
- 27.0%
Air-quality risk 2/10 · Minimal
- Unhealthy air days now
- 2 days/yr
- Unhealthy air days in 30 yrs
- 2 days/yr
Risk factors via First Street. Map © Google.
Why this score? — see what drove the D+ grade
The composite is a weighted blend of 9 inputs, each scored 0–100. Each bar is that input's sub-score; the figure is the points it added to the 100-point composite (weight × sub-score).
- Cash flow +14.3/30.0
- ARV discount +13.6/15.0
- DSCR +4.3/10.0
- Schools +3.4/10.0
- Livability +3.4/5.0
- 1% rule +3.2/10.0
- Rent growth +2.5/5.0
- Condition / age +2.5/5.0
- Appreciation +0.0/10.0
$165,000
🖨 Deal sheet (PDF) 📄 Offer letter ✓ Due diligence
Listing remarks
Charming opportunity in the heart of Albemarle! Welcome to 901 Mill St, a property full of character and ready for its next chapter. This home offers a spacious layout with great natural light, providing a wonderful canvas for buyers looking to personalize and create something truly special. Inside, you’ll find generous living areas, well-proportioned bedrooms, and a functional floor plan that lends itself to a variety of design possibilities. Whether you’re envisioning modern updates or preserving its original charm, the potential here is easy to see. Enjoy a classic front porch, a 2-car carport, and a convenient backyard storage building, along with a lot that offers space for
Key facts
- 2-car carport
- Front porch
- Dining
Tags
Neighborhood map
What this means for you Summary
Snapshot
- This is a 2-bed/1.0-bath single-family listed at $165k.
Deal economics
- At list price, monthly cash flow is $29 ($345/yr) — positive.
- The deal already cash-flows at list — no discount required.
- To meet the 1% rule (rent ≥ 1% of price), the offer needs to be $135k (17.9% below list).
- Recommended offer: $135k (17.9% below list) — sets the bar for 1% rule.
- Cap rate 6.5% vs local median 3.3% in Albemarle — top-decile yield for the area; either an underpriced asset or a hidden risk that comps aren't pricing in. Stress-test before assuming the spread holds.
Location & tenants
- Location reads 68/100 on livability (#167 in NC) — a middle-class / working-renter tenant base. Strengths: cost of living A+, housing A+, health & safety A+; Watch: crime D-, amenities F, commute F.
- Stanly County Schools (rural): math 38% / reading 42% proficiency, ranked #113 of 178 in NC (top 64%) — families likely to look elsewhere, expect single-tenant / working-renter base with shorter leases.
- Zoned schools: Central Elementary (math 25% / reading 26%, grade F, #1,093 of 1,410 statewide, top 78%, 546 students, 100% FRL); Albemarle Middle (math 22% / reading 35%, grade F, #355 of 475 statewide, top 76%, 409 students, 99% FRL); Albemarle High (math 42% / reading 27%, grade F, #427 of 535 statewide, top 81%, 390 students, 97% FRL) — zoned schools average 98% FRL vs 46% district-wide (52 pts higher); higher-poverty schools than district average — tighter screening recommended.
- Market conditions: 278 active listings in the ZIP; 13 comparable units currently listed for rent nearby; rentals at typical pace (median 20d on market — plan ~3-4 weeks tenant-placement turnaround); 367 units permitted in Stanly County in 2024 (0 in 5+ unit buildings).
Forward outlook
- Local home prices are declining (-3.0%/yr); year-one equity from $1k of loan paydown is wiped out by about $5k of value loss. Plan a longer hold.
- Stanly County population projected at -10% by 2050 — secular population decline; favor cash flow + early exit over multi-decade hold.
Negotiation context
- Only 14 days on market — expect competitive offers; lowballing is unlikely to land.
- Current owner paid $89k; list at $165k implies a 85% gain — meaningful room to come down on a strong offer.
Risks & watch-outs
- Watch-outs: built in 1915 — expect roof / HVAC / electrical / plumbing capex.
- Climate carrying-cost: major wind risk, 27% chance of damaging wind over 30y; extreme-heat days projected 7→16/yr by 2055 (HVAC capex compounding) — expect insurance premiums to compound above CPI over the hold.
Questions for the listing agent
- Built in 1915 — when were the roof, HVAC, electrical panel, plumbing, and water heater last replaced?
- Is there a deadline driving the sale (1031 exchange, divorce, estate, relocation)? That informs how much negotiation room exists.
- Schools are D-rated, which usually means shorter tenancies and higher turnover. Who's the typical renter profile here, and what's been the actual vacancy rate?
- Crime grade is D in this area — have there been break-ins, vandalism, or insurance claims at this property in the last 3 years? What carrier currently insures it and at what premium?
- The area grade is low — what's the realistic commute time and amenity access for the typical tenant pool here? Any planned neighborhood developments (good or bad) we should know about?
- What's the average days-on-market for RENTAL listings here right now (not sales)? A rising rental-DOM trend means longer vacancies and softer asking-rent achievability than the comps imply.
- What's the recent tenant-quality profile in this submarket — average credit score on applications, eviction rate, late-payment / NSF rate, and stable-employment percentage? A property-management company in the area should have these aggregated.
- How much new for-sale + rental construction is in the pipeline within 1–3 miles? Heavy new supply typically softens prices + rents 12–24 months out; constrained supply supports both.
Investment metrics
- 1% rule
- 0.82% ✗
- Cap rate
- 6.50%
- Cash-on-cash
- 0.75%
- DSCR
- 1.03
- GRM
- 10.2
CMA / ARV
- ARV (on-the-fly)
- $190,652
- Comps found
- 12
Show comp detail 12 sales within ~0.75 mi
| Address | Dist | Beds/Ba | Sqft | Sold | Price | $/sf | Match |
|---|---|---|---|---|---|---|---|
| 901 Mill St | 0.00mi | 2/2.0 | 1,238 (0%) | 1mo | $140,000 | $113 | 96 |
| 406 Church St | 0.11mi | 2/1.0 | 1,221 (-1%) | 7mo | $200,000 | $164 | 87 |
| 211 Austin St | 0.17mi | 3/1.5 (+1) | 1,296 (+5%) | 3mo | $185,000 | $143 | 75 |
| 1119 Poplar St | 0.33mi | 3/2.0 (+1) | 1,268 (+2%) | 3mo | $85,000 | $67 | 69 |
| 1104 Wood St | 0.26mi | 3/2.0 (+1) | 1,329 (+7%) | 2mo | $255,000 | $192 | 65 |
| 1416 W Park Ave | 0.41mi | 3/1.0 (+1) | 1,305 (+5%) | 3mo | $171,450 | $131 | 65 |
| 1723 Lowder St | 0.42mi | 3/2.0 (+1) | 1,232 (-0%) | 8mo | $245,000 | $199 | 64 |
| 128 Harwood St | 0.34mi | 2/1.0 | 1,112 (-10%) | 6mo | $155,000 | $139 | 62 |
| 346 N Depot St | 0.55mi | 2/1.0 | 1,356 (+10%) | 1mo | $198,000 | $146 | 57 |
| 823 Hill St | 0.43mi | 3/2.0 (+1) | 1,362 (+10%) | 1mo | $210,000 | $154 | 53 |
| 1229 Poplar St | 0.41mi | 2/2.0 | 1,412 (+14%) | 3mo | $260,000 | $184 | 51 |
| 909 Pennington Rd | 0.53mi | 3/2.0 (+1) | 1,422 (+15%) | 2mo | $282,700 | $199 | 40 |
Match score weights: distance 35% · size 25% · config 20% · recency 20%. Top-matched comps best support the ARV.
Projected returns pro-forma
-3.0% appreciation · 3.0% rent growth · sell at horizon
- IRR
- -15.1%
- Equity multiple
- 0.46×
- Total profit
- $-24,944
- Equity at exit
- $24,602
- IRR
- -6.6%
- Equity multiple
- 0.58×
- Total profit
- $-19,525
- Equity at exit
- $14,266
Cash invested: $46,200 (down + closing). Projections, not guarantees.
Landlord ↔ Tenant lean methodology
- Overall (STATE)
- 85 Strongly Landlord-Friendly
- State North Carolina
- 85 Strongly Landlord-Friendly · R+3
- County
- — inherits STATE
- City
- — inherits STATE
ZIP-level market 28001
- Home prices YoY
- -33.1%
- Active inventory
- 278
- Price-to-rent
- 10.2×
Monthly cashflow live
- Estimated rent
- $1,354 high interval (Pro) →
- Mortgage (P&I)
- −$865
- Tax from tax record
- −$107 /mo · $1,282/yr
- Insurance
- −$69
- HOA
- −$0
- Vacancy / Maint / Mgmt
- −$284
- Net cashflow
- $29
Break-even live
Sensitivity live
| Price | -10% $122 | -5% $75 | +0% $29 | +5% $-18 | +10% $-65 |
|---|---|---|---|---|---|
| Rent | -10% $-78 | -5% $-25 | +0% $29 | +5% $82 | +10% $136 |
| Rate | -1.0pp $112 | -0.5pp $71 | base $29 | +0.5pp $-14 | +1.0pp $-57 |
UW: 25.0% down · 7.5% · 30yr · 1.5% tax · 5.0% vac · 8.0% maint · 8.0% mgmt
Financing live
Cash to close
- Down payment
- $41,250
- Closing costs
- $4,950
- Reserves months
- —
- Total cash needed
- —
Loan-product check · same deal, 3 products live
Conventional
25% down · 7.5% · 30yr
- Down + closing
- —
- Monthly P&I
- —
- Monthly cashflow
- —
- DSCR
- —
- Eligible?
- —
Personal DTI + credit; lowest rate.
DSCR
20% down · 8.5% · 30yr
- Down + closing
- —
- Monthly P&I
- —
- Monthly cashflow
- —
- DSCR
- —
- Eligible?
- —
No personal income docs; deal must DSCR.
Hard money
10% down · 12.0% · 12mo
- Down + closing
- —
- Monthly P&I
- —
- Monthly cashflow
- —
- DSCR
- —
- Eligible?
- —
Short-term bridge; refi at stabilization.
Rent comps 13 comps
| Address | Beds | Baths | Sqft | Rent | $/sqft | DOM | Units | Dist |
|---|---|---|---|---|---|---|---|---|
| 116 Church St Albemarle, NC | 3.0 | 1.0 | 1172 | $1,130 | $0.96 | 4d | 1 | 0.24mi |
| 324 Belmont Cir Albemarle, NC | 2.0 | 2.0 | 1346 | $1,250 | $0.93 | 19d | 1 | 0.48mi |
| 330 N Depot St Albemarle, NC | 2.0 | 1.0 | 950 | $1,350 | $1.42 | 6d | 1 | 0.53mi |
| 1631 Maple Ave Albemarle, NC | 2.0 | 1.0 | 1180 | $1,550 | $1.31 | 0d | 1 | 0.57mi |
| 197 N 2nd St Unit 301 Albemarle, NC | 1.0 | 1.0 | 872 | $1,800 | $2.06 | 25d | 1 | 0.67mi |
| 197 N 2nd St Albemarle, NC | 2.0 | 1.0 | 1100 | $2,365 | $2.15 | 25d | 1 | 0.67mi |
| 197 N 2nd St Unit 005 Albemarle, NC | 1.0 | 1.0 | 733 | $1,225 | $1.67 | 25d | 1 | 0.67mi |
| 255 N 3rd St Albemarle, NC | 2.0 | 2.0 | 1100 | $1,000 | $0.91 | 25d | 1 | 0.74mi |
| 412 N 4th St Albemarle, NC | 2.0 | 1.5 | 820 | $1,400 | $1.71 | 25d | 1 | 0.91mi |
| 121 Heath St Apt 16 Albemarle, NC | 2.0 | 1.0 | 750 | $995 | $1.33 | 14d | 1 | 1.06mi |
| 451 Montgomery Ave Unit 5 Albemarle, NC | 3.0 | 2.0 | 1450 | $1,275 | $0.88 | 12d | 1 | 1.09mi |
| 451 Montgomery Ave Unit 5 Albemarle, NC | 3.0 | 2.0 | 1450 | $1,275 | $0.88 | 0d | 1 | 1.09mi |
| 117 N 6th St Albemarle, NC | 1.0 | 1.0 | 739 | $950 | $1.29 | 25d | 1 | 1.11mi |
Listing history 4 events
-
2026-04-22status Pending
-
2026-04-08$165,000 Active
-
2020-01-10soldstatus $89,000
-
2007-04-26soldstatus $76,500
ⓘ Source: listings_history table (triggers on properties + properties_extension) + one-shot
backfill from property_details.listing_events for pre-trigger history.
Tax reassessment forecast NC · Resets to sale price
- Current annual tax
- $1,282 · $107/mo
- Projected year-2 tax
- $1,353 · $113/mo
- Expected delta
- +$71/yr (+$6/mo · 5.5%)
ⓘ Screening estimate from a state-policy table — verify with the county assessor before closing.
Climate risk First Street
- Flood 1/10 Low FEMA zone X (unshaded) · 0% chance over 30 yrs
- Wildfire 1/10 Low
- Heat 6/10 Major 7 d/yr ≥106°F today · 16 d/yr by 30 yrs out
- Wind 6/10 Major 27% chance of damaging wind over 30 yrs
- Air quality 2/10 Low 2 unhealthy d/yr today · 2 by 30 yrs out
Nearby sold comps map
Loading sold comps map…
Walkable amenities ~0.75 mi
Loading nearby amenities…
Taxation est. · year 1
- Rental income
- $16,248
- − Mortgage interest
- −$9,243
- − Property taxes
- −$1,282
- − Insurance
- −$825
- − Repairs & maintenance
- −$1,300
- − Management
- −$1,300
- − Depreciation
- −$4,800
- Taxable loss
- −$2,501
- Est. tax savings @ 24.0%
- +$600
- After-tax cash flow
- $946/yr
For passive investors: Depreciation is non-cash, so a rental often shows a tax loss while cash-flowing — sheltering income. Rental losses are passive: they offset passive income freely, and up to $25,000/yr can offset ordinary (W-2) income if you actively participate and your MAGI is under $100k (phasing out to $0 by $150k); unused losses carry forward. On sale, claimed depreciation is recaptured at up to 25%, and gains may owe capital-gains tax (a 1031 exchange can defer both). Figures are a year-1 estimate at your 24.0% rate — not tax advice; consult a CPA.
Schools (NCES district)
- District
- Stanly County Schools
- NCES district ID
- 3704320
- Math proficiency
- 38% ▼ -1.00%
- Reading proficiency
- 42% ▲ 1.00%
- Median HH income
- $43,802
- Composite
- 33.9/100
- National rank
- #5343
- State rank
- #113 of 178 in NC
Livability — Albemarle
- Score
- 68/100
- State rank
- #167
- US rank
- #8957
Category grades
Schools grade is shown separately in the Schools card above.
Census & demographics
- Census place
- Albemarle, NC
- City population
- 26,187
- Population (ZIP)
- 26,187
Population outlook (Stanly County) Hauer SSP2
- Today (2025)
- 60,082 people
- By 2030
- 59,485 · -1.0%
- By 2040
- 57,407 · -4.5%
- By 2050
- 54,051 · -10.0%
- By 2075
- 45,384 · -24.5%
- By 2100
- 34,694 · -42.3%
Race, ethnicity, and origin ACS 2023
- Neighborhood character
- Predominantly White (75%)
- Race & ethnicity
- White 75% Black 15% Hispanic / Latino 5% Two or more races 3% Asian 3%
- Hispanic origin (detail)
- Mexican 4%
- Common ancestry
- Serbian 3% Slovak 2% Italian 1%
- Foreign-born
- 4% · Canada, Vietnam
- Languages at home
- 93% English-only · Spanish 4% Other Asian/Pacific 2% Vietnamese 1%
Political lean MEDSL · Stanly
- 2024 margin
- Solid R (+50.9) · D 24.2% · R 75.1%
- 2008→2024 swing
- -14.2pp toward R · 2008: -36.7pp · 2024: -50.9pp
- All cycles
- 2024: R+50.9 2020: R+51.1 2016: R+50.2 2012: R+40.4 2008: R+36.7
Not yet ingested
- Civics
- —
Market trends
- HPI YoY
- ▼ -109.68%
- Current HPI
- 221.8601
- Rent YoY
- —
- Metro
- —
- State GDP YoY
- ▲ 3.28%
- F500 in state
- 26
Industry mix (Fortune 500 HQ in NC)
| Industry | F500 HQs | Revenue |
|---|---|---|
| Financial Services | 2 | $213B |
|
||
| Retail | 2 | $95B |
|
||
| Industrial Conglomerate | 1 | $38B |
|
||
| Metals / Steel | 1 | $35B |
|
||
| Utilities | 1 | $30B |
|
||
| Industrial Machinery | 1 | $19B |
|
||
Price history
+115.7% since first listed4 events — show timeline
- 2026-04-22 Pending — CANOPYMLS as Distributed by MLS Grid
- 2026-04-08 Listed $165,000 CANOPYMLS as Distributed by MLS Grid
- 2020-01-10 Sold (Public Records) $89,000 Public Records
- 2007-04-26 Sold (Public Records) $76,500 Public Records
Property tax history
+4.1%/yrLatest (2025): $1,282 · +24.3% YoY. Source: county tax records.
Cash-flow waterfall
monthlySold comps — $/sqft
last 12 mo · ≤1 miLoading sold comps…