335 W North · Greensburg, IN
Flood risk 1/10 · Minimal
- FEMA flood zone
- X (unshaded)
- Chance of flooding over 30 yrs
- 0.0%
- Est. flood insurance / yr
- $507 – $1,088
Fire risk 1/10 · Minimal
- Est. fire insurance / yr
- $717 – $1,331
Heat risk 4/10 · Minor
- Hot days now (above 102°F)
- 7 days/yr
- Hot days in 30 yrs
- 19 days/yr
Wind risk 2/10 · Minimal
- Chance of severe wind over 30 yrs
- 1.0%
Air-quality risk 2/10 · Minimal
- Unhealthy air days now
- 1 days/yr
- Unhealthy air days in 30 yrs
- 2 days/yr
Risk factors via First Street. Map © Google.
Why this score? — see what drove the B+ grade
The composite is a weighted blend of 9 inputs, each scored 0–100. Each bar is that input's sub-score; the figure is the points it added to the 100-point composite (weight × sub-score).
- Cash flow +30.0/30.0
- ARV discount +13.8/15.0
- 1% rule +10.0/10.0
- DSCR +10.0/10.0
- Schools +3.8/10.0
- Livability +3.5/5.0
- Rent growth +2.5/5.0
- Condition / age +2.5/5.0
- Appreciation +0.0/10.0
$156,900
🖨 Deal sheet 📄 Offer letter ✓ Due diligence
Listing remarks MLS
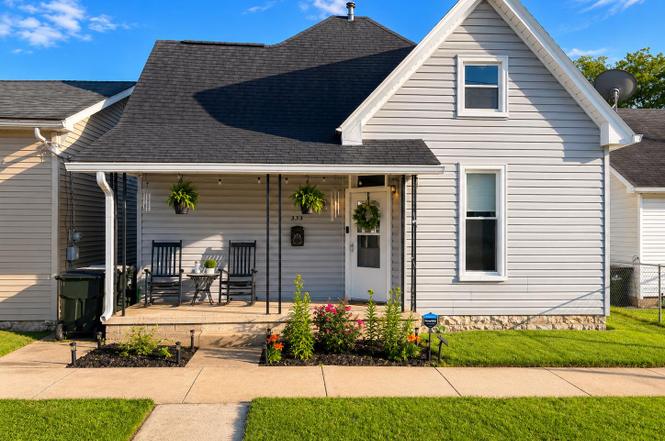
Some homes are built-others are crafted. This timeless 2 bedroom, 1 bath traditional home is a rare blend of enduring character and thoughtful, move-in-ready updates that today's buyers have been waiting for. The covered porch sets the tome - an inviting entry that speaks to a slower, more intentional way of living. Once you step inside, you will see the unique moldings and craftsmanship that simply isn't replicated today. Attic space can be renovated to add more space or an upstairs primary. Schedule your private showing today and experience what makes this home truly one of a kind.
Key facts
- Covered porch
- Attic space
- Unique moldings
Tags
Property features AI
Exterior
- Utilities: Public water; Municipal sewer
- Home design: Single-family residence; One-and-a-half story
- Construction: Vinyl siding; Crawl space foundation
- Exterior features: Lot smaller than 1/4 acre (approximately 0.06 acres)
Interior
- Bedrooms: Two bedrooms (both on the main level)
- Bathrooms: One full bathroom (main level)
- Heating & cooling: Forced air heating; Central air conditioning
- Interior features: Attic stairway
- Laundry & utility: Washer; Dryer
Neighborhood map
What this means for you Summary
Snapshot
- This is a 2-bed/1.0-bath single-family listed at $157k.
Deal economics
- At list price, monthly cash flow is $2k ($27k/yr) — positive.
- The deal already cash-flows at list — no discount required.
- Meets the 1% rule at list price ($4k rent vs $157k).
- Cap rate 23.3% vs local median 5.9% in Greensburg — top-decile yield for the area; either an underpriced asset or a hidden risk that comps aren't pricing in. Stress-test before assuming the spread holds.
Location & tenants
- Location reads 69/100 on livability (#200 in IN) — a middle-class / working-renter tenant base. Strengths: cost of living A+, housing A+, crime B+; Watch: employment C-, amenities F, commute F.
- Greensburg Community Schools (town): math 38% / reading 51% proficiency, ranked #102 of 301 in IN (top 34%) — families likely to look elsewhere, expect single-tenant / working-renter base with shorter leases.
- Zoned schools: Greensburg Elementary (math 60% / reading 47%, grade C, #225 of 994 statewide, top 23%, 1,037 students, 55% FRL); Greensburg Community High School (math 27% / reading 67%, grade D-, #143 of 369 statewide, top 44%, 671 students, 44% FRL).
- Market conditions: 155 active listings in the ZIP; 1 comparable units currently listed for rent nearby; 66 units permitted in Decatur County in 2024 (0 in 5+ unit buildings).
Forward outlook
- Local home prices are declining (-3.0%/yr); year-one equity from $1k of loan paydown is wiped out by about $5k of value loss. Plan a longer hold.
- Decatur County population projected at +6% by 2050 — modest demand growth; plan on rents tracking national, not racing it.
- At projected returns (-3.0% appreciation + 3.0% rent growth), your $44k cash investment doubles in ~2 years — after that, you're playing with house money.
Negotiation context
- Only 3 days on market — expect competitive offers; lowballing is unlikely to land.
- 3 sale attempts since 3y ago with the ask held roughly flat each time — persistent listings suggest the price (not the market) is what's stuck; bring a comps-based counter.
- Current owner paid $135k; 16% above their basis — modest negotiation headroom, anchor on the comps not their cost.
Risks & watch-outs
- Watch-outs: built in 1953 — expect roof / HVAC / electrical / plumbing capex.
Questions for the listing agent
- Built in 1953 — when were the roof, HVAC, electrical panel, plumbing, and water heater last replaced?
- Is there a deadline driving the sale (1031 exchange, divorce, estate, relocation)? That informs how much negotiation room exists.
- Schools are D-rated, which usually means shorter tenancies and higher turnover. Who's the typical renter profile here, and what's been the actual vacancy rate?
- What's the average days-on-market for RENTAL listings here right now (not sales)? A rising rental-DOM trend means longer vacancies and softer asking-rent achievability than the comps imply.
- What's the recent tenant-quality profile in this submarket — average credit score on applications, eviction rate, late-payment / NSF rate, and stable-employment percentage? A property-management company in the area should have these aggregated.
- How much new for-sale + rental construction is in the pipeline within 1–3 miles? Heavy new supply typically softens prices + rents 12–24 months out; constrained supply supports both.
Investment metrics
- 1% rule
- 2.55% ✓
- Cap rate
- 23.29%
- Cash-on-cash
- 60.70%
- DSCR
- 3.70
- GRM
- 3.3
CMA / ARV
- ARV (on-the-fly)
- $182,672
- Comps found
- 12
Show comp detail 12 sales within ~0.75 mi
| Address | Dist | Beds/Ba | Sqft | Sold | Price | $/sf | Match |
|---|---|---|---|---|---|---|---|
| 401 W Walnut St | 0.23mi | 2/1.0 | 1,962 (+5%) | 12mo | $160,000 | $82 | 70 |
| 311 E Central Ave | 0.42mi | 3/2.0 (+1) | 1,808 (-3%) | 1mo | $185,000 | $102 | 66 |
| 323 E Walnut St | 0.49mi | 2/1.0 | 1,991 (+7%) | 4mo | $185,000 | $93 | 62 |
| 628 W Walnut St | 0.33mi | 3/2.5 (+1) | 1,790 (-4%) | 12mo | $285,000 | $159 | 57 |
| 320 E Central Ave | 0.44mi | 3/2.0 (+1) | 1,858 (-0%) | 19mo | $173,000 | $93 | 54 |
| 315 W Walnut St | 0.24mi | 3/2.0 (+1) | 1,659 (-11%) | 10mo | $145,000 | $87 | 53 |
| 327 W Bryant St | 0.57mi | 3/1.0 (+1) | 1,709 (-8%) | 7mo | $200,000 | $117 | 49 |
| 210 W 1st St | 0.39mi | 3/2.0 (+1) | 2,120 (+14%) | 2mo | $229,000 | $108 | 48 |
| 912 N Broadway St | 0.52mi | 2/1.5 | 2,034 (+9%) | 14mo | $200,000 | $98 | 47 |
| 336 S Franklin St | 0.50mi | 3/1.0 (+1) | 1,666 (-11%) | 15mo | $72,000 | $43 | 42 |
| 713 S Ireland St | 0.61mi | 3/1.0 (+1) | 2,128 (+14%) | 8mo | $164,000 | $77 | 36 |
| 432 E Walnut St | 0.63mi | 3/2.0 (+1) | 2,114 (+13%) | 9mo | $360,000 | $170 | 32 |
Match score weights: distance 35% · size 25% · config 20% · recency 20%. Top-matched comps best support the ARV.
Projected returns pro-forma
-3.0% appreciation · 3.0% rent growth · sell at horizon
- IRR
- 59.5%
- Equity multiple
- 3.64×
- Total profit
- $116,072
- Equity at exit
- $23,394
- IRR
- 64.2%
- Equity multiple
- 7.45×
- Total profit
- $283,185
- Equity at exit
- $13,566
Cash invested: $43,932 (down + closing). Projections, not guarantees.
Landlord ↔ Tenant lean methodology
- Overall (STATE)
- 90 Strongly Landlord-Friendly
- State Indiana
- 90 Strongly Landlord-Friendly · R+11
- County
- — inherits STATE
- City
- — inherits STATE
ZIP-level market 47240
- Home prices YoY
- -25.0%
- Active inventory
- 155
- Price-to-rent
- 3.3×
Monthly cashflow live
- Estimated rent
- $3,995 medium interval (Pro) →
- Mortgage (P&I)
- −$823
- Tax from tax record
- −$46 /mo · $549/yr
- Insurance
- −$65
- HOA
- −$0
- Vacancy / Maint / Mgmt
- −$839
- Net cashflow
- $2,222
Break-even live
UW: 25.0% down · 7.5% · 30yr · 1.5% tax · 5.0% vac · 8.0% maint · 8.0% mgmt
Financing live
Cash to close
- Down payment
- $39,225
- Closing costs
- $4,707
- Reserves months
- —
- Total cash needed
- —
Loan-product check · same deal, 3 products live
Conventional
25% down · 7.5% · 30yr
- Down + closing
- —
- Monthly P&I
- —
- Monthly cashflow
- —
- DSCR
- —
- Eligible?
- —
Personal DTI + credit; lowest rate.
DSCR
20% down · 8.5% · 30yr
- Down + closing
- —
- Monthly P&I
- —
- Monthly cashflow
- —
- DSCR
- —
- Eligible?
- —
No personal income docs; deal must DSCR.
Hard money
10% down · 12.0% · 12mo
- Down + closing
- —
- Monthly P&I
- —
- Monthly cashflow
- —
- DSCR
- —
- Eligible?
- —
Short-term bridge; refi at stabilization.
Rent comps 1 comps
| Address | Beds | Baths | Sqft | Rent | $/sqft | DOM | Units | Dist |
|---|---|---|---|---|---|---|---|---|
| 1011 N Anderson St Greensburg, IN | 3.0 | 2.5 | 1620 | $3,995 | $2.47 | 12d | 1 | 0.52mi |
Listing history 4 events
-
2026-06-18days on market $156,900 Active 3 DOM
-
2026-06-17days on market $156,900 Active 2 DOM
-
2026-06-16remarks 590-char remark
-
2026-06-16$156,900 Active 1 DOM
ⓘ Source: listings_history table (triggers on properties + properties_extension) + one-shot
backfill from property_details.listing_events for pre-trigger history.
Tax reassessment forecast IN · Partial reset (capped growth)
- Current annual tax
- $549 · $46/mo
- Projected year-2 tax
- $941 · $78/mo
- Expected delta
- +$392/yr (+$33/mo · 71.5%)
ⓘ Screening estimate from a state-policy table — verify with the county assessor before closing.
Climate risk First Street
- Flood 1/10 Low FEMA zone X (unshaded) · 0% chance over 30 yrs
- Wildfire 1/10 Low
- Heat 4/10 Moderate 7 d/yr ≥102°F today · 19 d/yr by 30 yrs out
- Wind 2/10 Low 100% chance of damaging wind over 30 yrs
- Air quality 2/10 Low 1 unhealthy d/yr today · 2 by 30 yrs out
Nearby sold comps map
Loading sold comps map…
Walkable amenities ~0.75 mi
Loading nearby amenities…
Taxation est. · year 1
- Rental income
- $47,940
- − Mortgage interest
- −$8,789
- − Property taxes
- −$549
- − Insurance
- −$784
- − Repairs & maintenance
- −$3,835
- − Management
- −$3,835
- − Depreciation
- −$4,564
- Taxable income
- $25,583
- Est. tax owed @ 24.0%
- −$6,140
- After-tax cash flow
- $20,526/yr
For passive investors: Depreciation is non-cash, so a rental often shows a tax loss while cash-flowing — sheltering income. Rental losses are passive: they offset passive income freely, and up to $25,000/yr can offset ordinary (W-2) income if you actively participate and your MAGI is under $100k (phasing out to $0 by $150k); unused losses carry forward. On sale, claimed depreciation is recaptured at up to 25%, and gains may owe capital-gains tax (a 1031 exchange can defer both). Figures are a year-1 estimate at your 24.0% rate — not tax advice; consult a CPA.
Schools (NCES district)
- District
- Greensburg Community Schools
- NCES district ID
- 1804080
- Math proficiency
- 38% ▼ -7.00%
- Reading proficiency
- 51% ▼ -2.00%
- Median HH income
- $47,723
- Composite
- 37.96/100
- National rank
- #4301
- State rank
- #102 of 301 in IN
Livability — Greensburg
- Score
- 69/100
- State rank
- #200
- US rank
- #8922
Category grades
Schools grade is shown separately in the Schools card above.
Census & demographics
- Census place
- Greensburg, IN
- Population (ZIP)
- 21,514
Population outlook (Decatur County) Hauer SSP2
- Today (2025)
- 27,709 people
- By 2030
- 28,278 · +2.1%
- By 2040
- 29,195 · +5.4%
- By 2050
- 29,512 · +6.5%
- By 2075
- 29,835 · +7.7%
- By 2100
- 27,192 · -1.9%
Race, ethnicity, and origin ACS 2023
- Neighborhood character
- Predominantly White (93%)
- Race & ethnicity
- White 93% Two or more races 5% Hispanic / Latino 3%
- Common ancestry
- Slovak 2% Serbian 1% Romanian 1%
- Foreign-born
- 1% · Canada
- Languages at home
- 98% English-only · Spanish 2%
Political lean MEDSL · Decatur
- 2024 margin
- Solid R (+58.5) · D 19.9% · R 78.4% · Other 1.8%
- 2008→2024 swing
- -34.1pp toward R · 2008: -24.4pp · 2024: -58.5pp
- All cycles
- 2024: R+58.5 2020: R+58.1 2016: R+57.4 2012: R+40.5 2008: R+24.4
Not yet ingested
- Civics
- —
Market trends
- HPI YoY
- ▼ -70.13%
- Current HPI
- 210.3591
- Rent YoY
- —
- Metro
- —
- State GDP YoY
- ▲ 2.90%
- F500 in state
- 18
Industry mix (Fortune 500 HQ in IN)
| Industry | F500 HQs | Revenue |
|---|---|---|
| Industrial Machinery | 2 | $37B |
|
||
| Healthcare | 1 | $177B |
|
||
| Pharmaceuticals | 1 | $45B |
|
||
| Metals / Steel | 1 | $18B |
|
||
| Agriculture | 1 | $17B |
|
||
| Packaging | 1 | $12B |
|
||
Price history
+16.2% since first listed5 events — show timeline
- 2026-06-15 Listed $156,900 SEIBR
- 2026-06-15 Listed $156,900 MIBOR as Distributed by MLS Grid
- 2023-10-31 Sold (MLS) $135,000 MIBOR as Distributed by MLS Grid
- 2023-09-28 Pending — MIBOR as Distributed by MLS Grid
- 2023-09-26 Listed $135,000 MIBOR as Distributed by MLS Grid
Property tax history
-7.2%/yrLatest (2023): $549 · -66.0% YoY. Source: county tax records.
Cash-flow waterfall
monthlySold comps — $/sqft
last 12 mo · ≤1 miLoading sold comps…