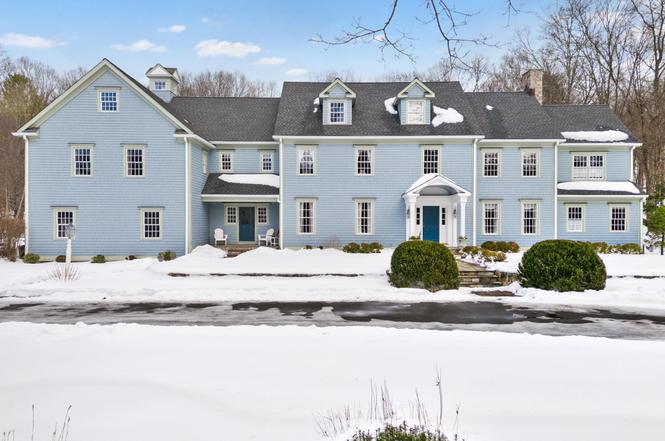
10 Pheasant Hill Rd · Coleytown, CT
Flood risk 1/10 · Minimal
- FEMA flood zone
- X (unshaded)
- Chance of flooding over 30 yrs
- 0.0%
- Est. flood insurance / yr
- $473 – $860
Fire risk 3/10 · Minor
- Est. fire insurance / yr
- $829 – $1,539
Heat risk 5/10 · Moderate
- Hot days now (above 98°F)
- 7 days/yr
- Hot days in 30 yrs
- 16 days/yr
Wind risk 6/10 · Moderate
- Chance of severe wind over 30 yrs
- 27.0%
Air-quality risk 4/10 · Minor
- Unhealthy air days now
- 5 days/yr
- Unhealthy air days in 30 yrs
- 7 days/yr
Risk factors via First Street. Map © Google.
Why this score? — see what drove the C- grade
The composite is a weighted blend of 9 inputs, each scored 0–100. Each bar is that input's sub-score; the figure is the points it added to the 100-point composite (weight × sub-score).
- Cash flow +16.5/30.0
- ARV discount +10.7/15.0
- Schools +7.5/10.0
- DSCR +5.1/10.0
- 1% rule +4.8/10.0
- Rent growth +2.5/5.0
- Livability +2.5/5.0
- Condition / age +2.5/5.0
- Appreciation +0.0/10.0
$1,975,000
🖨 Deal sheet 📄 Offer letter ✓ Due diligence
Listing remarks
On one of Weston's most coveted cul-de-sacs, this custom Colonial offers over 6,200 sq ft across three finished levels plus a full lower level, set on just over two flat private acres. From the moment you step inside, the light is unmistakable, with oversized windows illuminating generous rooms and impressive vertical scale. The professionally appointed kitchen with Thermador double ovens, Viking range, Sub-Zero fridge and butler's pantry opens to a stunningly vaulted family room with stone hearth. It's a home built for gathering. The dining room comfortably seats 18 while remaining welcoming and gracious, the kind of space where stories stretch long past dessert. A sunlit living room with
Key facts
- 2.33 acre lot
- 3 garage spots
- Built 2000
Neighborhood map
What this means for you Summary
Snapshot
- This is a 5-bed/7.0-bath single-family listed at $1.98M.
Deal economics
- At list price, monthly cash flow is $1k ($14k/yr) — positive.
- The deal already cash-flows at list — no discount required.
- To meet the 1% rule (rent ≥ 1% of price), the offer needs to be $1.93M (2.5% below list).
- Recommended offer: $1.93M (2.5% below list) — sets the bar for 1% rule.
Location & tenants
- Location reads: area grade C — affects rentability + tenant quality, not the cash-flow math above.
- Weston School District (suburban): math 68% / reading 77% proficiency, ranked #4 of 153 in CT (top 3%) — strong family-tenant draw, lease renewals of 3-5y typical; only 1% free/reduced lunch — higher-income household profile.
- Zoned schools: Hurlbutt Elementary School (473 students, 1% FRL); Weston High School (math 82% / reading 87%, grade A, #1 of 194 statewide, top 1%, 722 students, 1% FRL) — zoned schools at 1% FRL track the district average.
- Zoned-school proficiency averages 84% at this address vs 72% district-wide (+12 pts) — the actual schools serving this property are materially stronger than the Weston School District average implies; a family-tenant draw the district grade alone would hide.
- Market conditions: 73 active listings in the ZIP; 3 comparable units currently listed for rent nearby; rentals leasing fast (median 3d on market — plan ~1-2 weeks tenant-placement turnaround); 1,151 units permitted in Western Connecticut Planning Region in 2024 (714 in 5+ unit buildings).
Forward outlook
- Local home prices are declining (-3.0%/yr); year-one equity from $14k of loan paydown is wiped out by about $59k of value loss. Plan a longer hold.
Negotiation context
- Only 11 days on market — expect competitive offers; lowballing is unlikely to land.
- 15 sale attempts since 26y ago with the ask held roughly flat each time — persistent listings suggest the price (not the market) is what's stuck; bring a comps-based counter.
- Current owner paid $1.70M; 16% above their basis — modest negotiation headroom, anchor on the comps not their cost.
Risks & watch-outs
- Climate carrying-cost: major wind risk, 27% chance of damaging wind over 30y; extreme-heat days projected 7→16/yr by 2055 (HVAC capex compounding) — expect insurance premiums to compound above CPI over the hold.
Questions for the listing agent
- Is there a deadline driving the sale (1031 exchange, divorce, estate, relocation)? That informs how much negotiation room exists.
- What's the average days-on-market for RENTAL listings here right now (not sales)? A rising rental-DOM trend means longer vacancies and softer asking-rent achievability than the comps imply.
- What's the recent tenant-quality profile in this submarket — average credit score on applications, eviction rate, late-payment / NSF rate, and stable-employment percentage? A property-management company in the area should have these aggregated.
- How much new for-sale + rental construction is in the pipeline within 1–3 miles? Heavy new supply typically softens prices + rents 12–24 months out; constrained supply supports both.
Investment metrics
- 1% rule
- 0.98% ✗
- Cap rate
- 6.99%
- Cash-on-cash
- 2.49%
- DSCR
- 1.11
- GRM
- 8.5
CMA / ARV
- ARV (on-the-fly)
- $2,125,340
- Comps found
- 7
Show comp detail 7 sales within ~0.75 mi
| Address | Dist | Beds/Ba | Sqft | Sold | Price | $/sf | Match |
|---|---|---|---|---|---|---|---|
| 10 Pheasant Hill Rd | 0.00mi | 6/7.0 (+1) | 6,251 (0%) | 0mo | $2,475,000 | $396 | 95 |
| 34 Pheasant Hill Rd | 0.20mi | 4/4.5 (-1) | 6,213 (-1%) | 18mo | $1,649,000 | $265 | 59 |
| 1 Kellogg Hill Rd | 0.21mi | 5/4.0 | 5,966 (-5%) | 16mo | $1,225,000 | $205 | 57 |
| 10 & 12 Kellogg Hill Rd | 0.31mi | 6/5.5 (+1) | 5,910 (-6%) | 20mo | $2,025,000 | $343 | 49 |
| 11 Tannery Ln S | 0.47mi | 5/5.5 | 5,391 (-14%) | 12mo | $1,835,000 | $340 | 39 |
| 4 Hemlock Rdg | 0.72mi | 5/6.5 | 5,512 (-12%) | 9mo | $2,100,000 | $381 | 37 |
| 17 Tannery Ln N | 0.62mi | 5/4.5 | 5,685 (-9%) | 12mo | $1,600,000 | $281 | 36 |
Match score weights: distance 35% · size 25% · config 20% · recency 20%. Top-matched comps best support the ARV.
Projected returns pro-forma
-3.0% appreciation · 3.0% rent growth · sell at horizon
- IRR
- -12.3%
- Equity multiple
- 0.55×
- Total profit
- $-246,518
- Equity at exit
- $294,479
- IRR
- -3.2%
- Equity multiple
- 0.79×
- Total profit
- $-118,469
- Equity at exit
- $170,762
Cash invested: $553,000 (down + closing). Projections, not guarantees.
Landlord ↔ Tenant lean methodology
- Overall (STATE)
- 27 Tenant-Leaning
- State Connecticut
- 27 Tenant-Leaning · D+7
- County
- — inherits STATE
- City
- — inherits STATE
ZIP-level market 06883
- Active inventory
- 73
- Price-to-rent
- 8.5×
Monthly cashflow live
- Estimated rent
- $19,264 medium interval (Pro) →
- Mortgage (P&I)
- −$10,357
- Tax from tax record
- −$2,893 /mo · $34,719/yr
- Insurance
- −$823
- HOA
- −$0
- Vacancy / Maint / Mgmt
- −$4,046
- Net cashflow
- $1,146
Break-even live
UW: 25.0% down · 7.5% · 30yr · 1.5% tax · 5.0% vac · 8.0% maint · 8.0% mgmt
Financing live
Cash to close
- Down payment
- $493,750
- Closing costs
- $59,250
- Reserves months
- —
- Total cash needed
- —
Loan-product check · same deal, 3 products live
Conventional
25% down · 7.5% · 30yr
- Down + closing
- —
- Monthly P&I
- —
- Monthly cashflow
- —
- DSCR
- —
- Eligible?
- —
Personal DTI + credit; lowest rate.
DSCR
20% down · 8.5% · 30yr
- Down + closing
- —
- Monthly P&I
- —
- Monthly cashflow
- —
- DSCR
- —
- Eligible?
- —
No personal income docs; deal must DSCR.
Hard money
10% down · 12.0% · 12mo
- Down + closing
- —
- Monthly P&I
- —
- Monthly cashflow
- —
- DSCR
- —
- Eligible?
- —
Short-term bridge; refi at stabilization.
Rent comps 3 comps
| Address | Beds | Baths | Sqft | Rent | $/sqft | DOM | Units | Dist |
|---|---|---|---|---|---|---|---|---|
| 55 Blueberry Hill Rd Weston, CT | 4.0 | 3.5 | 4500 | $9,500 | $2.11 | 3d | 1 | 0.62mi |
| 37 Beaverbrook Rd Weston, CT | 5.0 | 4.5 | 6734 | $35,000 | $5.20 | 44d | 1 | 1.16mi |
| 29 Rogues Rdg Weston, CT | 6.0 | 6.5 | 7649 | $17,000 | $2.22 | 3d | 1 | 1.50mi |
Listing history 37 events
-
2026-03-12status Under Contract
-
2026-03-06historical Under Contract - Continue to Show
-
2026-03-02$1,975,000 Active
-
2026-02-23historical $1,975,000
-
2023-07-01historical
-
2023-03-16$2,650,000 Active
-
2022-12-31historical
-
2022-09-09$2,500,000 Active
-
2022-09-06historical
-
2021-02-23soldstatus $1,700,000
-
2021-02-17soldstatus $1,700,000 Closed
-
2020-12-21historical Under Contract - Continue to Show
-
2020-12-18$1,600,000 Active
-
2020-12-11historical $1,600,000
-
2010-03-31soldstatus $1,650,000
-
2007-07-13historical
-
2007-01-18$2,595,000
-
2006-09-12historical
-
2006-01-12$2,550,000
-
2005-10-16historical
-
2005-03-11$2,495,000
-
2004-12-06historical
-
2004-03-06$2,550,000
-
2003-11-10historical
-
2003-05-10$2,495,000
-
2003-05-09historical
-
2003-02-06$2,875,000
-
2002-12-31historical
-
2002-06-12$2,695,000
-
2002-06-11historical
-
2002-03-22$2,695,000
-
2002-03-21historical
-
2002-01-03$2,695,000
-
2002-01-02historical
-
2001-01-02$2,695,000
-
2001-01-02historical
-
2000-03-31$2,495,000
ⓘ Source: listings_history table (triggers on properties + properties_extension) + one-shot
backfill from property_details.listing_events for pre-trigger history.
Tax reassessment forecast CT · Partial reset (capped growth)
- Current annual tax
- $34,719 · $2,893/mo
- Projected year-2 tax
- $38,492 · $3,208/mo
- Expected delta
- +$3,773/yr (+$314/mo · 10.9%)
ⓘ Screening estimate from a state-policy table — verify with the county assessor before closing.
Climate risk First Street
- Flood 1/10 Low FEMA zone X (unshaded) · 0% chance over 30 yrs
- Wildfire 3/10 Moderate
- Heat 5/10 Major 7 d/yr ≥98°F today · 16 d/yr by 30 yrs out
- Wind 6/10 Major 27% chance of damaging wind over 30 yrs
- Air quality 4/10 Moderate 5 unhealthy d/yr today · 7 by 30 yrs out
Nearby sold comps map
Loading sold comps map…
Walkable amenities ~0.75 mi
Loading nearby amenities…
Taxation est. · year 1
- Rental income
- $231,173
- − Mortgage interest
- −$110,631
- − Property taxes
- −$34,719
- − Insurance
- −$9,875
- − Repairs & maintenance
- −$18,494
- − Management
- −$18,494
- − Depreciation
- −$57,455
- Taxable loss
- −$18,494
- Est. tax savings @ 24.0%
- +$4,439
- After-tax cash flow
- $18,186/yr
For passive investors: Depreciation is non-cash, so a rental often shows a tax loss while cash-flowing — sheltering income. Rental losses are passive: they offset passive income freely, and up to $25,000/yr can offset ordinary (W-2) income if you actively participate and your MAGI is under $100k (phasing out to $0 by $150k); unused losses carry forward. On sale, claimed depreciation is recaptured at up to 25%, and gains may owe capital-gains tax (a 1031 exchange can defer both). Figures are a year-1 estimate at your 24.0% rate — not tax advice; consult a CPA.
Schools (NCES district)
- District
- Weston School District
- NCES district ID
- 0905010
- Math proficiency
- 68% ▼ -6.00%
- Reading proficiency
- 77% ▼ -1.00%
- Median HH income
- $194,414
- Composite
- 75.21/100
- National rank
- #137
- State rank
- #4 of 153 in CT
Livability — Coleytown
No livability data for this city. (Only ~50 U.S. cities are tracked.)
Census & demographics
- Population (ZIP)
- 10,335
Population outlook (Western Connecticut County) Hauer SSP2
- By 2040
- 685,031
Race, ethnicity, and origin ACS 2023
- Neighborhood character
- Predominantly White (78%)
- Race & ethnicity
- White 78% Two or more races 10% Hispanic / Latino 9% Asian 5% Black 3%
- Hispanic origin (detail)
- Mexican 1% Puerto Rican 2% Dominican 1% Salvadoran 2%
- Common ancestry
- Romanian 7% Scotch-Irish 5% Italian 5%
- Foreign-born
- 16% · Canada, China, Dominican Republic
- Languages at home
- 83% English-only · Spanish 5% Chinese 3% Other Indo-European 3%
Political lean MEDSL · Western Connecticut
- 2024 margin
- D (+19.1) · D 58.8% · R 39.7% · Other 1.6%
- All cycles
- 2024: D+19.1
Not yet ingested
- Civics
- —
Market trends
- HPI YoY
- ▼ -316.44%
- Current HPI
- 208.835
- Rent YoY
- —
- Metro
- —
- State GDP YoY
- ▲ 1.06%
- F500 in state
- 38
Industry mix (Fortune 500 HQ in CT)
| Industry | F500 HQs | Revenue |
|---|---|---|
| Industrial Machinery | 4 | $38B |
|
||
| Insurance | 3 | $71B |
|
||
| Financial Services | 2 | $25B |
|
||
| Transportation / Logistics | 2 | $18B |
|
||
| Healthcare | 1 | $247B |
|
||
| Telecommunications | 1 | $55B |
|
||
Price history
-20.8% since first listed37 events — show timeline
- 2026-03-12 Pending — Smart MLS
- 2026-03-06 Contingent — Smart MLS
- 2026-03-02 Listed $1,975,000 Smart MLS
- 2026-02-23 Coming Soon $1,975,000 Smart MLS
- 2023-07-01 Listing Removed — Smart MLS
- 2023-03-16 Listed $2,650,000 Smart MLS
- 2022-12-31 Listing Removed — Smart MLS
- 2022-09-09 Listed $2,500,000 Smart MLS
- 2022-09-06 Coming Soon — Smart MLS
- 2021-02-23 Sold (Public Records) $1,700,000 Public Records
- 2021-02-17 Sold (MLS) $1,700,000 Smart MLS
- 2020-12-21 Contingent — Smart MLS
- 2020-12-18 Listed $1,600,000 Smart MLS
- 2020-12-11 Coming Soon $1,600,000 Smart MLS
- 2010-03-31 Sold (Public Records) $1,650,000 Public Records
- 2007-07-13 Listing Removed — Smart MLS
- 2007-01-18 Listed $2,595,000 Smart MLS
- 2006-09-12 Listing Removed — Smart MLS
- 2006-01-12 Listed $2,550,000 Smart MLS
- 2005-10-16 Listing Removed — Smart MLS
- 2005-03-11 Listed $2,495,000 Smart MLS
- 2004-12-06 Listing Removed — Smart MLS
- 2004-03-06 Listed $2,550,000 Smart MLS
- 2003-11-10 Listing Removed — Smart MLS
- 2003-05-10 Listed $2,495,000 Smart MLS
- 2003-05-09 Listing Removed — Smart MLS
- 2003-02-06 Listed $2,875,000 Smart MLS
- 2002-12-31 Listing Removed — Smart MLS
- 2002-06-12 Listed $2,695,000 Smart MLS
- 2002-06-11 Listing Removed — Smart MLS
- 2002-03-22 Listed $2,695,000 Smart MLS
- 2002-03-21 Listing Removed — Smart MLS
- 2002-01-03 Listed $2,695,000 Smart MLS
- 2002-01-02 Listing Removed — Smart MLS
- 2001-01-02 Listing Removed — Smart MLS
- 2001-01-02 Listed $2,695,000 Smart MLS
- 2000-03-31 Listed $2,495,000 Smart MLS
Property tax history
+0.7%/yrLatest (2023): $34,719 · +0.3% YoY. Source: county tax records.
Cash-flow waterfall
monthlySold comps — $/sqft
last 12 mo · ≤1 miLoading sold comps…