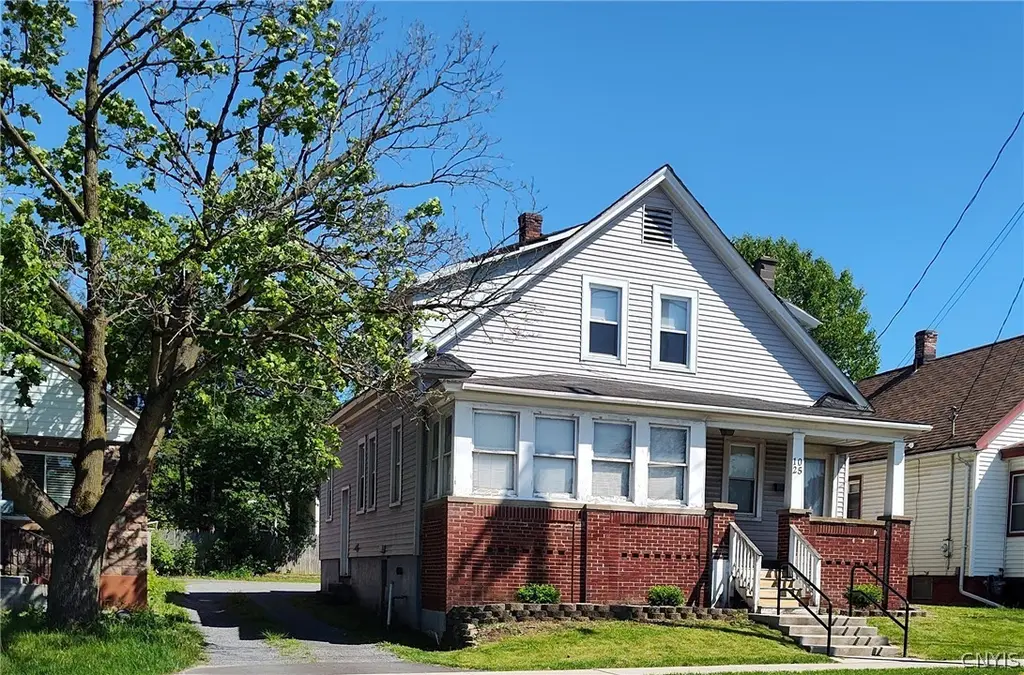
1025 Champlin Ave · Yorkville, NY
Flood risk 1/10 · Minimal
- FEMA flood zone
- X (unshaded)
- Chance of flooding over 30 yrs
- 0.0%
- Est. flood insurance / yr
- $473 – $860
Fire risk 3/10 · Minor
- Est. fire insurance / yr
- $691 – $1,283
Heat risk 3/10 · Minor
- Hot days now (above 96°F)
- 7 days/yr
- Hot days in 30 yrs
- 16 days/yr
Wind risk 1/10 · Minimal
- Chance of severe wind over 30 yrs
- 1.0%
Air-quality risk 2/10 · Minimal
- Unhealthy air days now
- 0 days/yr
- Unhealthy air days in 30 yrs
- 2 days/yr
Risk factors via First Street. Map © Google.
Why this score? — see what drove the C+ grade
The composite is a weighted blend of 9 inputs, each scored 0–100. Each bar is that input's sub-score; the figure is the points it added to the 100-point composite (weight × sub-score).
- Cash flow +24.5/30.0
- DSCR +7.9/10.0
- ARV discount +7.5/15.0
- 1% rule +6.9/10.0
- Schools +5.6/10.0
- Livability +3.6/5.0
- Rent growth +2.5/5.0
- Condition / age +2.5/5.0
- Appreciation +0.0/10.0
$159,000
🖨 Deal sheet (PDF) 📄 Offer letter ✓ Due diligence
Listing remarks
Looking for an income to supplement your living expenses? That's what this owner started out doing then rented both units as an investment income. This two unit is in a great location. Two 2 Bedroom units with some bonus spaces as well. You'll love the updated kitchens and baths. And it has separate utilities so each tenant takes care of their own. The convenient location offers central access to the main thoroughfares of the community. The new Convenience store a block away and the restaurants, colleges and hospitals are all within minutes. Convenient money saving available laundry hookups in the accessible basement will save your tenants money as well. You'll love the brick faced front an
Key facts
- Separate utilities
- Updated baths
- Two unit
Tags
Property features AI
Finance
- Other: Resale property
- Financial info: Property configured as a 2-unit multi-family; Separate gas and electric meters for each unit; Operating expenses include insurance and water/sewer; Unit rents listed: one unit at $800, one unit at $1,000; Owner pays hot water and water for tenants (rental info)
Exterior
- Parking: Two or more parking spaces
- Utilities: Public water connected; Sewer connected; Cable available; High-speed internet available; Circuit breaker electric
- Home design: Two-story building; Existing construction
- Construction: Brick and vinyl siding exterior; Asphalt roof
- Exterior features: Near public transit; Rectangular residential lot; City street frontage
Interior
- Kitchen: Oven/Range; Refrigerator; Microwave (in one unit); Eat-in kitchen or dining area with kitchen
- Bedrooms: Two-bedroom units (unit-level details indicate 2 beds per unit)
- Flooring: Carpet; Laminate; Vinyl; Varies
- Bathrooms: Two full bathrooms (property total); Each unit has one full bathroom
- Heating & cooling: Gas forced-air heating
- Interior features: Ceiling fans; Natural woodwork
- Laundry & utility: Gas water heater
Neighborhood map
What this means for you Summary
Snapshot
- This is a 4-bed/2.0-bath townhouse listed at $159k.
Deal economics
- At list price, monthly cash flow is $325 ($4k/yr) — positive.
- The deal already cash-flows at list — no discount required.
- Meets the 1% rule at list price ($2k rent vs $159k).
- Recommended offer: $157k (1.5% below list) — sets the bar for market timing.
Location & tenants
- Location reads 72/100 on livability (#359 in NY) — a middle-class / working-renter tenant base. Strengths: cost of living A+, housing A+, health & safety A+; Watch: employment D, amenities F, commute F.
- Whitesboro Central School District (suburban): math 68% / reading 61% proficiency, ranked #174 of 590 in NY (top 30%) — acceptable for families but not a draw, mixed tenant base, ~2y average lease.
- Zoned schools: Westmoreland Road Elementary School (math 52% / reading 52%, grade C-, #988 of 2,108 statewide, top 49%, 365 students, 52% FRL); Whitesboro Middle School (math 58% / reading 62%, grade B, #157 of 729 statewide, top 22%, 474 students, 40% FRL); Whitesboro High School (math 94%, 938 students, 34% FRL) — zoned schools average 42% FRL vs 22% district-wide (20 pts higher); higher-poverty schools than district average — tighter screening recommended.
- Market conditions: 150 active listings in the ZIP; 204 units permitted in Oneida County in 2024 (68 in 5+ unit buildings).
- This rent runs 39% of the median local income ($58k/yr) — at the standard rent-burdened threshold; future hikes will face affordability resistance.
Forward outlook
- Local home prices are declining (-3.0%/yr); year-one equity from $1k of loan paydown is wiped out by about $5k of value loss. Plan a longer hold.
- Oneida County population projected at -12% by 2050 — secular population decline; favor cash flow + early exit over multi-decade hold.
Negotiation context
- It's been on market 24 days — a 2% lower offer ($157k) is reasonable based on typical stale-listing flexibility.
- 5 sale attempts since 15y ago with the ask held roughly flat each time — persistent listings suggest the price (not the market) is what's stuck; bring a comps-based counter.
- Current owner paid $85k; list at $159k implies a 88% gain — meaningful room to come down on a strong offer.
Risks & watch-outs
- Watch-outs: built in 1912 — expect roof / HVAC / electrical / plumbing capex.
Questions for the listing agent
- Built in 1912 — when were the roof, HVAC, electrical panel, plumbing, and water heater last replaced?
- Is there a deadline driving the sale (1031 exchange, divorce, estate, relocation)? That informs how much negotiation room exists.
- Schools are D-rated, which usually means shorter tenancies and higher turnover. Who's the typical renter profile here, and what's been the actual vacancy rate?
- What's the average days-on-market for RENTAL listings here right now (not sales)? A rising rental-DOM trend means longer vacancies and softer asking-rent achievability than the comps imply.
- What's the recent tenant-quality profile in this submarket — average credit score on applications, eviction rate, late-payment / NSF rate, and stable-employment percentage? A property-management company in the area should have these aggregated.
- How much new for-sale + rental construction is in the pipeline within 1–3 miles? Heavy new supply typically softens prices + rents 12–24 months out; constrained supply supports both.
Investment metrics
- 1% rule
- 1.19% ✓
- Cap rate
- 8.75%
- Cash-on-cash
- 8.77%
- DSCR
- 1.39
- GRM
- 7.0
CMA / ARV
No comps found within radius.
Projected returns pro-forma
-3.0% appreciation · 3.0% rent growth · sell at horizon
- IRR
- -3.0%
- Equity multiple
- 0.89×
- Total profit
- $-4,971
- Equity at exit
- $23,707
- IRR
- 6.8%
- Equity multiple
- 1.51×
- Total profit
- $22,657
- Equity at exit
- $13,747
Cash invested: $44,520 (down + closing). Projections, not guarantees.
Landlord ↔ Tenant lean methodology
- Overall (STATE)
- 15 Strongly Tenant-Friendly
- State New York
- 15 Strongly Tenant-Friendly · D+10
- County
- — inherits STATE
- City
- — inherits STATE
ZIP-level market 13502
- Home prices YoY
- -12.1%
- Active inventory
- 150
- Price-to-rent
- 7.0×
Monthly cashflow live
- Estimated rent
- $1,900 medium interval (Pro) →
- Mortgage (P&I)
- −$834
- Tax from tax record
- −$275 /mo · $3,304/yr
- Insurance
- −$66
- HOA
- −$0
- Vacancy / Maint / Mgmt
- −$399
- Net cashflow
- $325
Break-even live
Sensitivity live
| Price | -10% $415 | -5% $370 | +0% $325 | +5% $280 | +10% $235 |
|---|---|---|---|---|---|
| Rent | -10% $175 | -5% $250 | +0% $325 | +5% $400 | +10% $475 |
| Rate | -1.0pp $405 | -0.5pp $366 | base $325 | +0.5pp $284 | +1.0pp $242 |
UW: 25.0% down · 7.5% · 30yr · 1.5% tax · 5.0% vac · 8.0% maint · 8.0% mgmt
Financing live
Cash to close
- Down payment
- $39,750
- Closing costs
- $4,770
- Reserves months
- —
- Total cash needed
- —
Loan-product check · same deal, 3 products live
Conventional
25% down · 7.5% · 30yr
- Down + closing
- —
- Monthly P&I
- —
- Monthly cashflow
- —
- DSCR
- —
- Eligible?
- —
Personal DTI + credit; lowest rate.
DSCR
20% down · 8.5% · 30yr
- Down + closing
- —
- Monthly P&I
- —
- Monthly cashflow
- —
- DSCR
- —
- Eligible?
- —
No personal income docs; deal must DSCR.
Hard money
10% down · 12.0% · 12mo
- Down + closing
- —
- Monthly P&I
- —
- Monthly cashflow
- —
- DSCR
- —
- Eligible?
- —
Short-term bridge; refi at stabilization.
Listing history 29 events
-
2026-06-22days on market $159,000 Active 24 DOM
-
2026-06-19days on market $159,000 Active 22 DOM
-
2026-06-18days on market $159,000 Active 21 DOM
-
2026-06-17days on market $159,000 Active 20 DOM
-
2026-06-16days on market $159,000 Active 19 DOM
-
2026-06-15days on market $159,000 Active 18 DOM
-
2026-06-14days on market $159,000 Active 16 DOM
-
2026-06-13days on market $159,000 Active 15 DOM
-
2026-06-10days on market $159,000 Active 13 DOM
-
2026-06-09days on market $159,000 Active 12 DOM
-
2026-06-08days on market $159,000 Active 11 DOM
-
2026-06-07days on market $159,000 Active 10 DOM
-
2026-06-05days on market $159,000 Active 7 DOM
-
2026-06-03days on market $159,000 Active 6 DOM
-
2026-06-02days on market $159,000 Active 5 DOM
-
2026-06-01days on market $159,000 Active 4 DOM
-
2026-05-31days on market $159,000 Active 3 DOM
-
2026-05-30days on market $159,000 Active 2 DOM
-
2026-05-28$159,000 Active
-
2021-10-27historical
-
2021-05-18historical
-
2021-05-18$90,500 Active
-
2020-12-22$99,000
-
2020-12-18historical
-
2020-06-18$99,000
-
2012-06-12soldstatus $84,694
-
2012-06-08soldstatus $84,694
-
2011-10-31$89,900
-
2004-08-02soldstatus $55,500
ⓘ Source: listings_history table (triggers on properties + properties_extension) + one-shot
backfill from property_details.listing_events for pre-trigger history.
Tax reassessment forecast NY · Partial reset (capped growth)
- Current annual tax
- $3,304 · $275/mo
- Projected year-2 tax
- $3,304 · $275/mo
- Expected delta
- $0/yr ($0/mo · 0.0%)
ⓘ Screening estimate from a state-policy table — verify with the county assessor before closing.
Climate risk First Street
- Flood 1/10 Low FEMA zone X (unshaded) · 0% chance over 30 yrs
- Wildfire 3/10 Moderate
- Heat 3/10 Moderate 7 d/yr ≥96°F today · 16 d/yr by 30 yrs out
- Wind 1/10 Low 100% chance of damaging wind over 30 yrs
- Air quality 2/10 Low 0 unhealthy d/yr today · 2 by 30 yrs out
Nearby sold comps map
Loading sold comps map…
Walkable amenities ~0.75 mi
Loading nearby amenities…
Taxation est. · year 1
- Rental income
- $22,796
- − Mortgage interest
- −$8,906
- − Property taxes
- −$3,304
- − Insurance
- −$795
- − Repairs & maintenance
- −$1,824
- − Management
- −$1,824
- − Depreciation
- −$4,625
- Taxable income
- $1,517
- Est. tax owed @ 24.0%
- −$364
- After-tax cash flow
- $3,539/yr
For passive investors: Depreciation is non-cash, so a rental often shows a tax loss while cash-flowing — sheltering income. Rental losses are passive: they offset passive income freely, and up to $25,000/yr can offset ordinary (W-2) income if you actively participate and your MAGI is under $100k (phasing out to $0 by $150k); unused losses carry forward. On sale, claimed depreciation is recaptured at up to 25%, and gains may owe capital-gains tax (a 1031 exchange can defer both). Figures are a year-1 estimate at your 24.0% rate — not tax advice; consult a CPA.
Schools (NCES district)
- District
- Whitesboro Central School District
- NCES district ID
- 3631320
- Math proficiency
- 68% ▼ -7.00%
- Reading proficiency
- 61% ▼ -2.00%
- Median HH income
- $59,732
- Composite
- 55.77/100
- National rank
- #1217
- State rank
- #174 of 590 in NY
Livability — Yorkville
- Score
- 72/100
- State rank
- #359
- US rank
- #6063
Category grades
Schools grade is shown separately in the Schools card above.
Census & demographics
- Census place
- Yorkville, NY
- County
- Oneida County · 89,710 people
- City population
- 1,889
- Metro
- Utica-Rome, NY
- Population (ZIP)
- 34,037
- Household income
- $57,835
- Rent vs Own
- Severe rent burden
- 1604.0
Population outlook (Oneida County) Hauer SSP2
- Today (2025)
- 225,223 people
- By 2030
- 220,384 · -2.1%
- By 2040
- 209,071 · -7.2%
- By 2050
- 197,920 · -12.1%
- By 2075
- 175,541 · -22.1%
- By 2100
- 148,491 · -34.1%
Race, ethnicity, and origin ACS 2023
- Neighborhood character
- Predominantly White (71%)
- Race & ethnicity
- White 71% Hispanic / Latino 11% Black 9% Two or more races 7% Asian 5%
- Hispanic origin (detail)
- Mexican 2% Puerto Rican 5% Dominican 2%
- Common ancestry
- Romanian 11% Lithuanian 3% American 2%
- Foreign-born
- 12% · Canada, Philippines, China
- Languages at home
- 81% English-only · Spanish 7% Russian/Polish/Slavic 4% Other Asian/Pacific 3%
Political lean MEDSL · Oneida
- 2024 margin
- Strong R (+21.3) · D 39.4% · R 60.6%
- 2008→2024 swing
- -15.2pp toward R · 2008: -6.1pp · 2024: -21.3pp
- All cycles
- 2024: R+21.3 2020: R+15.5 2016: R+21.1 2012: R+5.3 2008: R+6.1
Not yet ingested
- Civics
- —
Market trends
- HPI YoY
- ▼ -50.76%
- Current HPI
- 368.3955
- Rent YoY
- —
- Metro
- Utica-Rome, NY
- State GDP YoY
- ▲ 2.60%
- F500 in state
- 92
Industry mix (Fortune 500 HQ in NY)
| Industry | F500 HQs | Revenue |
|---|---|---|
| Financial Services | 10 | $950B |
|
||
| Consumer Goods | 9 | $162B |
|
||
| Insurance | 4 | $225B |
|
||
| Telecommunications | 2 | $144B |
|
||
| Pharmaceuticals | 2 | $112B |
|
||
| Media / Entertainment | 2 | $69B |
|
||
Price history
+186.5% since first listed11 events — show timeline
- 2026-05-28 Listed $159,000 CNYIS
- 2021-10-27 Listing Removed — CNYIS
- 2021-05-18 Listed $90,500 CNYIS
- 2021-05-18 Listing Removed — CNYIS
- 2020-12-22 Listed $99,000 CNYIS
- 2020-12-18 Listing Removed — CNYIS
- 2020-06-18 Listed $99,000 CNYIS
- 2012-06-12 Sold (Public Records) $84,694 Public Records
- 2012-06-08 Sold (MLS) $84,694 CNYIS
- 2011-10-31 Listed $89,900 CNYIS
- 2004-08-02 Sold (Public Records) $55,500 Public Records
Property tax history
+1.6%/yrLatest (2025): $3,304 · -15.7% YoY. Source: county tax records.
Cash-flow waterfall
monthlySold comps — $/sqft
last 12 mo · ≤1 miLoading sold comps…