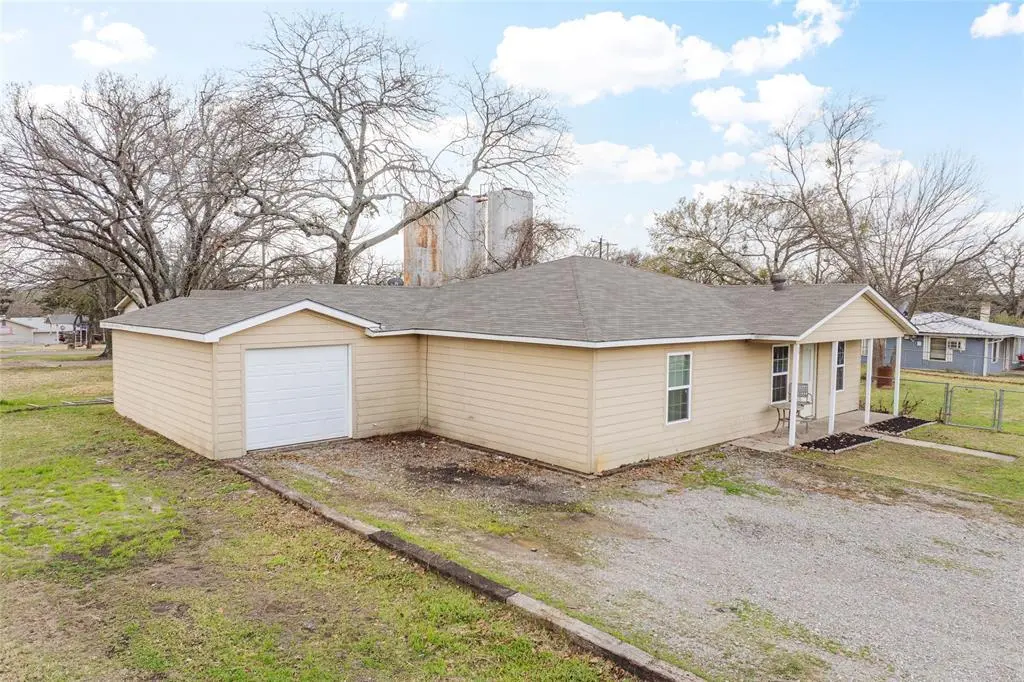
25 Erin Dr · Preston, TX
Flood risk 1/10 · Minimal
- FEMA flood zone
- X (unshaded)
- Chance of flooding over 30 yrs
- 0.0%
- Est. flood insurance / yr
- $507 – $1,088
Fire risk 6/10 · Moderate
- Est. fire insurance / yr
- $1,222 – $2,270
Heat risk 6/10 · Moderate
- Hot days now (above 109°F)
- 7 days/yr
- Hot days in 30 yrs
- 21 days/yr
Wind risk 4/10 · Minor
- Chance of severe wind over 30 yrs
- 18.0%
Air-quality risk 3/10 · Minor
- Unhealthy air days now
- 3 days/yr
- Unhealthy air days in 30 yrs
- 3 days/yr
Risk factors via First Street. Map © Google.
Why this score? — see what drove the C+ grade
The composite is a weighted blend of 9 inputs, each scored 0–100. Each bar is that input's sub-score; the figure is the points it added to the 100-point composite (weight × sub-score).
- Cash flow +22.1/30.0
- ARV discount +15.0/15.0
- DSCR +7.1/10.0
- 1% rule +5.3/10.0
- Schools +3.7/10.0
- Livability +2.8/5.0
- Rent growth +2.5/5.0
- Condition / age +2.5/5.0
- Appreciation +0.0/10.0
$250,000
🖨 Deal sheet (PDF) 📄 Offer letter ✓ Due diligence
Listing remarks MLS
Welcome to Cambridge Shores, one of Lake Texoma’s most desirable lake communities—complete with a neighborhood boat ramp and a courtesy dock just a quick golf cart ride away. Situated on a quiet street with minimal traffic, this property offers the perfect setup for a full-time residence or weekend retreat. The home features an open floor plan with great flow between living, dining, and kitchen areas—ready for your personal updates and finishing touches. Recent improvements include all-new siding, windows, new kitchen cabinets and lighting giving you a solid head start on renovations. Attached, you’ll find a garage ideal for storing your vehicle, a golf cart or all your lake toys, plus a fenced area perfect for pets or even a garden space. Short-term rentals are allowed in the neighborhood, making this an excellent opportunity for personal enjoyment and potential investment income. If you’ve been looking for an affordable way to get into Cambridge Shores and customize a lake property to your style, this is your opportunity.
Key facts
- Open floor plan
- Fenced area
- New kitchen cabinets
Tags
Neighborhood map
What this means for you Summary
Snapshot
- This is a 2-bed/1.0-bath single-family listed at $250k.
Deal economics
- At list price, monthly cash flow is $404 ($5k/yr) — positive.
- The deal already cash-flows at list — no discount required.
- Meets the 1% rule at list price ($3k rent vs $250k).
- Recommended offer: $228k (9.0% below list) — sets the bar for market timing.
- Cap rate 8.2% vs local median 2.9% in Preston — top-decile yield for the area; either an underpriced asset or a hidden risk that comps aren't pricing in. Stress-test before assuming the spread holds.
Location & tenants
- Location reads 56/100 on livability (#1,306 in TX) — a working-class tenant base; expect higher turnover. Strengths: crime A+, cost of living A+, housing A+; Watch: employment D, schools F, amenities F.
- Pottsboro ISD (suburban): math 39% / reading 48% proficiency, ranked #288 of 826 in TX (top 35%) — families likely to look elsewhere, expect single-tenant / working-renter base with shorter leases.
- Market conditions: 294 active listings in the ZIP; 5 comparable units currently listed for rent nearby; rentals at typical pace (median 23d on market — plan ~3-4 weeks tenant-placement turnaround); solid renter incomes; 2,272 units permitted in Grayson County in 2024 (750 in 5+ unit buildings).
- This rent runs 40% of the median local income ($77k/yr) — at the standard rent-burdened threshold; future hikes will face affordability resistance.
Forward outlook
- Local home prices are declining (-3.0%/yr); year-one equity from $2k of loan paydown is wiped out by about $8k of value loss. Plan a longer hold.
- Grayson County population projected at +12% by 2050 — modest demand growth; plan on rents tracking national, not racing it.
Negotiation context
- It's been on market 107 days — a 9% lower offer ($228k) is reasonable based on typical stale-listing flexibility.
- 2 sale attempts since 20y ago; this cycle's ask has dropped $18k (7%) from the opening price — seller is motivated, your offer sets the floor, not the list.
Risks & watch-outs
- Climate carrying-cost: major wildfire risk; extreme-heat days projected 7→21/yr by 2055 (HVAC capex compounding) — expect insurance premiums to compound above CPI over the hold.
Questions for the listing agent
- It's been on market 107 days. Have you received any prior offers? Is the seller open to a 9% concession, seller financing, or rate buy-down credit?
- Built in 1972 — when were the roof, HVAC, electrical panel, plumbing, and water heater last replaced?
- What does the HOA fee cover, when was the last increase, and are there any pending special assessments or reserve-fund shortfalls?
- Why hasn't it sold? Are there any deal-killer items the seller is aware of (foundation, flood, title, zoning, code violations)?
- Is there a deadline driving the sale (1031 exchange, divorce, estate, relocation)? That informs how much negotiation room exists.
- Schools are F-rated, which usually means shorter tenancies and higher turnover. Who's the typical renter profile here, and what's been the actual vacancy rate?
- What's the average days-on-market for RENTAL listings here right now (not sales)? A rising rental-DOM trend means longer vacancies and softer asking-rent achievability than the comps imply.
- What's the recent tenant-quality profile in this submarket — average credit score on applications, eviction rate, late-payment / NSF rate, and stable-employment percentage? A property-management company in the area should have these aggregated.
- How much new for-sale + rental construction is in the pipeline within 1–3 miles? Heavy new supply typically softens prices + rents 12–24 months out; constrained supply supports both.
Investment metrics
- 1% rule
- 1.03% ✓
- Cap rate
- 8.23%
- Cash-on-cash
- 6.93%
- DSCR
- 1.31
- GRM
- 8.1
CMA / ARV
- ARV (median comp)
- $369,350
- List price
- $250,000
- Delta
- -32.31%
- Verdict
- UNDERPRICED
- Comps
- 20 within 1.0 mi
Show comp detail 4 sales within ~0.75 mi
| Address | Dist | Beds/Ba | Sqft | Sold | Price | $/sf | Match |
|---|---|---|---|---|---|---|---|
| 33 Queens Dr | 0.37mi | 3/2.0 (+1) | 1,551 (+8%) | 4mo | $365,000 | $235 | 57 |
| 103 Windsor Dr | 0.24mi | 3/2.5 (+1) | 1,486 (+3%) | 23mo | $359,000 | $242 | 53 |
| 540 Russwood Dr | 0.56mi | 3/2.0 (+1) | 1,370 (-5%) | 15mo | $259,900 | $190 | 44 |
| 791 Cedar Oak Dr | 0.68mi | 2/2.0 | 1,622 (+13%) | 11mo | $499,000 | $308 | 34 |
Match score weights: distance 35% · size 25% · config 20% · recency 20%. Top-matched comps best support the ARV.
Projected returns pro-forma
-3.0% appreciation · 3.0% rent growth · sell at horizon
- IRR
- -5.7%
- Equity multiple
- 0.79×
- Total profit
- $-14,795
- Equity at exit
- $37,276
- IRR
- 4.0%
- Equity multiple
- 1.29×
- Total profit
- $20,171
- Equity at exit
- $21,615
Cash invested: $70,000 (down + closing). Projections, not guarantees.
Landlord ↔ Tenant lean methodology
- Overall (STATE)
- 87 Strongly Landlord-Friendly
- State Texas
- 87 Strongly Landlord-Friendly · R+5
- County
- — inherits STATE
- City
- — inherits STATE
ZIP-level market 75076
- Home prices YoY
- -17.3%
- Active inventory
- 294
- Price-to-rent
- 8.1×
Monthly cashflow live
- Estimated rent
- $2,575 medium interval (Pro) →
- Mortgage (P&I)
- −$1,311
- Tax from tax record
- −$207 /mo · $2,487/yr
- Insurance
- −$104
- HOA
- −$8
- Vacancy / Maint / Mgmt
- −$541
- Net cashflow
- $404
Break-even live
Sensitivity live
| Price | -10% $546 | -5% $475 | +0% $404 | +5% $333 | +10% $263 |
|---|---|---|---|---|---|
| Rent | -10% $201 | -5% $302 | +0% $404 | +5% $506 | +10% $608 |
| Rate | -1.0pp $530 | -0.5pp $468 | base $404 | +0.5pp $339 | +1.0pp $273 |
UW: 25.0% down · 7.5% · 30yr · 1.5% tax · 5.0% vac · 8.0% maint · 8.0% mgmt
Financing live
Cash to close
- Down payment
- $62,500
- Closing costs
- $7,500
- Reserves months
- —
- Total cash needed
- —
Loan-product check · same deal, 3 products live
Conventional
25% down · 7.5% · 30yr
- Down + closing
- —
- Monthly P&I
- —
- Monthly cashflow
- —
- DSCR
- —
- Eligible?
- —
Personal DTI + credit; lowest rate.
DSCR
20% down · 8.5% · 30yr
- Down + closing
- —
- Monthly P&I
- —
- Monthly cashflow
- —
- DSCR
- —
- Eligible?
- —
No personal income docs; deal must DSCR.
Hard money
10% down · 12.0% · 12mo
- Down + closing
- —
- Monthly P&I
- —
- Monthly cashflow
- —
- DSCR
- —
- Eligible?
- —
Short-term bridge; refi at stabilization.
Rent comps 5 comps
| Address | Beds | Baths | Sqft | Rent | $/sqft | DOM | Units | Dist |
|---|---|---|---|---|---|---|---|---|
| 162 Kent St Pottsboro, TX | 3.0 | 1.0 | 1416 | $1,150 | $0.81 | 22d | 1 | 0.11mi |
| 2164 Tanglewood Blvd Unit D311 Pottsboro, TX | 2.0 | 2.0 | 957 | $1,650 | $1.72 | 45d | 1 | 1.33mi |
| 2164 Tanglewood Blvd Pottsboro, TX | 2.0 | 3.0 | 1262 | $2,200 | $1.74 | 22d | 1 | 1.33mi |
| 290 Tanglewood Cir Unit 5441/42 Pottsboro, TX | 2.0 | 2.5 | 1500 | $4,500 | $3.00 | 22d | 1 | 1.39mi |
| 290 Tanglewood Cir Unit 5437/38 Pottsboro, TX | 2.0 | 2.5 | 1500 | $3,500 | $2.33 | 22d | 1 | 1.39mi |
HOA detail
- Monthly dues
- $8 · $96/yr
Listing history 23 events
-
2026-06-21days on market $250,000 Active 107 DOM
-
2026-06-19days on market $250,000 Active 105 DOM
-
2026-06-18days on market $250,000 Active 104 DOM
-
2026-06-17days on market $250,000 Active 103 DOM
-
2026-06-16days on market $250,000 Active 102 DOM
-
2026-06-15days on market $250,000 Active 101 DOM
-
2026-06-14days on market $250,000 Active 99 DOM
-
2026-06-13days on market $250,000 Active 98 DOM
-
2026-06-10days on market $250,000 Active 96 DOM
-
2026-06-09days on market $250,000 Active 95 DOM
-
2026-06-08days on market $250,000 Active 94 DOM
-
2026-06-07pricedays on market $250,000 Active 93 DOM
-
2026-06-03days on market $268,000 Active 89 DOM
-
2026-06-02days on market $268,000 Active 88 DOM
-
2026-06-01days on market $268,000 Active 87 DOM
-
2026-05-31days on market $268,000 Active 86 DOM
-
2026-05-30days on market $268,000 Active 85 DOM
-
2026-03-06$268,000 Active 1070-char remark
Show marketing remark (1070 chars)
Welcome to Cambridge Shores, one of Lake Texoma’s most desirable lake communities—complete with a neighborhood boat ramp and a courtesy dock just a quick golf cart ride away. Situated on a quiet street with minimal traffic, this property offers the perfect setup for a full-time residence or weekend retreat. The home features an open floor plan with great flow between living, dining, and kitchen areas—ready for your personal updates and finishing touches. Recent improvements include all-new siding, windows, new kitchen cabinets and lighting giving you a solid head start on renovations. Attached, you’ll find a garage ideal for storing your vehicle, a golf cart or all your lake toys, plus a fenced area perfect for pets or even a garden space. Short-term rentals are allowed in the neighborhood, making this an excellent opportunity for personal enjoyment and potential investment income. If you’ve been looking for an affordable way to get into Cambridge Shores and customize a lake property to your style, this is your opportunity.
-
2006-11-30soldstatus
-
2006-11-29soldstatus 190-char remark
Show marketing remark (190 chars)
Great 3 bedroom lakehouse on two and a half lots with garage and fenced yard. Perfect for weekend fun at the lake or full time family living. Only a few blocks to the neighborhood boat ramp.
-
2006-11-03historical 190-char remark
Show marketing remark (190 chars)
Great 3 bedroom lakehouse on two and a half lots with garage and fenced yard. Perfect for weekend fun at the lake or full time family living. Only a few blocks to the neighborhood boat ramp.
-
2006-07-18$83,900 190-char remark
Show marketing remark (190 chars)
Great 3 bedroom lakehouse on two and a half lots with garage and fenced yard. Perfect for weekend fun at the lake or full time family living. Only a few blocks to the neighborhood boat ramp.
-
2003-05-22soldstatus
ⓘ Source: listings_history table (triggers on properties + properties_extension) + one-shot
backfill from property_details.listing_events for pre-trigger history.
Tax reassessment forecast TX · Resets to sale price
- Current annual tax
- $2,487 · $207/mo
- Projected year-2 tax
- $4,575 · $381/mo
- Expected delta
- +$2,088/yr (+$174/mo · 83.9%)
ⓘ Screening estimate from a state-policy table — verify with the county assessor before closing.
Climate risk First Street
- Flood 1/10 Low FEMA zone X (unshaded) · 0% chance over 30 yrs
- Wildfire 6/10 Major
- Heat 6/10 Major 7 d/yr ≥109°F today · 21 d/yr by 30 yrs out
- Wind 4/10 Moderate 18% chance of damaging wind over 30 yrs
- Air quality 3/10 Moderate 3 unhealthy d/yr today · 3 by 30 yrs out
Nearby sold comps map
Loading sold comps map…
Walkable amenities ~0.75 mi
Loading nearby amenities…
Taxation est. · year 1
- Rental income
- $30,904
- − Mortgage interest
- −$14,004
- − Property taxes
- −$2,487
- − Insurance
- −$1,250
- − Repairs & maintenance
- −$2,472
- − Management
- −$2,472
- − HOA
- −$96
- − Depreciation
- −$7,273
- Taxable income
- $850
- Est. tax owed @ 24.0%
- −$204
- After-tax cash flow
- $4,645/yr
For passive investors: Depreciation is non-cash, so a rental often shows a tax loss while cash-flowing — sheltering income. Rental losses are passive: they offset passive income freely, and up to $25,000/yr can offset ordinary (W-2) income if you actively participate and your MAGI is under $100k (phasing out to $0 by $150k); unused losses carry forward. On sale, claimed depreciation is recaptured at up to 25%, and gains may owe capital-gains tax (a 1031 exchange can defer both). Figures are a year-1 estimate at your 24.0% rate — not tax advice; consult a CPA.
Schools (NCES district)
- District
- Pottsboro ISD
- NCES district ID
- 4835580
- Math proficiency
- 39% ▼ -11.00%
- Reading proficiency
- 48% ▼ -6.00%
- Median HH income
- $50,811
- Composite
- 37.44/100
- National rank
- #4414
- State rank
- #288 of 826 in TX
Livability — Preston
- Score
- 56/100
- State rank
- #1306
- US rank
- #22637
Category grades
Schools grade is shown separately in the Schools card above.
Census & demographics
- County
- Grayson County · 108,053 people
- Metro
- Sherman-Denison, TX
- Population (ZIP)
- 7,989
- Household income
- $76,919
- Rent vs Own
- Severe rent burden
- 169.0
Population outlook (Grayson County) Hauer SSP2
- Today (2025)
- 134,540 people
- By 2030
- 138,653 · +3.1%
- By 2040
- 145,958 · +8.5%
- By 2050
- 151,218 · +12.4%
- By 2075
- 161,802 · +20.3%
- By 2100
- 159,036 · +18.2%
Race, ethnicity, and origin ACS 2023
- Neighborhood character
- Predominantly White (88%)
- Race & ethnicity
- White 88% Two or more races 7% Hispanic / Latino 3% Asian 1% Native American 1%
- Common ancestry
- Serbian 2% Scottish 2% Scotch-Irish 2%
- Foreign-born
- 2% · Canada
- Languages at home
- 95% English-only · Spanish 3%
Political lean MEDSL · Grayson
- 2024 margin
- Solid R (+54.3) · D 22.5% · R 76.7%
- 2008→2024 swing
- -16.4pp toward R · 2008: -37.9pp · 2024: -54.3pp
- All cycles
- 2024: R+54.3 2020: R+49.9 2016: R+53.1 2012: R+48.0 2008: R+37.9
Not yet ingested
- Civics
- —
Market trends
- HPI YoY
- ▼ -51.29%
- Current HPI
- 244.52
- Rent YoY
- —
- Metro
- Sherman-Denison, TX
- State GDP YoY
- ▲ 3.95%
- F500 in state
- 110
Industry mix (Fortune 500 HQ in TX)
| Industry | F500 HQs | Revenue |
|---|---|---|
| Energy | 16 | $1,198B |
|
||
| Technology | 5 | $198B |
|
||
| Engineering / Construction | 4 | $72B |
|
||
| Energy Services | 3 | $60B |
|
||
| Utilities | 3 | $41B |
|
||
| Healthcare | 2 | $330B |
|
||
Price history
+219.4% since first listed6 events — show timeline
- 2026-03-06 Listed $268,000 NTREIS
- 2006-11-30 Sold (Public Records) — Public Records
- 2006-11-29 Sold (MLS) — NTREIS
- 2006-11-03 Listing Removed — NTREIS
- 2006-07-18 Listed $83,900 NTREIS
- 2003-05-22 Sold (Public Records) — Public Records
Property tax history
+3.4%/yrLatest (2025): $2,487 · +10.0% YoY. Source: county tax records.
Cash-flow waterfall
monthlySold comps — $/sqft
last 12 mo · ≤1 miLoading sold comps…