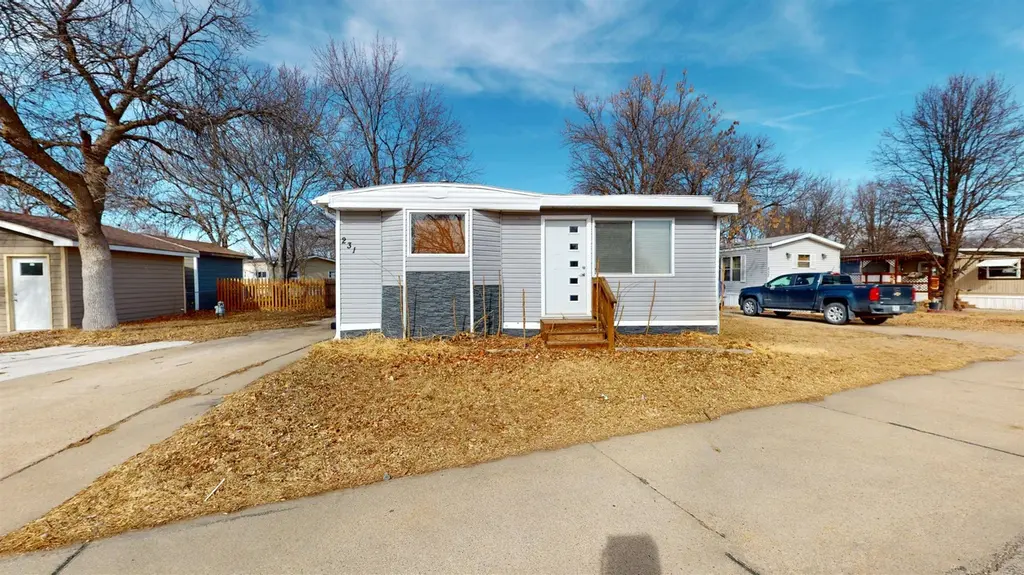
231 E Lawn Ct · Kearney, NE
Flood risk 1/10 · Minimal
- FEMA flood zone
- X (unshaded)
- Chance of flooding over 30 yrs
- 0.0%
- Est. flood insurance / yr
- $507 – $1,088
Fire risk 2/10 · Minimal
- Est. fire insurance / yr
- $1,161 – $2,155
Heat risk 3/10 · Minor
- Hot days now (above 100°F)
- 7 days/yr
- Hot days in 30 yrs
- 16 days/yr
Wind risk 2/10 · Minimal
- Chance of severe wind over 30 yrs
- —
Air-quality risk 1/10 · Minimal
- Unhealthy air days now
- 0 days/yr
- Unhealthy air days in 30 yrs
- 0 days/yr
Risk factors via First Street. Map © Google.
Why this score? — see what drove the B grade
The composite is a weighted blend of 9 inputs, each scored 0–100. Each bar is that input's sub-score; the figure is the points it added to the 100-point composite (weight × sub-score).
- Cash flow +30.0/30.0
- 1% rule +10.0/10.0
- DSCR +10.0/10.0
- ARV discount +7.5/15.0
- Schools +4.7/10.0
- Livability +4.2/5.0
- Condition / age +3.8/5.0
- Rent growth +2.5/5.0
- Appreciation +0.0/10.0
$69,000
🖨 Deal sheet (PDF) 📄 Offer letter ✓ Due diligence
Listing remarks MLS
Step into this adorable and inviting 3-bedroom, 2-bath home that blends classic charm with modern comfort! Originally built in 1976, this property has been beautifully updated throughout, offering the best of both worlds — character and convenience. This home is move-in ready and waiting for its next owner to fall in love. Don't miss out! Schedule your showing today! All potential buyers need to be approved by East Lawn before the purchase of this home.
Key facts
- Built 1976
- Listed 121 days
Neighborhood map
What this means for you Summary
Snapshot
- This is a 3-bed/2.0-bath manufactured listed at $69k. Condition is rated good.
Deal economics
- At list price, monthly cash flow is $800 ($10k/yr) — positive.
- The deal already cash-flows at list — no discount required.
- Meets the 1% rule at list price ($2k rent vs $69k).
- Recommended offer: $61k (12.0% below list) — sets the bar for market timing.
- Cap rate 20.2% vs local median 2.5% in Kearney — top-decile yield for the area; either an underpriced asset or a hidden risk that comps aren't pricing in. Stress-test before assuming the spread holds.
Location & tenants
- Location reads 83/100 on livability (#11 in NE, #858 nationally) — a professional / high-income tenant draw. Strengths: cost of living A+, housing A+, health & safety A+; Watch: commute F.
- Kearney Public Schools (town): math 55% / reading 54% proficiency, ranked #43 of 111 in NE (top 39%) — acceptable for families but not a draw, mixed tenant base, ~2y average lease.
- Market conditions: 110 active listings in the ZIP; 11 comparable units currently listed for rent nearby; rentals lingering (median 45d on market — plan ~5-8 weeks vacancy on turnover, expect pricing pressure); 100% of comp listings sitting > 30 days — soft ceiling on asking rent; 125 units permitted in Buffalo County in 2024 (0 in 5+ unit buildings).
Forward outlook
- Local home prices are declining (-3.0%/yr); year-one equity from $477 of loan paydown is wiped out by about $2k of value loss. Plan a longer hold.
- Buffalo County population projected at +31% by 2050 — long-run rental-demand tailwind backs the buy-and-hold thesis.
- At projected returns (-3.0% appreciation + 3.0% rent growth), your $19k cash investment doubles in ~3 years — after that, you're playing with house money.
Negotiation context
- It's been on market 122 days — a 12% lower offer ($61k) is reasonable based on typical stale-listing flexibility.
Questions for the listing agent
- It's been on market 122 days. Have you received any prior offers? Is the seller open to a 12% concession, seller financing, or rate buy-down credit?
- Built in 1976 — when were the roof, HVAC, electrical panel, plumbing, and water heater last replaced?
- What does the HOA fee cover, when was the last increase, and are there any pending special assessments or reserve-fund shortfalls?
- Why hasn't it sold? Are there any deal-killer items the seller is aware of (foundation, flood, title, zoning, code violations)?
- Is there a deadline driving the sale (1031 exchange, divorce, estate, relocation)? That informs how much negotiation room exists.
- Schools are A-rated — typically a magnet for longer-tenancy family renters. What's the average tenant stay here, and is there a school-zone premium baked into asking?
- What's the average days-on-market for RENTAL listings here right now (not sales)? A rising rental-DOM trend means longer vacancies and softer asking-rent achievability than the comps imply.
- What's the recent tenant-quality profile in this submarket — average credit score on applications, eviction rate, late-payment / NSF rate, and stable-employment percentage? A property-management company in the area should have these aggregated.
- How much new for-sale + rental construction is in the pipeline within 1–3 miles? Heavy new supply typically softens prices + rents 12–24 months out; constrained supply supports both.
Investment metrics
- 1% rule
- 3.08% ✓
- Cap rate
- 20.20%
- Cash-on-cash
- 49.67%
- DSCR
- 3.21
- GRM
- 2.7
CMA / ARV
No comps found within radius.
Projected returns pro-forma
-3.0% appreciation · 3.0% rent growth · sell at horizon
- IRR
- 47.5%
- Equity multiple
- 3.07×
- Total profit
- $40,025
- Equity at exit
- $10,288
- IRR
- 53.3%
- Equity multiple
- 6.26×
- Total profit
- $101,559
- Equity at exit
- $5,966
Cash invested: $19,320 (down + closing). Projections, not guarantees.
Landlord ↔ Tenant lean methodology
- Overall (STATE)
- 83 Strongly Landlord-Friendly
- State Nebraska
- 83 Strongly Landlord-Friendly · R+13
- County
- — inherits STATE
- City
- — inherits STATE
ZIP-level market 68847
- Active inventory
- 110
- Price-to-rent
- 2.7×
Monthly cashflow live
- Estimated rent
- $2,122 high interval (Pro) →
- Mortgage (P&I)
- −$362
- Tax est. 1.5%
- −$86 /mo · $1,035/yr
- Insurance
- −$29
- HOA
- −$400
- Vacancy / Maint / Mgmt
- −$446
- Net cashflow
- $800
Break-even live
Sensitivity live
| Price | -10% $847 | -5% $823 | +0% $800 | +5% $776 | +10% $752 |
|---|---|---|---|---|---|
| Rent | -10% $632 | -5% $716 | +0% $800 | +5% $883 | +10% $967 |
| Rate | -1.0pp $834 | -0.5pp $817 | base $800 | +0.5pp $782 | +1.0pp $764 |
UW: 25.0% down · 7.5% · 30yr · 1.5% tax · 5.0% vac · 8.0% maint · 8.0% mgmt
Financing live
Cash to close
- Down payment
- $17,250
- Closing costs
- $2,070
- Reserves months
- —
- Total cash needed
- —
Loan-product check · same deal, 3 products live
Conventional
25% down · 7.5% · 30yr
- Down + closing
- —
- Monthly P&I
- —
- Monthly cashflow
- —
- DSCR
- —
- Eligible?
- —
Personal DTI + credit; lowest rate.
DSCR
20% down · 8.5% · 30yr
- Down + closing
- —
- Monthly P&I
- —
- Monthly cashflow
- —
- DSCR
- —
- Eligible?
- —
No personal income docs; deal must DSCR.
Hard money
10% down · 12.0% · 12mo
- Down + closing
- —
- Monthly P&I
- —
- Monthly cashflow
- —
- DSCR
- —
- Eligible?
- —
Short-term bridge; refi at stabilization.
Rent comps 11 comps
| Address | Beds | Baths | Sqft | Rent | $/sqft | DOM | Units | Dist |
|---|---|---|---|---|---|---|---|---|
| 2112 University Dr Kearney, NE | 1.0–2.0 | 1.0–2.0 | 874 | $1,850 | $2.12 | 44d | 3 | 0.37mi |
| 2125 Normal St Unit 101 Kearney, NE | 2.0 | 2.0 | 1191 | $2,395 | $2.01 | 44d | 1 | 0.38mi |
| 2125 Normal St Unit 201 Kearney, NE | 2.0 | 2.0 | 1191 | $1,899 | $1.59 | 44d | 1 | 0.38mi |
| 2114 University Dr Kearney, NE | 2.0 | 1.0–2.0 | 1022 | $2,545 | $2.49 | 44d | 23 | 0.41mi |
| 2109 Chancellors Ave Kearney, NE | 2.0 | 2.5 | 1753 | $2,495 | $1.42 | 44d | 1 | 0.44mi |
| 2005 Chancellors Ave Kearney, NE | 2.0 | 2.5 | 1753 | $2,495 | $1.42 | 44d | 1 | 0.45mi |
| 2122 Normal St Unit 102 Kearney, NE | 2.0 | 2.0 | 1191 | $2,395 | $2.01 | 44d | 1 | 0.45mi |
| 2122 Normal St Unit 204 Kearney, NE | 2.0 | 2.0 | 1191 | $1,899 | $1.59 | 44d | 1 | 0.45mi |
| 2500 W 24th St Kearney, NE | 3.0 | 1.0 | 1200 | $975 | $0.81 | 44d | 1 | 0.68mi |
| 2119 State ST Apt 201 Kearney, NE | 2.0 | 2.0 | 1191 | $1,899 | $1.59 | 44d | 1 | 1.16mi |
| 1902 W 38th St Kearney, NE | 2.0 | 2.0 | 1100 | $1,100 | $1.00 | 44d | 1 | 1.24mi |
HOA detail
- Monthly dues
- $400 · $4,800/yr
Listing history 17 events
-
2026-06-19days on market $69,000 Active 122 DOM
-
2026-06-18days on market $69,000 Active 121 DOM
-
2026-06-17days on market $69,000 Active 120 DOM
-
2026-06-16days on market $69,000 Active 119 DOM
-
2026-06-15days on market $69,000 Active 118 DOM
-
2026-06-14days on market $69,000 Active 116 DOM
-
2026-06-12days on market $69,000 Active 115 DOM
-
2026-06-09days on market $69,000 Active 112 DOM
-
2026-06-08days on market $69,000 Active 111 DOM
-
2026-06-07days on market $69,000 Active 110 DOM
-
2026-06-07days on market $69,000 Active 109 DOM
-
2026-06-04days on market $69,000 Active 106 DOM
-
2026-06-02days on market $69,000 Active 105 DOM
-
2026-06-01days on market $69,000 Active 104 DOM
-
2026-05-31days on market $69,000 Active 103 DOM
-
2026-05-31days on market $69,000 Active 102 DOM
-
2026-02-09$75,000 Active 465-char remark
Show marketing remark (465 chars)
Step into this adorable and inviting 3-bedroom, 2-bath home that blends classic charm with modern comfort! Originally built in 1976, this property has been beautifully updated throughout, offering the best of both worlds — character and convenience. This home is move-in ready and waiting for its next owner to fall in love. Don't miss out! Schedule your showing today! All potential buyers need to be approved by East Lawn before the purchase of this home.
ⓘ Source: listings_history table (triggers on properties + properties_extension) + one-shot
backfill from property_details.listing_events for pre-trigger history.
Climate risk First Street
- Flood 1/10 Low FEMA zone X (unshaded) · 0% chance over 30 yrs
- Wildfire 2/10 Low
- Heat 3/10 Moderate 7 d/yr ≥100°F today · 16 d/yr by 30 yrs out
- Wind 2/10 Low
- Air quality 1/10 Low 0 unhealthy d/yr today · 0 by 30 yrs out
Nearby sold comps map
Loading sold comps map…
Walkable amenities ~0.75 mi
Loading nearby amenities…
Taxation est. · year 1
- Rental income
- $25,465
- − Mortgage interest
- −$3,865
- − Property taxes
- −$1,035
- − Insurance
- −$345
- − Repairs & maintenance
- −$2,037
- − Management
- −$2,037
- − HOA
- −$4,800
- − Depreciation
- −$2,007
- Taxable income
- $9,338
- Est. tax owed @ 24.0%
- −$2,241
- After-tax cash flow
- $7,354/yr
For passive investors: Depreciation is non-cash, so a rental often shows a tax loss while cash-flowing — sheltering income. Rental losses are passive: they offset passive income freely, and up to $25,000/yr can offset ordinary (W-2) income if you actively participate and your MAGI is under $100k (phasing out to $0 by $150k); unused losses carry forward. On sale, claimed depreciation is recaptured at up to 25%, and gains may owe capital-gains tax (a 1031 exchange can defer both). Figures are a year-1 estimate at your 24.0% rate — not tax advice; consult a CPA.
Condition & rehab AI · 12 photos
This move-in ready 3-bedroom, 2-bath home offers a blend of classic charm and modern comfort, with updates throughout. Ideal for investors looking to add value with minor improvements.
Value-add opportunities
- Both Painting exterior and interior walls — Enhances curb appeal and interior aesthetics
- Both Updating countertops and backsplash in kitchen — Modernizes the space and adds value
- Both Upgrading lighting fixtures throughout — Improves ambiance and energy efficiency
Renovation cost estimate screening
Value-add ROI direction
- Both Painting exterior and interior walls — Enhances curb appeal and interior aesthetics ↑
- Both Updating countertops and backsplash in kitchen — Modernizes the space and adds value ↑
- Both Upgrading lighting fixtures throughout — Improves ambiance and energy efficiency ↑
ⓘ Cost ranges are severity-bucket heuristics (US national rule-of-thumb). Get contractor quotes + a written scope before underwriting a rehab budget.
Schools (NCES district)
- District
- Kearney Public Schools
- NCES district ID
- 3172390
- Math proficiency
- 55% ▼ -3.00%
- Reading proficiency
- 54% ▼ -4.00%
- Median HH income
- $50,913
- Composite
- 46.61/100
- National rank
- #2415
- State rank
- #43 of 111 in NE
Livability — Kearney
- Score
- 83/100
- State rank
- #11
- US rank
- #858
Category grades
Schools grade is shown separately in the Schools card above.
Census & demographics
- Census place
- Kearney, NE
- City population
- 20,536
- Population (ZIP)
- 17,911
Population outlook (Buffalo County) Hauer SSP2
- Today (2025)
- 54,980 people
- By 2030
- 58,298 · +6.0%
- By 2040
- 64,975 · +18.2%
- By 2050
- 72,054 · +31.1%
- By 2075
- 90,838 · +65.2%
- By 2100
- 106,838 · +94.3%
Race, ethnicity, and origin ACS 2023
- Neighborhood character
- Predominantly White (83%)
- Race & ethnicity
- White 83% Hispanic / Latino 11% Two or more races 4% Asian 3%
- Hispanic origin (detail)
- Mexican 8%
- Common ancestry
- Lithuanian 3% Romanian 2% Italian 2%
- Foreign-born
- 6% · Canada, China, South Korea
- Languages at home
- 91% English-only · Spanish 5% Chinese 2% German/W. Germanic 1%
Political lean MEDSL · Buffalo
- 2024 margin
- Solid R (+44.9) · D 26.9% · R 71.8% · Other 1.3%
- 2008→2024 swing
- -7.5pp toward R · 2008: -37.5pp · 2024: -44.9pp
- All cycles
- 2024: R+44.9 2020: R+43.4 2016: R+47.5 2012: R+42.6 2008: R+37.5
Not yet ingested
- Civics
- —
Market trends
- HPI YoY
- ▼ -129.96%
- Current HPI
- 205.0002
- Rent YoY
- —
- Metro
- —
- State GDP YoY
- ▲ 0.68%
- F500 in state
- 2
Industry mix (Fortune 500 HQ in NE)
| Industry | F500 HQs | Revenue |
|---|---|---|
| Conglomerate | 1 | $371B |
|
||
Price history
1 event — show timeline
- 2026-02-09 Listed $75,000 GMNMLS
Cash-flow waterfall
monthlySold comps — $/sqft
last 12 mo · ≤1 miLoading sold comps…