 🌊 Lakefront
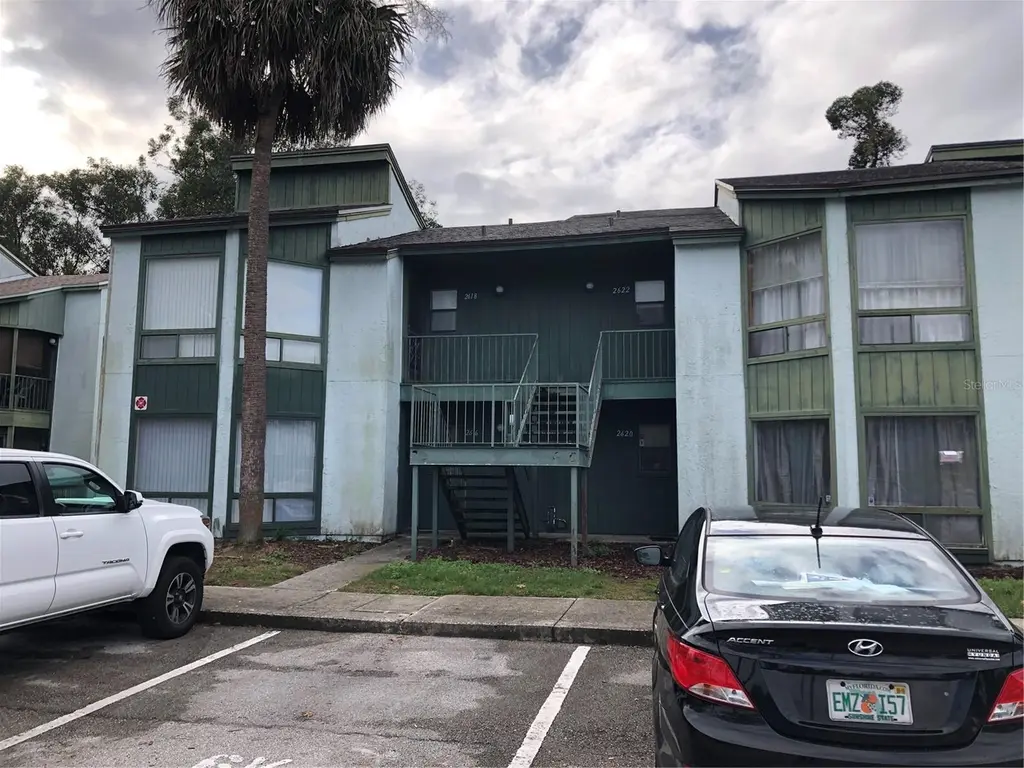
2616 Lemon Tree Ln Unit F · Orlando, FL
Flood risk No data
- FEMA flood zone
- —
- Chance of flooding over 30 yrs
- —
- Est. flood insurance / yr
- —
Fire risk No data
- Est. fire insurance / yr
- —
Heat risk No data
- Hot days now (above threshold)
- —
- Hot days in 30 yrs
- —
Wind risk No data
- Chance of severe wind over 30 yrs
- —
Air-quality risk No data
- Unhealthy air days now
- —
- Unhealthy air days in 30 yrs
- —
Risk factors via First Street. Map © Google.
Why this score? — see what drove the D grade
The composite is a weighted blend of 9 inputs, each scored 0–100. Each bar is that input's sub-score; the figure is the points it added to the 100-point composite (weight × sub-score).
- Cash flow +10.6/30.0
- 1% rule +8.8/10.0
- ARV discount +7.5/15.0
- Livability +4.3/5.0
- Schools +4.1/10.0
- DSCR +3.1/10.0
- Rent growth +2.4/5.0
- Condition / age +2.2/5.0
- Appreciation +0.0/10.0
$87,900
🖨 Deal sheet (PDF) 📄 Offer letter ✓ Due diligence
Listing remarks
This is a great opportunity of Investors amazing location tenant in place paying $1250 per month first floor condo need a little TLC 1 bedroom, 1 bathroom
Key facts
- Community pool
- Built 1976
- Listed 88 days
Property features AI
Finance
- Other: Unfurnished; No lease restrictions indicated
- HOA & community: HOA with monthly fees; Association approval required; HOA includes pool; Community pool; Community tennis courts; Pets allowed (up to 25 lbs)
Exterior
- Utilities: Private water; Private sewer; Cable available
- Home design: Condominium; Residential property; One-level; Faces south; Unit on first floor
- Construction: Frame construction; Shingle roof; Built on block foundation
- Exterior features: Balcony; Asphalt road access
Interior
- Kitchen: Dishwasher; Range hood; Refrigerator
- Bedrooms: 1 bedroom
- Flooring: Ceramic tile; Block foundation
- Bathrooms: 1 full bathroom
- Heating & cooling: Central heat; Central air
- Interior features: Ceiling fans
- Laundry & utility: Inside laundry; Washer; Dryer
Neighborhood map
What this means for you Summary
Snapshot
- This is a 1-bed/1.0-bath condo listed at $88k. Condition is rated fair.
Deal economics
- At list price, monthly cash flow is $-43 ($-522/yr) — negative.
- The deal already cash-flows at list — no discount required.
- Meets the 1% rule at list price ($1k rent vs $88k).
- Recommended offer: $83k (6.0% below list) — sets the bar for market timing.
- Cap rate 5.7% vs local median 3.0% in Orlando — top-decile yield for the area; either an underpriced asset or a hidden risk that comps aren't pricing in. Stress-test before assuming the spread holds.
Location & tenants
- Location reads 86/100 on livability (#12 in FL, #360 nationally) — a professional / high-income tenant draw. Strengths: amenities A+, commute A+, housing A+.
- Orange (suburban): math 46% / reading 51% proficiency, ranked #43 of 73 in FL (top 59%) — families likely to look elsewhere, expect single-tenant / working-renter base with shorter leases.
- Zoned schools: Catalina Elementary (math 35% / reading 26%, grade F, #1,862 of 2,144 statewide, top 88%, 612 students, 82% FRL); Memorial Middle (math 29% / reading 30%, grade F, #469 of 571 statewide, top 84%, 944 students, 75% FRL); Oak Ridge High (math 17% / reading 27%, grade F, #544 of 667 statewide, top 82%, 2,477 students, 66% FRL) — zoned schools average 75% FRL vs 56% district-wide (18 pts higher); higher-poverty schools than district average — tighter screening recommended.
- Zoned-school proficiency averages 27% at this address vs 48% district-wide (-21 pts) — the specific schools serving this property underperform the Orange average; the district grade overstates school quality for this exact location.
- Market conditions: Rents soft (-0.5%/yr); 224 active listings in the ZIP; 28 comparable units currently listed for rent nearby; rentals leasing fast (median 10d on market — plan ~1-2 weeks tenant-placement turnaround); 8,053 units permitted in Orange County in 2024 (3,133 in 5+ unit buildings).
- This rent runs 31% of the median local income ($47k/yr) — at the standard rent-burdened threshold; future hikes will face affordability resistance.
Forward outlook
- Local home prices are declining (-3.0%/yr); year-one equity from $608 of loan paydown is wiped out by about $3k of value loss. Plan a longer hold.
- Orange County population projected at +52% by 2050 — long-run rental-demand tailwind backs the buy-and-hold thesis.
Negotiation context
- It's been on market 89 days — a 6% lower offer ($83k) is reasonable based on typical stale-listing flexibility.
Risks & watch-outs
- Watch-outs: HOA is 33% of rent.
Questions for the listing agent
- What do current leases actually rent for vs. the listed asking? Can we see a recent rent roll and the last 12 months of T-12 income?
- It's been on market 89 days. Have you received any prior offers? Is the seller open to a 6% concession, seller financing, or rate buy-down credit?
- Have any recent inspections been done? Can we get a copy of the seller's disclosures and any deferred-maintenance estimates?
- Built in 1976 — when were the roof, HVAC, electrical panel, plumbing, and water heater last replaced?
- What does the HOA fee cover, when was the last increase, and are there any pending special assessments or reserve-fund shortfalls?
- Any open or pending special assessments — roof, HVAC, plumbing, elevator, façade? What's the per-unit balance and payoff schedule, and is the seller paying it off at close or rolling it to the buyer?
- Why hasn't it sold? Are there any deal-killer items the seller is aware of (foundation, flood, title, zoning, code violations)?
- Is there a deadline driving the sale (1031 exchange, divorce, estate, relocation)? That informs how much negotiation room exists.
- Schools are B-rated — typically a magnet for longer-tenancy family renters. What's the average tenant stay here, and is there a school-zone premium baked into asking?
- The area grade is low — what's the realistic commute time and amenity access for the typical tenant pool here? Any planned neighborhood developments (good or bad) we should know about?
- This sits on a lake — are riparian / water-frontage rights deeded with the parcel? Any dock permits, shoreline easements, or HOA water-use restrictions?
- What's the documented flood / surge / shoreline-erosion history here (FEMA AND non-FEMA — e.g., storm surge, creek backup, septic-field saturation)?
- Any water-quality or seasonal algae-bloom issues that affect tenant satisfaction or short-term-rental demand?
- What's the average days-on-market for RENTAL listings here right now (not sales)? A rising rental-DOM trend means longer vacancies and softer asking-rent achievability than the comps imply.
- What's the recent tenant-quality profile in this submarket — average credit score on applications, eviction rate, late-payment / NSF rate, and stable-employment percentage? A property-management company in the area should have these aggregated.
Investment metrics
- 1% rule
- 1.38% ✓
- Cap rate
- 5.70%
- Cash-on-cash
- -2.12%
- DSCR
- 0.91
- GRM
- 6.0
CMA / ARV
No comps found within radius.
Projected returns pro-forma
-3.0% appreciation · 0.0% rent growth · sell at horizon
- IRR
- -25.4%
- Equity multiple
- 0.17×
- Total profit
- $-20,308
- Equity at exit
- $13,106
- IRR
- -53.2%
- Equity multiple
- -0.38×
- Total profit
- $-33,936
- Equity at exit
- $7,600
Cash invested: $24,612 (down + closing). Projections, not guarantees.
Landlord ↔ Tenant lean methodology
- Overall (STATE)
- 87 Strongly Landlord-Friendly
- State Florida
- 87 Strongly Landlord-Friendly · R+3
- County
- — inherits STATE
- City
- — inherits STATE
ZIP-level market 32839
- Home prices YoY
- -20.1%
- Rents YoY
- -0.5%
- Active inventory
- 224
- Price-to-rent
- 6.0×
Monthly cashflow live
- Estimated rent
- $1,214 high interval (Pro) →
- Mortgage (P&I)
- −$461
- Tax est. 1.5%
- −$110 /mo · $1,318/yr
- Insurance
- −$37
- HOA est. from 5 same-building comps
- −$395
- Vacancy / Maint / Mgmt
- −$255
- Net cashflow
- $-43
Break-even live
Sensitivity live
| Price | -10% $17 | -5% $-13 | +0% $-43 | +5% $-74 | +10% $-104 |
|---|---|---|---|---|---|
| Rent | -10% $-139 | -5% $-91 | +0% $-43 | +5% $4 | +10% $52 |
| Rate | -1.0pp $1 | -0.5pp $-21 | base $-43 | +0.5pp $-66 | +1.0pp $-89 |
UW: 25.0% down · 7.5% · 30yr · 1.5% tax · 5.0% vac · 8.0% maint · 8.0% mgmt
Financing live
Cash to close
- Down payment
- $21,975
- Closing costs
- $2,637
- Reserves months
- —
- Total cash needed
- —
Loan-product check · same deal, 3 products live
Conventional
25% down · 7.5% · 30yr
- Down + closing
- —
- Monthly P&I
- —
- Monthly cashflow
- —
- DSCR
- —
- Eligible?
- —
Personal DTI + credit; lowest rate.
DSCR
20% down · 8.5% · 30yr
- Down + closing
- —
- Monthly P&I
- —
- Monthly cashflow
- —
- DSCR
- —
- Eligible?
- —
No personal income docs; deal must DSCR.
Hard money
10% down · 12.0% · 12mo
- Down + closing
- —
- Monthly P&I
- —
- Monthly cashflow
- —
- DSCR
- —
- Eligible?
- —
Short-term bridge; refi at stabilization.
Rent comps 28 comps
| Address | Beds | Baths | Sqft | Rent | $/sqft | DOM | Units | Dist |
|---|---|---|---|---|---|---|---|---|
| 2636 Lemon Tree Ln #2636 Orlando, FL | 1.0 | 1.0 | 642 | $1,050 | $1.64 | 25d | 1 | 0.03mi |
| 4308 Lakeway Dr Unit E Orlando, FL | 1.0 | 1.0 | 642 | $1,200 | $1.87 | 25d | 1 | 0.08mi |
| 5017 City St #1923 Orlando, FL | 1.0 | 1.0 | 724 | $1,500 | $2.07 | 25d | 1 | 0.39mi |
| 5028 Park Central Dr #2133 Orlando, FL | 1.0 | 1.0 | 605 | $1,350 | $2.23 | 25d | 1 | 0.43mi |
| 5028 Park Central Dr #2131 Orlando, FL | 1.0 | 1.0 | 605 | $1,290 | $2.13 | 4d | 1 | 0.43mi |
| 2210 Yankee Pl #316 Orlando, FL | 1.0 | 1.0 | 535 | $1,375 | $2.57 | 25d | 1 | 0.49mi |
| 2210 Yankee Pl #334 Orlando, FL | 1.0 | 1.0 | 535 | $1,195 | $2.23 | 16d | 1 | 0.49mi |
| 4028 Billingsgate Rd Orlando, FL | 1.0 | 1.0 | 670 | $1,200 | $1.79 | 9d | 1 | 0.50mi |
| 2203 Yankee Pl #427 Orlando, FL | 1.0 | 1.0 | 605 | $1,325 | $2.19 | 6d | 1 | 0.52mi |
| 4255 Barwood Dr Orlando, FL | 1.0–3.0 | 1.0–2.5 | 1071 | $1,185 | $1.11 | 6d | 1 | 0.68mi |
| 1717 Holden Ave Orlando, FL | 1.0–3.0 | 1.0–2.5 | 980 | $1,049 | $1.07 | 0d | 24 | 0.69mi |
| 2437 Americana Blvd Orlando, FL | 2.0 | 1.0–2.0 | 895 | $1,851 | $2.07 | 0d | 16 | 0.70mi |
| 1940 Lake Atriums Cir Orlando, FL | 1.0 | 1.0 | 593 | $1,225 | $2.07 | 25d | 4 | 0.78mi |
| 1916 Lake Atriums Cir Orlando, FL | 1.0 | 1.0 | 593 | $1,172 | $1.98 | 0d | 3 | 0.79mi |
| 1908 Lake Atriums Cir Orlando, FL | 1.0 | 1.0 | 593 | $1,124 | $1.90 | 25d | 3 | 0.81mi |
| 4746 Rio Grande Ave Orlando, FL | 1.0–3.0 | 1.0–2.0 | 920 | $1,146 | $1.25 | 0d | 38 | 0.83mi |
| 1972 Lake Atriums Cir #180 Orlando, FL | 1.0 | 1.0 | 526 | $1,150 | $2.19 | 0d | 1 | 0.83mi |
| 1902 Honour Rd Unit 1902-23 Orlando, FL | 1.0 | 1.0 | 650 | $1,200 | $1.85 | 25d | 1 | 0.85mi |
| 1916 Honour Rd #1 Orlando, FL | 1.0 | 1.0 | 650 | $1,100 | $1.69 | 25d | 1 | 0.85mi |
| 1964 Lake Atriums Cir Orlando, FL | 1.0 | 1.0 | 655 | $1,225 | $1.87 | 9d | 3 | 0.85mi |
| 1964 Lake Atriums Cir Orlando, FL | 1.0 | 1.0 | 526 | $1,250 | $2.38 | 12d | 2 | 0.85mi |
| 1980 Lake Fountain Dr Orlando, FL | 1.0–2.0 | 1.0–2.0 | 870 | $1,199 | $1.38 | 0d | 18 | 0.94mi |
| 4715 Rio Grande Ave Unit 2 Orlando, FL | 1.0 | 1.0 | 750 | $1,195 | $1.59 | 23d | 1 | 0.95mi |
| 3024 Rio Grande Ave Orlando, FL | 1.0–3.0 | 1.0–2.0 | 1058 | $1,099 | $1.04 | 25d | 1 | 1.10mi |
| 5521 Axiom Ave Orlando, FL | — | 1.0 | 400 | $1,000 | $2.50 | 0d | 1 | 1.18mi |
| 4937 Waterway Ct Orlando, FL | 1.0–2.0 | 1.0–2.0 | 775 | $970 | $1.25 | 0d | 60 | 1.19mi |
| 1968 Lake Heritage Cir Orlando, FL | 1.0–2.0 | 1.0–2.0 | 855 | $1,030 | $1.20 | 0d | 27 | 1.35mi |
| 4641 Cason Cove Dr Orlando, FL | 1.0–2.0 | 1.0–2.0 | 800 | $1,247 | $1.56 | 0d | 6 | 1.43mi |
HOA detail condo
- Monthly dues
- $0 · $0/yr
- Assessments
- None detected in remarks — confirm with the listing agent.
Listing history 16 events
-
2026-06-21days on market $87,900 Active 89 DOM
-
2026-06-18days on market $87,900 Active 86 DOM
-
2026-06-17days on market $87,900 Active 85 DOM
-
2026-06-16days on market $87,900 Active 84 DOM
-
2026-06-15days on market $87,900 Active 83 DOM
-
2026-06-13days on market $87,900 Active 81 DOM
-
2026-06-13days on market $87,900 Active 80 DOM
-
2026-06-09days on market $87,900 Active 77 DOM
-
2026-06-08days on market $87,900 Active 76 DOM
-
2026-06-07days on market $87,900 Active 75 DOM
-
2026-06-04days on market $87,900 Active 72 DOM
-
2026-06-03days on market $87,900 Active 71 DOM
-
2026-06-02days on market $87,900 Active 70 DOM
-
2026-06-02days on market $87,900 Active 69 DOM
-
2026-05-31days on market $87,900 Active 68 DOM
-
2026-03-19$87,900 Active
ⓘ Source: listings_history table (triggers on properties + properties_extension) + one-shot
backfill from property_details.listing_events for pre-trigger history.
Nearby sold comps map
Loading sold comps map…
Walkable amenities ~0.75 mi
Loading nearby amenities…
Taxation est. · year 1
- Rental income
- $14,567
- − Mortgage interest
- −$4,924
- − Property taxes
- −$1,318
- − Insurance
- −$440
- − Repairs & maintenance
- −$1,165
- − Management
- −$1,165
- − HOA
- −$4,740
- − Depreciation
- −$2,557
- Taxable loss
- −$1,743
- Est. tax savings @ 24.0%
- +$418
- After-tax cash flow
- $-103/yr
For passive investors: Depreciation is non-cash, so a rental often shows a tax loss while cash-flowing — sheltering income. Rental losses are passive: they offset passive income freely, and up to $25,000/yr can offset ordinary (W-2) income if you actively participate and your MAGI is under $100k (phasing out to $0 by $150k); unused losses carry forward. On sale, claimed depreciation is recaptured at up to 25%, and gains may owe capital-gains tax (a 1031 exchange can defer both). Figures are a year-1 estimate at your 24.0% rate — not tax advice; consult a CPA.
Condition & rehab AI · 12 photos
This first-floor condo is in fair condition with some cosmetic updates needed. Painting and flooring replacements can significantly enhance its value.
Repairs flagged
- Minor Paint — Paint appears worn on interior walls
- Minor Flooring — Tile flooring in good condition
Value-add opportunities
- Both Paint interior walls — Fresh paint enhances curb appeal and interior aesthetics
- Both Replace tile flooring — New flooring improves aesthetics and durability
- Both Update bathrooms — Modernizing bathrooms can attract more tenants and buyers
- Both Upgrade kitchen appliances — Upgraded appliances can increase both rental and resale value
Renovation cost estimate screening
| Repair item | Severity | Est. cost |
|---|---|---|
| Paint · Paint appears worn on interior walls | Minor | $500–3,000 |
| Flooring · Tile flooring in good condition | Minor | $500–3,000 |
| Total estimated repair cost · 2 items | $1,000–6,000 |
Value-add ROI direction
- Both Paint interior walls — Fresh paint enhances curb appeal and interior aesthetics ↑
- Both Replace tile flooring — New flooring improves aesthetics and durability ↑
- Both Update bathrooms — Modernizing bathrooms can attract more tenants and buyers ↑
- Both Upgrade kitchen appliances — Upgraded appliances can increase both rental and resale value ↑
ⓘ Cost ranges are severity-bucket heuristics (US national rule-of-thumb). Get contractor quotes + a written scope before underwriting a rehab budget.
Schools (NCES district)
- District
- Orange
- NCES district ID
- 1201440
- Math proficiency
- 46% ▼ -9.00%
- Reading proficiency
- 51% ▼ -2.00%
- Median HH income
- $49,350
- Composite
- 41.47/100
- National rank
- #3461
- State rank
- #43 of 73 in FL
Livability — Orlando
- Score
- 86/100
- State rank
- #12
- US rank
- #360
Category grades
Schools grade is shown separately in the Schools card above.
Census & demographics
- County
- Orange County · 1,471,359 people
- City population
- 964,969
- Metro
- Orlando-Kissimmee-Sanford, FL
- Population (ZIP)
- 53,242
- Household income
- $47,313
- Rent vs Own
- Severe rent burden
- 5337.0
Population outlook (Orange County) Hauer SSP2
- Today (2025)
- 1,618,226 people
- By 2030
- 1,787,404 · +10.5%
- By 2040
- 2,125,621 · +31.4%
- By 2050
- 2,454,016 · +51.6%
- By 2075
- 3,173,711 · +96.1%
- By 2100
- 3,607,781 · +122.9%
Race, ethnicity, and origin ACS 2023
- Neighborhood character
- Diverse neighborhood (Simpson 0.69)
- Race & ethnicity
- Hispanic / Latino 39% Black 35% Two or more races 17% White 16% Asian 4%
- Hispanic origin (detail)
- Mexican 5% Puerto Rican 14% Cuban 2% Dominican 3%
- Common ancestry
- Hispanic 8% Estonian 1% Lithuanian 1%
- Foreign-born
- 30% · Canada, Jamaica, Vietnam
- Languages at home
- 51% English-only · Spanish 33% French/Haitian/Cajun 9% Other Indo-European 2%
Political lean MEDSL · Orange
- 2024 margin
- D (+13.6) · D 56.1% · R 42.5% · Other 1.3%
- 2008→2024 swing
- -5.0pp toward R · 2008: 18.6pp · 2024: 13.6pp
- All cycles
- 2024: D+13.6 2020: D+23.1 2016: D+24.6 2012: D+18.2 2008: D+18.6
Not yet ingested
- Civics
- —
Market trends
- HPI YoY
- ▼ -89.65%
- Current HPI
- 357.4828
- Rent YoY
- ▼ -0.50%
- Metro
- Orlando-Kissimmee-Sanford, FL
- State GDP YoY
- ▲ 3.28%
- F500 in state
- 36
Industry mix (Fortune 500 HQ in FL)
| Industry | F500 HQs | Revenue |
|---|---|---|
| Industrial Technology | 2 | $29B |
|
||
| Insurance | 2 | $17B |
|
||
| Retail | 1 | $60B |
|
||
| Technology Distribution | 1 | $58B |
|
||
| Homebuilding | 1 | $35B |
|
||
| Technology Manufacturing | 1 | $35B |
|
||
Price history
1 event — show timeline
- 2026-03-19 Listed $87,900 Stellar MLS as Distributed by MLS Grid
Cash-flow waterfall
monthlySold comps — $/sqft
last 12 mo · ≤1 miLoading sold comps…