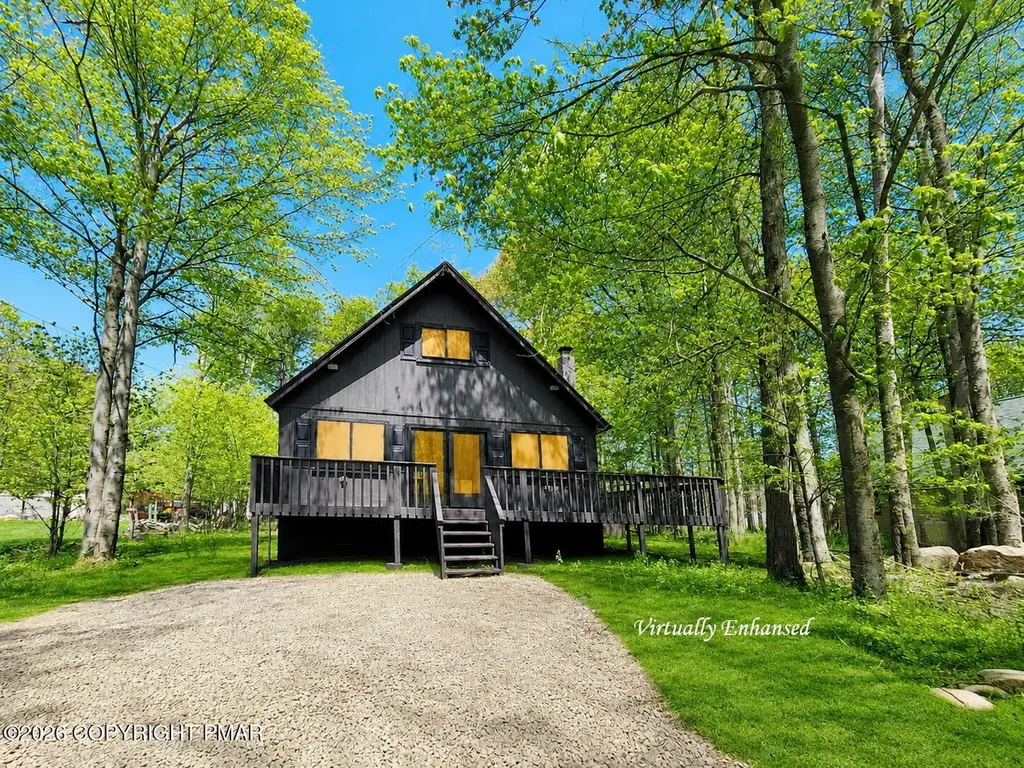
1686 Moonbeam Ter · Pocono Springs, PA
Flood risk 1/10 · Minimal
- FEMA flood zone
- X (unshaded)
- Chance of flooding over 30 yrs
- 0.0%
- Est. flood insurance / yr
- $507 – $1,088
Fire risk 3/10 · Minor
- Est. fire insurance / yr
- $511 – $949
Heat risk 1/10 · Minimal
- Hot days now (above 90°F)
- 7 days/yr
- Hot days in 30 yrs
- 15 days/yr
Wind risk 4/10 · Minor
- Chance of severe wind over 30 yrs
- 7.0%
Air-quality risk 2/10 · Minimal
- Unhealthy air days now
- 1 days/yr
- Unhealthy air days in 30 yrs
- 2 days/yr
Risk factors via First Street. Map © Google.
Why this score? — see what drove the F grade
The composite is a weighted blend of 9 inputs, each scored 0–100. Each bar is that input's sub-score; the figure is the points it added to the 100-point composite (weight × sub-score).
- Cash flow +8.7/30.0
- Appreciation +6.2/10.0
- Schools +4.0/10.0
- Livability +3.7/5.0
- Rent growth +2.5/5.0
- Condition / age +2.5/5.0
- DSCR +2.4/10.0
- 1% rule +2.3/10.0
- ARV discount +0.0/15.0
$299,000
🖨 Deal sheet 📄 Offer letter ✓ Due diligence
Listing remarks MLS
Investor Opportunity with Exceptional Potential in a STR-Friendly Community.
Key facts
- Wooded backdrop
- Community amenities
- Spacious deck
Tags
Property features AI
Finance
- Other: Subdivision: A Pocono Country Place
- HOA & community: Homeowners association present; Annual association fee; Community amenities include gated access, clubhouse, pool, and security
Exterior
- Parking: Off-street open parking for 4 vehicles
- Security: Community security (HOA-provided)
- Utilities: Public water; Public sewer
- Home design: Single family residence; House; Residential zoning; No common walls
- Construction: Shingle roof; Construction materials: see remarks; Crawl space basement
- Exterior features: Wooded lot; Shed(s); Private maintained road
Interior
- Kitchen: Electric range; Dishwasher; Stainless steel appliances
- Bedrooms: Total rooms: 5
- Flooring: Simulated wood; See remarks
- Bathrooms: 2 full bathrooms
- Heating & cooling: Baseboard heating (electric); Ceiling fan(s) for cooling
- Interior features: Kitchen island; Recessed lighting; Track lighting; Fireplace in the living room (wood burning); Unfurnished
- Laundry & utility: Main level laundry; Washer hookup; Electric dryer hookup
Neighborhood map
What this means for you Summary
Snapshot
- This is a 3-bed/1.5-bath single-family listed at $299k.
Deal economics
- At list price, monthly cash flow is $-249 ($-3k/yr) — negative.
- To cash-flow at today's rent, offer at most $255k (14.7% below list).
- To meet the 1% rule (rent ≥ 1% of price), the offer needs to be $218k (27.1% below list).
- Recommended offer: $218k (27.1% below list) — sets the bar for 1% rule.
Location & tenants
- Location reads 73/100 on livability (#560 in PA) — a middle-class / working-renter tenant base. Strengths: crime A+, employment A+, cost of living A+; Watch: schools F, amenities F, commute F.
- Pocono Mountain SD (rural): math 37% / reading 55% proficiency, ranked #245 of 539 in PA (top 46%) — families likely to look elsewhere, expect single-tenant / working-renter base with shorter leases.
- Market conditions: 355 active listings in the ZIP; 6 comparable units currently listed for rent nearby; rentals at typical pace (median 21d on market — plan ~3-4 weeks tenant-placement turnaround); 278 units permitted in Monroe County in 2024 (52 in 5+ unit buildings).
Forward outlook
- In year one you build about $9k of equity ($2k loan paydown + $7k appreciation (2.4% local appreciation)).
- Monroe County population projected at -11% by 2050 — secular population decline; favor cash flow + early exit over multi-decade hold.
- By year 4, paydown + projected appreciation supports a ~$31k cash-out refi (75% LTV) — recoverable capital for the next deal without selling this one.
Negotiation context
- It's been on market 31 days — a 3% lower offer ($290k) is reasonable based on typical stale-listing flexibility.
- 2 sale attempts with the ask held roughly flat each time — persistent listings suggest the price (not the market) is what's stuck; bring a comps-based counter.
- Current owner paid $143k; list at $299k implies a 109% gain — meaningful room to come down on a strong offer.
Questions for the listing agent
- What do current leases actually rent for vs. the listed asking? Can we see a recent rent roll and the last 12 months of T-12 income?
- It's been on market 31 days. Have you received any prior offers? Is the seller open to a 27% concession, seller financing, or rate buy-down credit?
- Built in 1978 — when were the roof, HVAC, electrical panel, plumbing, and water heater last replaced?
- What does the HOA fee cover, when was the last increase, and are there any pending special assessments or reserve-fund shortfalls?
- Is there a deadline driving the sale (1031 exchange, divorce, estate, relocation)? That informs how much negotiation room exists.
- Schools are F-rated, which usually means shorter tenancies and higher turnover. Who's the typical renter profile here, and what's been the actual vacancy rate?
- The area grade is low — what's the realistic commute time and amenity access for the typical tenant pool here? Any planned neighborhood developments (good or bad) we should know about?
- What's the average days-on-market for RENTAL listings here right now (not sales)? A rising rental-DOM trend means longer vacancies and softer asking-rent achievability than the comps imply.
- What's the recent tenant-quality profile in this submarket — average credit score on applications, eviction rate, late-payment / NSF rate, and stable-employment percentage? A property-management company in the area should have these aggregated.
- How much new for-sale + rental construction is in the pipeline within 1–3 miles? Heavy new supply typically softens prices + rents 12–24 months out; constrained supply supports both.
Investment metrics
- 1% rule
- 0.73% ✗
- Cap rate
- 5.29%
- Cash-on-cash
- -3.57%
- DSCR
- 0.84
- GRM
- 11.4
CMA / ARV
- ARV (on-the-fly)
- $252,504
- Comps found
- 12
Show comp detail 12 sales within ~0.75 mi
| Address | Dist | Beds/Ba | Sqft | Sold | Price | $/sf | Match |
|---|---|---|---|---|---|---|---|
| 2834 Fairhaven Dr | 0.31mi | 3/2.0 | 1,416 (-6%) | 3mo | $255,000 | $180 | 70 |
| 2609 Foxledge Dr | 0.34mi | 3/1.5 | 1,572 (+4%) | 12mo | $194,500 | $124 | 68 |
| 2630 Foxledge Dr | 0.39mi | 3/2.0 | 1,620 (+7%) | 9mo | $220,000 | $136 | 61 |
| 2392 Winding Way | 0.47mi | 3/2.0 | 1,560 (+3%) | 12mo | $262,500 | $168 | 61 |
| 2880 Fairhaven Dr | 0.56mi | 4/2.0 (+1) | 1,500 (-1%) | 8mo | $230,000 | $153 | 59 |
| 2714 Starlight Ter | 0.55mi | 3/2.0 | 1,400 (-7%) | 7mo | $290,000 | $207 | 54 |
| 2505 Waterfront Dr | 0.39mi | 3/2.5 | 1,726 (+14%) | 3mo | $535,000 | $310 | 52 |
| 1452 Waterfront Dr | 0.55mi | 3/2.0 | 1,362 (-10%) | 10mo | $228,000 | $167 | 47 |
| 2647 Highview Dr | 0.65mi | 3/1.5 | 1,700 (+12%) | 2mo | $185,000 | $109 | 47 |
| 2871 Fairhaven Dr | 0.57mi | 3/2.0 | 1,712 (+13%) | 5mo | $236,000 | $138 | 45 |
| 1066 Knollwood Dr | 0.65mi | 3/2.0 | 1,350 (-11%) | 6mo | $335,000 | $248 | 45 |
| 1147 Placid Ln | 0.72mi | 4/2.5 (+1) | 1,728 (+14%) | 4mo | $215,000 | $124 | 30 |
Match score weights: distance 35% · size 25% · config 20% · recency 20%. Top-matched comps best support the ARV.
Projected returns pro-forma
2.36% appreciation · 3.0% rent growth · sell at horizon
- IRR
- 2.2%
- Equity multiple
- 1.12×
- Total profit
- $10,078
- Equity at exit
- $123,747
- IRR
- 6.0%
- Equity multiple
- 1.85×
- Total profit
- $70,957
- Equity at exit
- $182,775
Cash invested: $83,720 (down + closing). Projections, not guarantees.
Landlord ↔ Tenant lean methodology
- Overall (STATE)
- 62 Landlord-Friendly
- State Pennsylvania
- 62 Landlord-Friendly · EVEN
- County
- — inherits STATE
- City
- — inherits STATE
ZIP-level market 18466
- Home prices YoY
- 1.2%
- Active inventory
- 355
- Price-to-rent
- 11.4×
Monthly cashflow live
- Estimated rent
- $2,180 high interval (Pro) →
- Mortgage (P&I)
- −$1,568
- Tax from tax record
- −$136 /mo · $1,631/yr
- Insurance
- −$125
- HOA
- −$143
- Vacancy / Maint / Mgmt
- −$458
- Net cashflow
- $-249
Break-even live
UW: 25.0% down · 7.5% · 30yr · 1.5% tax · 5.0% vac · 8.0% maint · 8.0% mgmt
Financing live
Cash to close
- Down payment
- $74,750
- Closing costs
- $8,970
- Reserves months
- —
- Total cash needed
- —
Loan-product check · same deal, 3 products live
Conventional
25% down · 7.5% · 30yr
- Down + closing
- —
- Monthly P&I
- —
- Monthly cashflow
- —
- DSCR
- —
- Eligible?
- —
Personal DTI + credit; lowest rate.
DSCR
20% down · 8.5% · 30yr
- Down + closing
- —
- Monthly P&I
- —
- Monthly cashflow
- —
- DSCR
- —
- Eligible?
- —
No personal income docs; deal must DSCR.
Hard money
10% down · 12.0% · 12mo
- Down + closing
- —
- Monthly P&I
- —
- Monthly cashflow
- —
- DSCR
- —
- Eligible?
- —
Short-term bridge; refi at stabilization.
Rent comps 6 comps
| Address | Beds | Baths | Sqft | Rent | $/sqft | DOM | Units | Dist |
|---|---|---|---|---|---|---|---|---|
| 1354 Winding Way Coolbaugh Township, PA | 4.0 | 3.0 | 1870 | $2,100 | $1.12 | 20d | 1 | 0.43mi |
| 1002 Knollwood Dr Tobyhanna, PA | 4.0 | 1.5 | 2088 | $2,300 | $1.10 | 13d | 1 | 1.04mi |
| 9149 Brandywine Dr Tobyhanna, PA | 4.0 | 3.0 | 1870 | $2,100 | $1.12 | 20d | 1 | 1.06mi |
| 9593 Dawn Ln Tobyhanna, PA | 4.0 | 2.5 | 1888 | $2,300 | $1.22 | 43d | 1 | 1.18mi |
| 9294 Bluebird Ct Tobyhanna, PA | 3.0 | 2.5 | 2107 | $2,150 | $1.02 | 13d | 1 | 1.18mi |
| 9026 Idlewild Dr Tobyhanna, PA | 3.0 | 2.0 | 1068 | $2,300 | $2.15 | 13d | 1 | 1.26mi |
HOA detail
- Monthly dues
- $143 · $1,716/yr
Listing history 20 events
-
2026-06-19days on market $299,000 Active 31 DOM
-
2026-06-18days on market $299,000 Active 30 DOM
-
2026-06-17days on market $299,000 Active 29 DOM
-
2026-06-16days on market $299,000 Active 28 DOM
-
2026-06-15days on market $299,000 Active 27 DOM
-
2026-06-14days on market $299,000 Active 25 DOM
-
2026-06-13days on market $299,000 Active 24 DOM
-
2026-06-10days on market $299,000 Active 22 DOM
-
2026-06-09days on market $299,000 Active 21 DOM
-
2026-06-08days on market $299,000 Active 20 DOM
-
2026-06-07days on market $299,000 Active 19 DOM
-
2026-06-02days on market $299,000 Active 14 DOM
-
2026-06-01days on market $299,000 Active 13 DOM
-
2026-05-31days on market $299,000 Active 12 DOM
-
2026-05-30days on market $299,000 Active 11 DOM
-
2026-05-19$299,000 Active
-
2026-01-30soldstatus $143,000 Closed 76-char remark
Show marketing remark (76 chars)
Investor Opportunity with Exceptional Potential in a STR-Friendly Community.
-
2026-01-07status Pending 76-char remark
Show marketing remark (76 chars)
Investor Opportunity with Exceptional Potential in a STR-Friendly Community.
-
2026-01-05soldstatus $80,000
-
2025-12-31$149,999 Active 76-char remark
Show marketing remark (76 chars)
Investor Opportunity with Exceptional Potential in a STR-Friendly Community.
ⓘ Source: listings_history table (triggers on properties + properties_extension) + one-shot
backfill from property_details.listing_events for pre-trigger history.
Tax reassessment forecast PA · Partial reset (capped growth)
- Current annual tax
- $1,631 · $136/mo
- Projected year-2 tax
- $3,177 · $265/mo
- Expected delta
- +$1,547/yr (+$129/mo · 94.8%)
ⓘ Screening estimate from a state-policy table — verify with the county assessor before closing.
Climate risk First Street
- Flood 1/10 Low FEMA zone X (unshaded) · 0% chance over 30 yrs
- Wildfire 3/10 Moderate
- Heat 1/10 Low 7 d/yr ≥90°F today · 15 d/yr by 30 yrs out
- Wind 4/10 Moderate 7% chance of damaging wind over 30 yrs
- Air quality 2/10 Low 1 unhealthy d/yr today · 2 by 30 yrs out
Nearby sold comps map
Loading sold comps map…
Walkable amenities ~0.75 mi
Loading nearby amenities…
Taxation est. · year 1
- Rental income
- $26,164
- − Mortgage interest
- −$16,749
- − Property taxes
- −$1,631
- − Insurance
- −$1,495
- − Repairs & maintenance
- −$2,093
- − Management
- −$2,093
- − HOA
- −$1,716
- − Depreciation
- −$8,698
- Taxable loss
- −$8,311
- Est. tax savings @ 24.0%
- +$1,995
- After-tax cash flow
- $-994/yr
For passive investors: Depreciation is non-cash, so a rental often shows a tax loss while cash-flowing — sheltering income. Rental losses are passive: they offset passive income freely, and up to $25,000/yr can offset ordinary (W-2) income if you actively participate and your MAGI is under $100k (phasing out to $0 by $150k); unused losses carry forward. On sale, claimed depreciation is recaptured at up to 25%, and gains may owe capital-gains tax (a 1031 exchange can defer both). Figures are a year-1 estimate at your 24.0% rate — not tax advice; consult a CPA.
Schools (NCES district)
- District
- Pocono Mountain SD
- NCES district ID
- 4219500
- Math proficiency
- 37% ▼ -5.00%
- Reading proficiency
- 55% ▲ 1.00%
- Median HH income
- $55,317
- Composite
- 39.91/100
- National rank
- #3856
- State rank
- #245 of 539 in PA
Livability — Pocono Springs
- Score
- 73/100
- State rank
- #560
- US rank
- #5263
Category grades
Schools grade is shown separately in the Schools card above.
Census & demographics
- Population (ZIP)
- 17,997
Population outlook (Monroe County) Hauer SSP2
- Today (2025)
- 164,099 people
- By 2030
- 161,412 · -1.6%
- By 2040
- 154,616 · -5.8%
- By 2050
- 146,710 · -10.6%
- By 2075
- 140,830 · -14.2%
- By 2100
- 138,472 · -15.6%
Race, ethnicity, and origin ACS 2023
- Neighborhood character
- Highly diverse neighborhood (Simpson 0.72)
- Race & ethnicity
- White 38% Hispanic / Latino 27% Black 24% Two or more races 17% Asian 4%
- Hispanic origin (detail)
- Puerto Rican 12% Dominican 6%
- Common ancestry
- Romanian 2% Portuguese 1% German 1%
- Foreign-born
- 16% · Canada
- Languages at home
- 77% English-only · Spanish 17% Other Indo-European 2% Russian/Polish/Slavic 1%
Political lean MEDSL · Monroe
- 2024 margin
- Toss-up / Even · D 49.1% · R 49.9%
- 2008→2024 swing
- -17.1pp toward R · 2008: 16.3pp · 2024: -0.8pp
- All cycles
- 2024: R+0.8 2020: D+6.4 2016: D+0.3 2012: D+14.0 2008: D+16.3
Not yet ingested
- Civics
- —
Market trends
- HPI YoY
- ▲ 2.36%
- Current HPI
- 202.4134
- Rent YoY
- —
- Metro
- —
- State GDP YoY
- ▲ 1.68%
- F500 in state
- 34
Industry mix (Fortune 500 HQ in PA)
| Industry | F500 HQs | Revenue |
|---|---|---|
| Healthcare | 2 | $309B |
|
||
| Insurance | 2 | $27B |
|
||
| Telecommunications / Media | 1 | $124B |
|
||
| Industrial Distribution | 1 | $22B |
|
||
| Financial Services | 1 | $20B |
|
||
| Chemicals / Materials | 1 | $18B |
|
||
Price history
+99.3% since first listed5 events — show timeline
- 2026-05-19 Listed $299,000 PMAR
- 2026-01-30 Sold (MLS) $143,000 PMAR
- 2026-01-07 Pending — PMAR
- 2026-01-05 Sold (Public Records) $80,000 Public Records
- 2025-12-31 Listed $149,999 PMAR
Property tax history
-6.7%/yrLatest (2026): $1,631 · +3.2% YoY. Source: county tax records.
Cash-flow waterfall
monthlySold comps — $/sqft
last 12 mo · ≤1 miLoading sold comps…