9961 Morning Meadowlark Trl · Ruskin, FL
Flood risk No data
- FEMA flood zone
- —
- Chance of flooding over 30 yrs
- —
- Est. flood insurance / yr
- —
Fire risk No data
- Est. fire insurance / yr
- —
Heat risk No data
- Hot days now (above threshold)
- —
- Hot days in 30 yrs
- —
Wind risk No data
- Chance of severe wind over 30 yrs
- —
Air-quality risk No data
- Unhealthy air days now
- —
- Unhealthy air days in 30 yrs
- —
Risk factors via First Street. Map © Google.
Why this score? — see what drove the D- grade
The composite is a weighted blend of 9 inputs, each scored 0–100. Each bar is that input's sub-score; the figure is the points it added to the 100-point composite (weight × sub-score).
- Cash flow +11.4/30.0
- ARV discount +8.6/15.0
- Schools +4.4/10.0
- Livability +3.6/5.0
- 1% rule +3.3/10.0
- DSCR +3.3/10.0
- Condition / age +2.5/5.0
- Rent growth +2.3/5.0
- Appreciation +0.0/10.0
$342,990
🖨 Deal sheet (PDF) 📄 Offer letter ✓ Due diligence
Listing remarks
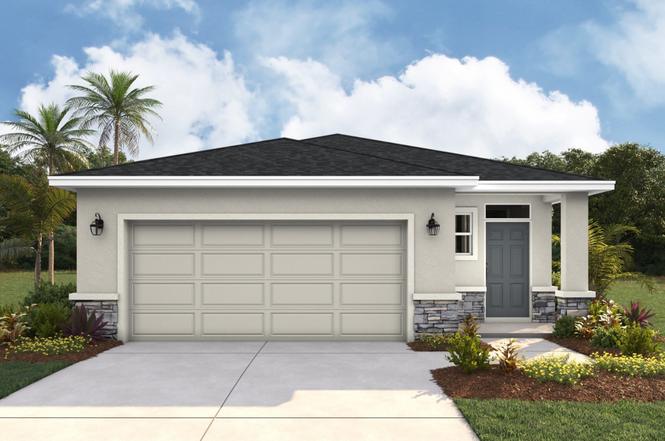
A front porch welcomes to you into one-story all concrete block construction home. Designed to optimizes living space with an open concept kitchen that overlooks the versatile great room and large covered lanai. The well-appointed kitchen features an island with bar seating, oversized walk-in pantry and sleek stainless-steel appliances! Bedroom one is located behind the kitchen and has an ensuite bathroom with double vanity and spacious walk-in closet providing substantial storage space. A second bedroom and bath are located at the rear of the home. Just off the great room is the versatile fourth bedroom, perfect to meet your needs. Like all D. R. Horton homes, the Harper includes a Home is
Key facts
- Open concept kitchen
- Front porch
- One-story
Tags
Property features AI
Finance
- Financial info: List price $334,000
Exterior
- Parking: 2-car garage; 2 total parking spaces
- Home design: Single-family residence; Harper plan
- Exterior features: Living area approximately 1665
Interior
- Bedrooms: 4 bedrooms
- Bathrooms: 2 full bathrooms
- Interior features: Spec home (Harper plan)
Neighborhood map
What this means for you Summary
Snapshot
- This is a 4-bed/2.0-bath single-family listed at $343k.
Deal economics
- At list price, monthly cash flow is $-122 ($-1k/yr) — negative.
- To cash-flow at today's rent, offer at most $325k (5.2% below list).
- To meet the 1% rule (rent ≥ 1% of price), the offer needs to be $285k (17.0% below list).
- Recommended offer: $285k (17.0% below list) — sets the bar for 1% rule.
- Cap rate 5.9% vs local median 4.7% in Ruskin — meaningfully above typical; check what's discounted (condition, days-on-market, listing class) to confirm the premium yield is real.
Location & tenants
- Location reads 71/100 on livability (#392 in FL) — a middle-class / working-renter tenant base. Strengths: cost of living A+, housing A+, commute B+; Watch: schools F, amenities F, health & safety F.
- Manatee (suburban): math 54% / reading 50% proficiency, ranked #26 of 73 in FL (top 36%) — acceptable for families but not a draw, mixed tenant base, ~2y average lease.
- Market conditions: Rents soft (-0.9%/yr); 2170 active listings in the ZIP; 17 comparable units currently listed for rent nearby; rentals at typical pace (median 17d on market — plan ~3-4 weeks tenant-placement turnaround); high-income renter base; 7,472 units permitted in Manatee County in 2024 (1,782 in 5+ unit buildings).
- This rent runs 30% of the median local income ($114k/yr) — at the standard rent-burdened threshold; future hikes will face affordability resistance.
Forward outlook
- Local home prices are declining (-3.0%/yr); year-one equity from $2k of loan paydown is wiped out by about $10k of value loss. Plan a longer hold.
- Manatee County population projected at +43% by 2050 — long-run rental-demand tailwind backs the buy-and-hold thesis.
Negotiation context
- It's been on market 166 days — a 12% lower offer ($302k) is reasonable based on typical stale-listing flexibility.
Questions for the listing agent
- What do current leases actually rent for vs. the listed asking? Can we see a recent rent roll and the last 12 months of T-12 income?
- It's been on market 166 days. Have you received any prior offers? Is the seller open to a 17% concession, seller financing, or rate buy-down credit?
- Why hasn't it sold? Are there any deal-killer items the seller is aware of (foundation, flood, title, zoning, code violations)?
- Is there a deadline driving the sale (1031 exchange, divorce, estate, relocation)? That informs how much negotiation room exists.
- Schools are F-rated, which usually means shorter tenancies and higher turnover. Who's the typical renter profile here, and what's been the actual vacancy rate?
- The area grade is low — what's the realistic commute time and amenity access for the typical tenant pool here? Any planned neighborhood developments (good or bad) we should know about?
- What's the average days-on-market for RENTAL listings here right now (not sales)? A rising rental-DOM trend means longer vacancies and softer asking-rent achievability than the comps imply.
- What's the recent tenant-quality profile in this submarket — average credit score on applications, eviction rate, late-payment / NSF rate, and stable-employment percentage? A property-management company in the area should have these aggregated.
- How much new for-sale + rental construction is in the pipeline within 1–3 miles? Heavy new supply typically softens prices + rents 12–24 months out; constrained supply supports both.
Investment metrics
- 1% rule
- 0.83% ✗
- Cap rate
- 5.87%
- Cash-on-cash
- -1.53%
- DSCR
- 0.93
- GRM
- 10.0
CMA / ARV
- ARV (on-the-fly)
- $351,315
- Comps found
- 12
Show comp detail 12 sales within ~0.75 mi
| Address | Dist | Beds/Ba | Sqft | Sold | Price | $/sf | Match |
|---|---|---|---|---|---|---|---|
| 9981 Morning Meadowlark Trl | 0.05mi | 4/2.0 | 1,665 (0%) | 3mo | $316,500 | $190 | 96 |
| 10943 Rabbit Grove Trl | 0.31mi | 3/2.0 (-1) | 1,672 (+0%) | 2mo | $333,000 | $199 | 78 |
| 10659 Monarch Wood Gln | 0.18mi | 3/2.0 (-1) | 1,504 (-10%) | 3mo | $298,595 | $199 | 68 |
| 10940 Rabbit Grove Trl | 0.34mi | 4/2.0 | 1,828 (+10%) | 1mo | $357,180 | $195 | 67 |
| 9970 Trellis Vine Way | 0.27mi | 4/2.0 | 1,850 (+11%) | 4mo | $400,740 | $217 | 66 |
| 11309 Bellewood Ter | 0.66mi | 4/2.0 | 1,607 (-4%) | 4mo | $348,678 | $217 | 60 |
| 9954 Trellis Vine Way | 0.31mi | 4/2.0 | 1,850 (+11%) | 8mo | $383,030 | $207 | 60 |
| 11324 Bellewood Ter | 0.69mi | 4/2.0 | 1,607 (-4%) | 3mo | $313,580 | $195 | 59 |
| 9577 Sandy Bluffs Cir | 0.59mi | 3/2.0 (-1) | 1,635 (-2%) | 7mo | $363,000 | $222 | 59 |
| 10176 Hidden Hammock Loop | 0.67mi | 3/2.0 (-1) | 1,709 (+3%) | 4mo | $361,000 | $211 | 56 |
| 9422 Sandy Bluffs Cir | 0.46mi | 3/2.0 (-1) | 1,511 (-9%) | 9mo | $352,708 | $233 | 51 |
| 9216 Westernwoods Ave | 0.67mi | 3/2.0 (-1) | 1,519 (-9%) | 5mo | $350,000 | $230 | 45 |
Match score weights: distance 35% · size 25% · config 20% · recency 20%. Top-matched comps best support the ARV.
Projected returns pro-forma
-3.0% appreciation · 0.0% rent growth · sell at horizon
- IRR
- -22.2%
- Equity multiple
- 0.25×
- Total profit
- $-71,654
- Equity at exit
- $51,141
- IRR
- -26.2%
- Equity multiple
- -0.09×
- Total profit
- $-104,467
- Equity at exit
- $29,656
Cash invested: $96,037 (down + closing). Projections, not guarantees.
Landlord ↔ Tenant lean methodology
- Overall (STATE)
- 87 Strongly Landlord-Friendly
- State Florida
- 87 Strongly Landlord-Friendly · R+3
- County
- — inherits STATE
- City
- — inherits STATE
ZIP-level market 34219
- Home prices YoY
- -23.7%
- Rents YoY
- -0.9%
- Active inventory
- 2170
- Price-to-rent
- 10.0×
Monthly cashflow live
- Estimated rent
- $2,846 high interval (Pro) →
- Mortgage (P&I)
- −$1,799
- Tax est. 1.5%
- −$429 /mo · $5,145/yr
- Insurance
- −$143
- HOA
- −$0
- Vacancy / Maint / Mgmt
- −$598
- Net cashflow
- $-122
Break-even live
Sensitivity live
| Price | -10% $115 | -5% $-4 | +0% $-122 | +5% $-241 | +10% $-359 |
|---|---|---|---|---|---|
| Rent | -10% $-347 | -5% $-235 | +0% $-122 | +5% $-10 | +10% $103 |
| Rate | -1.0pp $51 | -0.5pp $-35 | base $-122 | +0.5pp $-211 | +1.0pp $-301 |
UW: 25.0% down · 7.5% · 30yr · 1.5% tax · 5.0% vac · 8.0% maint · 8.0% mgmt
Financing live
Cash to close
- Down payment
- $85,748
- Closing costs
- $10,290
- Reserves months
- —
- Total cash needed
- —
Loan-product check · same deal, 3 products live
Conventional
25% down · 7.5% · 30yr
- Down + closing
- —
- Monthly P&I
- —
- Monthly cashflow
- —
- DSCR
- —
- Eligible?
- —
Personal DTI + credit; lowest rate.
DSCR
20% down · 8.5% · 30yr
- Down + closing
- —
- Monthly P&I
- —
- Monthly cashflow
- —
- DSCR
- —
- Eligible?
- —
No personal income docs; deal must DSCR.
Hard money
10% down · 12.0% · 12mo
- Down + closing
- —
- Monthly P&I
- —
- Monthly cashflow
- —
- DSCR
- —
- Eligible?
- —
Short-term bridge; refi at stabilization.
Rent comps 17 comps
| Address | Beds | Baths | Sqft | Rent | $/sqft | DOM | Units | Dist |
|---|---|---|---|---|---|---|---|---|
| 10455 Wet Marsh Cv Parrish, FL | 3.0 | 2.0 | 1635 | $2,650 | $1.62 | 11d | 1 | 0.35mi |
| 9962 Last Light Gln Parrish, FL | 4.0 | 2.0 | 1740 | $2,495 | $1.43 | 4d | 1 | 0.73mi |
| 10416 High Noon Trl Parrish, FL | 3.0 | 2.0 | 1412 | $2,400 | $1.70 | 4d | 1 | 0.78mi |
| 11454 Gallatin Trl Parrish, FL | 4.0 | 2.0 | 1635 | $2,575 | $1.57 | 17d | 1 | 0.94mi |
| 10225 Daybreak Gln Parrish, FL | 4.0 | 3.0 | 1978 | $2,600 | $1.31 | 4d | 1 | 0.95mi |
| 11512 Gallatin Trl Parrish, FL | 4.0 | 2.5 | 1929 | $3,300 | $1.71 | 24d | 1 | 0.97mi |
| 9009 Moccasin Wallow Rd Parrish, FL | 3.0–4.0 | 2.5 | 1581 | $2,304 | $1.46 | 2d | 32 | 1.03mi |
| 11880 Little River Way Parrish, FL | 4.0 | 2.0 | 1635 | $2,650 | $1.62 | 24d | 1 | 1.11mi |
| 11884 Little River Way Parrish, FL | 3.0 | 2.5 | 2142 | $3,250 | $1.52 | 17d | 1 | 1.12mi |
| 11230 82nd St E Parrish, FL | 3.0 | 2.0 | 1758 | $2,495 | $1.42 | 17d | 1 | 1.25mi |
| 11567 84th Street Cir E #105 Parrish, FL | 3.0 | 2.5 | 1420 | $1,999 | $1.41 | 4d | 1 | 1.36mi |
| 9432 Bella Mar Trl Parrish, FL | 4.0 | 2.5 | 2045 | $2,699 | $1.32 | 17d | 1 | 1.37mi |
| 10646 Hidden Banks Gln Parrish, FL | 3.0 | 2.0 | 1504 | $2,350 | $1.56 | 17d | 1 | 1.38mi |
| 8505 Bella Mar Trl Parrish, FL | 4.0 | 2.5 | 1870 | $2,750 | $1.47 | 17d | 1 | 1.39mi |
| 11522 84th Street Cir E #105 Parrish, FL | 3.0 | 2.5 | 1588 | $2,300 | $1.45 | 24d | 1 | 1.44mi |
| 11523 84th Street Cir E #105 Parrish, FL | 3.0 | 2.5 | 1588 | $1,950 | $1.23 | 4d | 1 | 1.45mi |
| 9224 Bonita Mar Dr Parrish, FL | 3.0 | 2.5 | 1799 | $2,290 | $1.27 | 24d | 1 | 1.49mi |
Listing history 15 events
-
2026-06-18days on market $342,990 Active 166 DOM
-
2026-06-17price $342,990 Active 165 DOM
-
2026-06-17days on market $334,000 Active 165 DOM
-
2026-06-16days on market $334,000 Active 164 DOM
-
2026-06-15days on market $334,000 Active 163 DOM
-
2026-06-13days on market $334,000 Active 161 DOM
-
2026-06-13days on market $334,000 Active 160 DOM
-
2026-06-10days on market $334,000 Active 158 DOM
-
2026-06-09days on market $334,000 Active 157 DOM
-
2026-06-08days on market $334,000 Active 156 DOM
-
2026-06-08days on market $334,000 Active 155 DOM
-
2026-06-03days on market $334,000 Active 151 DOM
-
2026-06-02days on market $334,000 Active 150 DOM
-
2026-06-01days on market $334,000 Active 149 DOM
-
2026-05-31days on market $334,000 Active 148 DOM
ⓘ Source: listings_history table (triggers on properties + properties_extension) + one-shot
backfill from property_details.listing_events for pre-trigger history.
Nearby sold comps map
Loading sold comps map…
Walkable amenities ~0.75 mi
Loading nearby amenities…
Taxation est. · year 1
- Rental income
- $34,150
- − Mortgage interest
- −$19,213
- − Property taxes
- −$5,145
- − Insurance
- −$1,715
- − Repairs & maintenance
- −$2,732
- − Management
- −$2,732
- − Depreciation
- −$9,978
- Taxable loss
- −$7,364
- Est. tax savings @ 24.0%
- +$1,767
- After-tax cash flow
- $302/yr
For passive investors: Depreciation is non-cash, so a rental often shows a tax loss while cash-flowing — sheltering income. Rental losses are passive: they offset passive income freely, and up to $25,000/yr can offset ordinary (W-2) income if you actively participate and your MAGI is under $100k (phasing out to $0 by $150k); unused losses carry forward. On sale, claimed depreciation is recaptured at up to 25%, and gains may owe capital-gains tax (a 1031 exchange can defer both). Figures are a year-1 estimate at your 24.0% rate — not tax advice; consult a CPA.
Schools (NCES district)
- District
- Manatee
- NCES district ID
- 1201230
- Math proficiency
- 54% ▼ -6.00%
- Reading proficiency
- 50% ▼ -2.00%
- Median HH income
- $49,607
- Composite
- 44.43/100
- National rank
- #2806
- State rank
- #26 of 73 in FL
Livability — Ruskin
- Score
- 71/100
- State rank
- #392
- US rank
- #6879
Category grades
Schools grade is shown separately in the Schools card above.
Census & demographics
- County
- Manatee County · 416,364 people
- City population
- 52,177
- Metro
- North Port-Sarasota-Bradenton, FL
- Population (ZIP)
- 33,296
- Household income
- $113,773
- Rent vs Own
- Severe rent burden
- 219.0
Population outlook (Manatee County) Hauer SSP2
- Today (2025)
- 447,342 people
- By 2030
- 488,911 · +9.3%
- By 2040
- 567,934 · +27.0%
- By 2050
- 637,995 · +42.6%
- By 2075
- 781,970 · +74.8%
- By 2100
- 848,272 · +89.6%
Race, ethnicity, and origin ACS 2023
- Neighborhood character
- Predominantly White (75%)
- Race & ethnicity
- White 75% Hispanic / Latino 11% Two or more races 8% Black 8% Asian 2%
- Hispanic origin (detail)
- Mexican 2% Puerto Rican 3%
- Common ancestry
- Romanian 4% Hispanic 2% Russian 2%
- Foreign-born
- 10% · Canada, Dominican Republic, Jamaica
- Languages at home
- 88% English-only · Spanish 7% French/Haitian/Cajun 2% Other Asian/Pacific 1%
Political lean MEDSL · Manatee
- 2024 margin
- Strong R (+23.5) · D 37.9% · R 61.4%
- 2008→2024 swing
- -16.5pp toward R · 2008: -7.0pp · 2024: -23.5pp
- All cycles
- 2024: R+23.5 2020: R+16.1 2016: R+17.1 2012: R+12.5 2008: R+7.0
Not yet ingested
- Civics
- —
Market trends
- HPI YoY
- ▼ -84.45%
- Current HPI
- 271.7131
- Rent YoY
- ▼ -0.95%
- Metro
- North Port-Sarasota-Bradenton, FL
- State GDP YoY
- ▲ 3.28%
- F500 in state
- 36
Industry mix (Fortune 500 HQ in FL)
| Industry | F500 HQs | Revenue |
|---|---|---|
| Industrial Technology | 2 | $29B |
|
||
| Insurance | 2 | $17B |
|
||
| Retail | 1 | $60B |
|
||
| Technology Distribution | 1 | $58B |
|
||
| Homebuilding | 1 | $35B |
|
||
| Technology Manufacturing | 1 | $35B |
|
||
Cash-flow waterfall
monthlySold comps — $/sqft
last 12 mo · ≤1 miLoading sold comps…