512 Elm St · Clinton, KY
Flood risk 4/10 · Minor
- FEMA flood zone
- X (unshaded)
- Chance of flooding over 30 yrs
- 0.2%
- Est. flood insurance / yr
- $507 – $1,088
Fire risk 1/10 · Minimal
- Est. fire insurance / yr
- $839 – $1,559
Heat risk 6/10 · Moderate
- Hot days now (above 108°F)
- 7 days/yr
- Hot days in 30 yrs
- 21 days/yr
Wind risk 4/10 · Minor
- Chance of severe wind over 30 yrs
- 8.0%
Air-quality risk 1/10 · Minimal
- Unhealthy air days now
- 0 days/yr
- Unhealthy air days in 30 yrs
- 0 days/yr
Risk factors via First Street. Map © Google.
Why this score? — see what drove the C- grade
The composite is a weighted blend of 9 inputs, each scored 0–100. Each bar is that input's sub-score; the figure is the points it added to the 100-point composite (weight × sub-score).
- Cash flow +23.2/30.0
- DSCR +7.5/10.0
- 1% rule +4.8/10.0
- Schools +3.7/10.0
- Appreciation +3.3/10.0
- Livability +3.1/5.0
- Rent growth +2.5/5.0
- Condition / age +2.5/5.0
- ARV discount +0.0/15.0
$89,000
🖨 Deal sheet 📄 Offer letter ✓ Due diligence
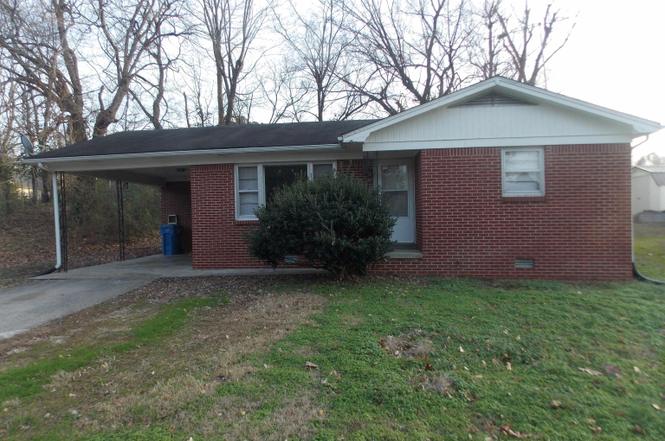
Listing remarks
This cute 2-bedroom 1 bath house has an attached one car carport. The kitchen has plenty of cabinets above and below the counters. The utility room has washer and dryer hook ups and a gas hot water tank. The living room has new carpet. The bedrooms have hardwood floors, and the interior walls have new paint Kitchen has new laminate floors. The house is near the schools.
Key facts
- New carpet
- Plenty of cabinets
- Gas hot water tank
Tags
Property features AI
Exterior
- Parking: Attached garage; 1-space carport
- Utilities: Public water; Public sewer
- Home design: Single-family residence; Residential property; Single-story
- Construction: Frame construction; Composition roof
- Exterior features: Covered patio/porch; Storm doors; Rolling slope lot
Interior
- Kitchen: Cooktop; Gas water heater
- Flooring: Carpet; Laminate
- Bathrooms: 1 full bathroom
- Heating & cooling: Natural gas heating; Window unit cooling
- Interior features: Storm windows; Crawl space basement
Neighborhood map
What this means for you Summary
Snapshot
- This is a 2-bed/1.0-bath single-family listed at $89k.
Deal economics
- At list price, monthly cash flow is $162 ($2k/yr) — positive.
- The deal already cash-flows at list — no discount required.
- To meet the 1% rule (rent ≥ 1% of price), the offer needs to be $87k (2.3% below list).
- Recommended offer: $78k (12.0% below list) — sets the bar for market timing.
Location & tenants
- Location reads 61/100 on livability (#369 in KY) — a middle-class / working-renter tenant base. Strengths: crime A+, cost of living A+, housing A+; Watch: amenities F, commute F, employment F.
- Hickman County (rural): math 41% / reading 49% proficiency, ranked #24 of 165 in KY (top 14%) — families likely to look elsewhere, expect single-tenant / working-renter base with shorter leases.
- Zoned schools: Hickman County Elementary School (math 42% / reading 47%, grade F, #148 of 676 statewide, top 24%, 421 students, 58% FRL); Hickman County High School (math 37% / reading 47%, grade F, #32 of 254 statewide, top 13%, 302 students, 57% FRL).
- Market conditions: 22 active listings in the ZIP.
Forward outlook
- Local home prices are declining (-3.0%/yr); year-one equity from $615 of loan paydown is wiped out by about $3k of value loss. Plan a longer hold.
- Hickman County population projected at -29% by 2050 — secular population decline; favor cash flow + early exit over multi-decade hold.
Negotiation context
- It's been on market 165 days — a 12% lower offer ($78k) is reasonable based on typical stale-listing flexibility.
Risks & watch-outs
- Climate carrying-cost: extreme-heat days projected 7→21/yr by 2055 (HVAC capex compounding) — expect insurance premiums to compound above CPI over the hold.
Questions for the listing agent
- It's been on market 165 days. Have you received any prior offers? Is the seller open to a 12% concession, seller financing, or rate buy-down credit?
- Built in 1968 — when were the roof, HVAC, electrical panel, plumbing, and water heater last replaced?
- Why hasn't it sold? Are there any deal-killer items the seller is aware of (foundation, flood, title, zoning, code violations)?
- Is there a deadline driving the sale (1031 exchange, divorce, estate, relocation)? That informs how much negotiation room exists.
- Schools are D-rated, which usually means shorter tenancies and higher turnover. Who's the typical renter profile here, and what's been the actual vacancy rate?
- What's the average days-on-market for RENTAL listings here right now (not sales)? A rising rental-DOM trend means longer vacancies and softer asking-rent achievability than the comps imply.
- What's the recent tenant-quality profile in this submarket — average credit score on applications, eviction rate, late-payment / NSF rate, and stable-employment percentage? A property-management company in the area should have these aggregated.
- How much new for-sale + rental construction is in the pipeline within 1–3 miles? Heavy new supply typically softens prices + rents 12–24 months out; constrained supply supports both.
Investment metrics
- 1% rule
- 0.98% ✗
- Cap rate
- 8.47%
- Cash-on-cash
- 7.78%
- DSCR
- 1.35
- GRM
- 8.5
CMA / ARV
- ARV (on-the-fly)
- $64,260
- Comps found
- 3
Show comp detail 3 sales within ~0.75 mi
| Address | Dist | Beds/Ba | Sqft | Sold | Price | $/sf | Match |
|---|---|---|---|---|---|---|---|
| 512 Elm St | 0.00mi | 2/1.0 | 918 (0%) | 1mo | $89,000 | $97 | 99 |
| 413 Mayfield Highway Rd | 0.16mi | 1/1.0 (-1) | 927 (+1%) | 12mo | $65,000 | $70 | 76 |
| 513 Mayfield Rd | 0.25mi | 2/1.0 | 960 (+5%) | 10mo | $47,000 | $49 | 72 |
Match score weights: distance 35% · size 25% · config 20% · recency 20%. Top-matched comps best support the ARV.
Projected returns pro-forma
-3.0% appreciation · 3.0% rent growth · sell at horizon
- IRR
- -4.5%
- Equity multiple
- 0.83×
- Total profit
- $-4,169
- Equity at exit
- $13,270
- IRR
- 5.2%
- Equity multiple
- 1.38×
- Total profit
- $9,456
- Equity at exit
- $7,695
Cash invested: $24,920 (down + closing). Projections, not guarantees.
Landlord ↔ Tenant lean methodology
- Overall (STATE)
- 83 Strongly Landlord-Friendly
- State Kentucky
- 83 Strongly Landlord-Friendly · R+16
- County
- — inherits STATE
- City
- — inherits STATE
ZIP-level market 42031
- Home prices YoY
- -1.3%
- Active inventory
- 22
- Price-to-rent
- 8.5×
Monthly cashflow live
- Estimated rent
- $869 medium interval (Pro) →
- Mortgage (P&I)
- −$467
- Tax from tax record
- −$21 /mo · $257/yr
- Insurance
- −$37
- HOA
- −$0
- Vacancy / Maint / Mgmt
- −$183
- Net cashflow
- $162
Break-even live
UW: 25.0% down · 7.5% · 30yr · 1.5% tax · 5.0% vac · 8.0% maint · 8.0% mgmt
Financing live
Cash to close
- Down payment
- $22,250
- Closing costs
- $2,670
- Reserves months
- —
- Total cash needed
- —
Loan-product check · same deal, 3 products live
Conventional
25% down · 7.5% · 30yr
- Down + closing
- —
- Monthly P&I
- —
- Monthly cashflow
- —
- DSCR
- —
- Eligible?
- —
Personal DTI + credit; lowest rate.
DSCR
20% down · 8.5% · 30yr
- Down + closing
- —
- Monthly P&I
- —
- Monthly cashflow
- —
- DSCR
- —
- Eligible?
- —
No personal income docs; deal must DSCR.
Hard money
10% down · 12.0% · 12mo
- Down + closing
- —
- Monthly P&I
- —
- Monthly cashflow
- —
- DSCR
- —
- Eligible?
- —
Short-term bridge; refi at stabilization.
Listing history 2 events
-
2026-02-16price $89,000
-
2025-12-13$95,000 Active
ⓘ Source: listings_history table (triggers on properties + properties_extension) + one-shot
backfill from property_details.listing_events for pre-trigger history.
Tax reassessment forecast KY · Resets to sale price
- Current annual tax
- $257 · $21/mo
- Projected year-2 tax
- $765 · $64/mo
- Expected delta
- +$508/yr (+$42/mo · 197.9%)
ⓘ Screening estimate from a state-policy table — verify with the county assessor before closing.
Climate risk First Street
- Flood 4/10 Moderate FEMA zone X (unshaded) · 20% chance over 30 yrs
- Wildfire 1/10 Low
- Heat 6/10 Major 7 d/yr ≥108°F today · 21 d/yr by 30 yrs out
- Wind 4/10 Moderate 8% chance of damaging wind over 30 yrs
- Air quality 1/10 Low 0 unhealthy d/yr today · 0 by 30 yrs out
Nearby sold comps map
Loading sold comps map…
Walkable amenities ~0.75 mi
Loading nearby amenities…
Taxation est. · year 1
- Rental income
- $10,433
- − Mortgage interest
- −$4,985
- − Property taxes
- −$257
- − Insurance
- −$445
- − Repairs & maintenance
- −$835
- − Management
- −$835
- − Depreciation
- −$2,589
- Taxable income
- $488
- Est. tax owed @ 24.0%
- −$117
- After-tax cash flow
- $1,823/yr
For passive investors: Depreciation is non-cash, so a rental often shows a tax loss while cash-flowing — sheltering income. Rental losses are passive: they offset passive income freely, and up to $25,000/yr can offset ordinary (W-2) income if you actively participate and your MAGI is under $100k (phasing out to $0 by $150k); unused losses carry forward. On sale, claimed depreciation is recaptured at up to 25%, and gains may owe capital-gains tax (a 1031 exchange can defer both). Figures are a year-1 estimate at your 24.0% rate — not tax advice; consult a CPA.
Schools (NCES district)
- District
- Hickman County
- NCES district ID
- 2102790
- Math proficiency
- 41% ▼ -10.00%
- Reading proficiency
- 49% ▼ -5.00%
- Median HH income
- $37,542
- Composite
- 37.42/100
- National rank
- #4421
- State rank
- #24 of 165 in KY
Livability — Clinton
- Score
- 61/100
- State rank
- #369
- US rank
- #17542
Category grades
Schools grade is shown separately in the Schools card above.
Census & demographics
- Census place
- Clinton, KY
- Population (ZIP)
- 3,388
Population outlook (Hickman County) Hauer SSP2
- Today (2025)
- 4,255 people
- By 2030
- 4,018 · -5.6%
- By 2040
- 3,511 · -17.5%
- By 2050
- 3,026 · -28.9%
- By 2075
- 2,090 · -50.9%
- By 2100
- 1,322 · -68.9%
Race, ethnicity, and origin ACS 2023
- Neighborhood character
- Predominantly White (84%)
- Race & ethnicity
- White 84% Black 12% Two or more races 3%
- Common ancestry
- Lithuanian 1% Scottish 1% Slovak 1%
- Foreign-born
- 0%
- Languages at home
- 99% English-only · Spanish 1%
Political lean MEDSL · Hickman
- 2024 margin
- Solid R (+61.0) · D 19.0% · R 80.0%
- 2008→2024 swing
- -34.6pp toward R · 2008: -26.4pp · 2024: -61.0pp
- All cycles
- 2024: R+61.0 2020: R+57.1 2016: R+56.0 2012: R+34.8 2008: R+26.4
Not yet ingested
- Civics
- —
Market trends
- HPI YoY
- ▼ -3.41%
- Current HPI
- 260.197
- Rent YoY
- —
- Metro
- —
- State GDP YoY
- ▲ 1.81%
- F500 in state
- 4
Industry mix (Fortune 500 HQ in KY)
| Industry | F500 HQs | Revenue |
|---|---|---|
| Healthcare | 1 | $118B |
|
||
| Food / Beverage | 1 | $7B |
|
||
Price history
-6.3% since first listed2 events — show timeline
- 2026-02-16 Price Changed $89,000 WKRMLS
- 2025-12-13 Listed $95,000 WKRMLS
Property tax history
-1.4%/yrLatest (2025): $257 · +9.4% YoY. Source: county tax records.
Cash-flow waterfall
monthlySold comps — $/sqft
last 12 mo · ≤1 miLoading sold comps…