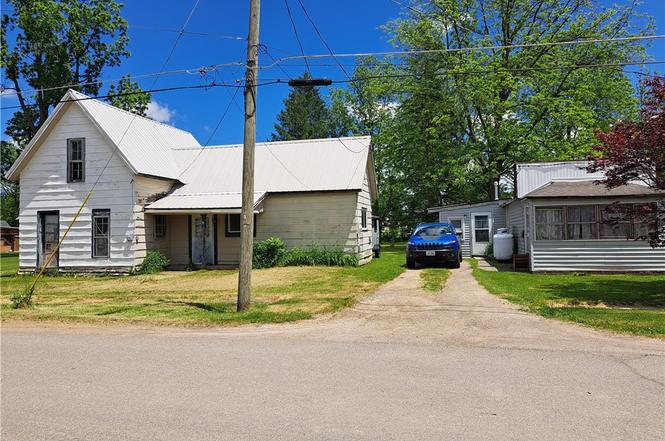
16-18 River St · Canaseraga, NY
Flood risk 1/10 · Minimal
- FEMA flood zone
- A
- Chance of flooding over 30 yrs
- 0.0%
- Est. flood insurance / yr
- $1,009 – $1,996
Fire risk 2/10 · Minimal
- Est. fire insurance / yr
- $691 – $1,283
Heat risk 2/10 · Minimal
- Hot days now (above 91°F)
- 7 days/yr
- Hot days in 30 yrs
- 17 days/yr
Wind risk 1/10 · Minimal
- Chance of severe wind over 30 yrs
- —
Air-quality risk 1/10 · Minimal
- Unhealthy air days now
- 0 days/yr
- Unhealthy air days in 30 yrs
- 0 days/yr
Risk factors via First Street. Map © Google.
Why this score? — see what drove the B+ grade
The composite is a weighted blend of 9 inputs, each scored 0–100. Each bar is that input's sub-score; the figure is the points it added to the 100-point composite (weight × sub-score).
- Cash flow +30.0/30.0
- 1% rule +10.0/10.0
- DSCR +10.0/10.0
- Appreciation +9.5/10.0
- ARV discount +7.5/15.0
- Schools +4.6/10.0
- Livability +3.1/5.0
- Rent growth +2.5/5.0
- Condition / age +2.5/5.0
$69,900
🖨 Deal sheet 📄 Offer letter ✓ Due diligence
Listing remarks
Great investment opportunity! This unique property features two homes on one lot, offering excellent potential for owner-occupants, investors, or multi-generational living. The primary home offers 3 bedrooms and 1 bathroom and is ready for your updates and improvements. The second home features 1 bedroom and 1 bathroom and is currently tenant-occupied, providing immediate rental income. Live in one home while renting the other, or add both units to your investment portfolio. Property is being sold 'as-is'
Key facts
- 0.43 acre lot
- 2 parking spots
- Built 1920
Property features AI
Finance
- Other: Two total residential units; Two separate gas meters; Two separate electric meters; Lot is approximately 0.43 acres with irregular dimensions (88 x 219) and located on a city street; listed as in a flood zone
- Financial info: Owner pays water for rental units; One unit reported rent of $500 (month-to-month); Operating expenses include insurance, maintenance, and water/sewer
Exterior
- Parking: Gravel parking; Two or more parking spaces
- Utilities: Public water connected; Sewer connected
- Home design: Single-story building; Resale property
- Construction: Composite siding; Vinyl siding; Asphalt and metal roofing; Slab foundation; Existing (previously built) structure
- Exterior features: Owned and leased propane tanks; Covered porch
Interior
- Kitchen: Eat-in kitchens in both units
- Bedrooms: One unit with 3 bedrooms; One unit with 1 bedroom
- Flooring: Laminate; Vinyl; Varies
- Bathrooms: Two full bathrooms total (each unit has 1 full bath)
- Heating & cooling: Forced air heating; Propane heating
- Interior features: Crawl space basement; Varied flooring including laminate and vinyl
- Laundry & utility: Electric water heater; Propane water heater
Neighborhood map
What this means for you Summary
Snapshot
- This is a 2-bed/1.0-bath other listed at $70k.
Deal economics
- At list price, monthly cash flow is $325 ($4k/yr) — positive.
- The deal already cash-flows at list — no discount required.
- Meets the 1% rule at list price ($1k rent vs $70k).
Location & tenants
- Location reads 61/100 on livability (#937 in NY) — a middle-class / working-renter tenant base. Strengths: cost of living A+, housing A+; Watch: health & safety D, crime F, amenities F.
- Canaseraga Central School District (rural): math 60% / reading 45% proficiency, ranked #430 of 755 in NY (top 57%) — acceptable for families but not a draw, mixed tenant base, ~2y average lease.
- Market conditions: 13 active listings in the ZIP; 87 units permitted in Allegany County in 2024 (0 in 5+ unit buildings).
Forward outlook
- In year one you build about $7k of equity ($483 loan paydown + $6k appreciation (8.9% local appreciation)).
- Allegany County population projected at -26% by 2050 — secular population decline; favor cash flow + early exit over multi-decade hold.
- At projected returns (8.9% appreciation + 3.0% rent growth), your $20k cash investment doubles in ~2 years — after that, you're playing with house money.
- By year 5, paydown + projected appreciation supports a ~$31k cash-out refi (75% LTV) — recoverable capital for the next deal without selling this one.
Negotiation context
- Only 1 days on market — expect competitive offers; lowballing is unlikely to land.
- Current owner paid $12k; list at $70k implies a 482% gain — meaningful room to come down on a strong offer.
Risks & watch-outs
- Watch-outs: property tax is 3.3% of price; flood insurance adds $125/mo; built in 1920 — expect roof / HVAC / electrical / plumbing capex.
- Climate carrying-cost: in FEMA flood zone A (mandatory federal flood insurance) — expect insurance premiums to compound above CPI over the hold.
Questions for the listing agent
- Built in 1920 — when were the roof, HVAC, electrical panel, plumbing, and water heater last replaced?
- Property tax is high relative to price — has the assessment been appealed recently, and will the sale trigger a re-assessment?
- What's the actual annual flood-insurance premium (NFIP or private), and is the property in a SFHA with mandatory coverage?
- Is there a deadline driving the sale (1031 exchange, divorce, estate, relocation)? That informs how much negotiation room exists.
- Crime grade is F in this area — have there been break-ins, vandalism, or insurance claims at this property in the last 3 years? What carrier currently insures it and at what premium?
- What's the average days-on-market for RENTAL listings here right now (not sales)? A rising rental-DOM trend means longer vacancies and softer asking-rent achievability than the comps imply.
- What's the recent tenant-quality profile in this submarket — average credit score on applications, eviction rate, late-payment / NSF rate, and stable-employment percentage? A property-management company in the area should have these aggregated.
- How much new for-sale + rental construction is in the pipeline within 1–3 miles? Heavy new supply typically softens prices + rents 12–24 months out; constrained supply supports both.
Investment metrics
- 1% rule
- 1.88% ✓
- Cap rate
- 14.02%
- Cash-on-cash
- 27.61%
- DSCR
- 2.23
- GRM
- 4.4
CMA / ARV
No comps found within radius.
Projected returns pro-forma
8.95% appreciation · 3.0% rent growth · sell at horizon
- IRR
- 37.4%
- Equity multiple
- 3.76×
- Total profit
- $53,986
- Equity at exit
- $57,707
- IRR
- 32.8%
- Equity multiple
- 8.26×
- Total profit
- $142,029
- Equity at exit
- $119,240
Cash invested: $19,572 (down + closing). Projections, not guarantees.
Landlord ↔ Tenant lean methodology
- Overall (STATE)
- 15 Strongly Tenant-Friendly
- State New York
- 15 Strongly Tenant-Friendly · D+10
- County
- — inherits STATE
- City
- — inherits STATE
ZIP-level market 14822
- Home prices YoY
- 3.6%
- Active inventory
- 13
- Price-to-rent
- 4.4×
Monthly cashflow live
- Estimated rent
- $1,317 medium interval (Pro) →
- Mortgage (P&I)
- −$367
- Tax from tax record
- −$195 /mo · $2,334/yr
- Insurance
- −$29
- Flood insurance flood zone
- −$125 /mo · $1,502/yr
- HOA
- −$0
- Vacancy / Maint / Mgmt
- −$277
- Net cashflow
- $325
Break-even live
UW: 25.0% down · 7.5% · 30yr · 1.5% tax · 5.0% vac · 8.0% maint · 8.0% mgmt
Financing live
Cash to close
- Down payment
- $17,475
- Closing costs
- $2,097
- Reserves months
- —
- Total cash needed
- —
Loan-product check · same deal, 3 products live
Conventional
25% down · 7.5% · 30yr
- Down + closing
- —
- Monthly P&I
- —
- Monthly cashflow
- —
- DSCR
- —
- Eligible?
- —
Personal DTI + credit; lowest rate.
DSCR
20% down · 8.5% · 30yr
- Down + closing
- —
- Monthly P&I
- —
- Monthly cashflow
- —
- DSCR
- —
- Eligible?
- —
No personal income docs; deal must DSCR.
Hard money
10% down · 12.0% · 12mo
- Down + closing
- —
- Monthly P&I
- —
- Monthly cashflow
- —
- DSCR
- —
- Eligible?
- —
Short-term bridge; refi at stabilization.
Listing history 2 events
-
2026-06-18remarks 510-char remark
-
2026-06-18$69,900 Active 1 DOM
ⓘ Source: listings_history table (triggers on properties + properties_extension) + one-shot
backfill from property_details.listing_events for pre-trigger history.
Tax reassessment forecast NY · Partial reset (capped growth)
- Current annual tax
- $2,334 · $195/mo
- Projected year-2 tax
- $2,334 · $195/mo
- Expected delta
- $0/yr ($0/mo · 0.0%)
ⓘ Screening estimate from a state-policy table — verify with the county assessor before closing.
Climate risk First Street
- Flood 1/10 Low FEMA zone A · 0% chance over 30 yrs
- Wildfire 2/10 Low
- Heat 2/10 Low 7 d/yr ≥91°F today · 17 d/yr by 30 yrs out
- Wind 1/10 Low
- Air quality 1/10 Low 0 unhealthy d/yr today · 0 by 30 yrs out
Nearby sold comps map
Loading sold comps map…
Walkable amenities ~0.75 mi
Loading nearby amenities…
Taxation est. · year 1
- Rental income
- $15,805
- − Mortgage interest
- −$3,915
- − Property taxes
- −$2,334
- − Insurance
- −$1,852
- − Repairs & maintenance
- −$1,264
- − Management
- −$1,264
- − Depreciation
- −$2,033
- Taxable income
- $3,141
- Est. tax owed @ 24.0%
- −$754
- After-tax cash flow
- $3,147/yr
For passive investors: Depreciation is non-cash, so a rental often shows a tax loss while cash-flowing — sheltering income. Rental losses are passive: they offset passive income freely, and up to $25,000/yr can offset ordinary (W-2) income if you actively participate and your MAGI is under $100k (phasing out to $0 by $150k); unused losses carry forward. On sale, claimed depreciation is recaptured at up to 25%, and gains may owe capital-gains tax (a 1031 exchange can defer both). Figures are a year-1 estimate at your 24.0% rate — not tax advice; consult a CPA.
Schools (NCES district)
- District
- Canaseraga Central School District
- NCES district ID
- 3606360
- Math proficiency
- 60% ▲ 5.00%
- Reading proficiency
- 45% ▼ -5.00%
- Median HH income
- $42,247
- Composite
- 46.07/100
- National rank
- #5487
- State rank
- #430 of 755 in NY
Livability — Canaseraga
- Score
- 61/100
- State rank
- #937
- US rank
- #18234
Category grades
Schools grade is shown separately in the Schools card above.
Census & demographics
- Census place
- Canaseraga, NY
- Population (ZIP)
- 826
Population outlook (Allegany County) Hauer SSP2
- Today (2025)
- 45,362 people
- By 2030
- 43,078 · -5.0%
- By 2040
- 38,031 · -16.2%
- By 2050
- 33,634 · -25.9%
- By 2075
- 25,285 · -44.3%
- By 2100
- 18,902 · -58.3%
Race, ethnicity, and origin ACS 2023
- Neighborhood character
- Predominantly White (93%)
- Race & ethnicity
- White 93% Hispanic / Latino 6% Two or more races 2%
- Hispanic origin (detail)
- Mexican 1% Puerto Rican 3% Cuban 1%
- Common ancestry
- Slovak 5% Iranian 4% Lithuanian 2%
- Foreign-born
- 3%
- Languages at home
- 97% English-only · German/W. Germanic 1%
Political lean MEDSL · Allegany
- 2024 margin
- Solid R (+43.2) · D 28.4% · R 71.6%
- 2008→2024 swing
- -21.5pp toward R · 2008: -21.7pp · 2024: -43.2pp
- All cycles
- 2024: R+43.2 2020: R+38.9 2016: R+42.3 2012: R+25.3 2008: R+21.7
Not yet ingested
- Civics
- —
Market trends
- HPI YoY
- ▲ 8.95%
- Current HPI
- 254.8905
- Rent YoY
- —
- Metro
- —
- State GDP YoY
- ▲ 2.60%
- F500 in state
- 92
Industry mix (Fortune 500 HQ in NY)
| Industry | F500 HQs | Revenue |
|---|---|---|
| Financial Services | 10 | $950B |
|
||
| Consumer Goods | 9 | $162B |
|
||
| Insurance | 4 | $225B |
|
||
| Telecommunications | 2 | $144B |
|
||
| Pharmaceuticals | 2 | $112B |
|
||
| Media / Entertainment | 2 | $69B |
|
||
Price history
+482.5% since first listed2 events — show timeline
- 2026-06-18 Listed $69,900 UNYREIS
- 1999-10-20 Sold (Public Records) $12,000 Public Records
Property tax history
+7.0%/yrLatest (2025): $2,334 · +7.9% YoY. Source: county tax records.
Cash-flow waterfall
monthlySold comps — $/sqft
last 12 mo · ≤1 miLoading sold comps…