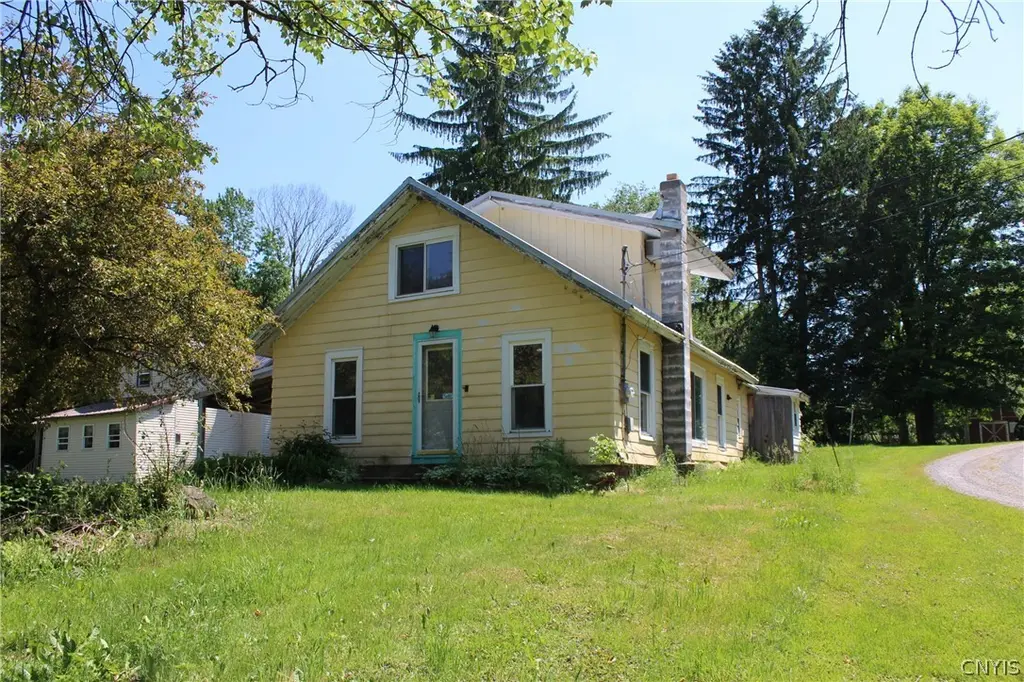
1834 State Route 69 · Camden, NY
Flood risk 1/10 · Minimal
- FEMA flood zone
- X (unshaded)
- Chance of flooding over 30 yrs
- 0.0%
- Est. flood insurance / yr
- $473 – $860
Fire risk 3/10 · Minor
- Est. fire insurance / yr
- $691 – $1,283
Heat risk 2/10 · Minimal
- Hot days now (above 93°F)
- 7 days/yr
- Hot days in 30 yrs
- 16 days/yr
Wind risk 1/10 · Minimal
- Chance of severe wind over 30 yrs
- —
Air-quality risk 2/10 · Minimal
- Unhealthy air days now
- 1 days/yr
- Unhealthy air days in 30 yrs
- 1 days/yr
Risk factors via First Street. Map © Google.
Why this score? — see what drove the B grade
The composite is a weighted blend of 9 inputs, each scored 0–100. Each bar is that input's sub-score; the figure is the points it added to the 100-point composite (weight × sub-score).
- Cash flow +27.8/30.0
- Appreciation +10.0/10.0
- DSCR +9.8/10.0
- ARV discount +7.3/15.0
- 1% rule +7.1/10.0
- Schools +3.5/10.0
- Livability +3.4/5.0
- Rent growth +2.5/5.0
- Condition / age +2.5/5.0
$95,000
🖨 Deal sheet (PDF) 📄 Offer letter ✓ Due diligence
Listing remarks
Tucked up on the hillside on nearly an acre of land, this charming 3 bedroom bungalow delivers on space and practicality. Inside is a well-planned layout with 1st floor laundry and full bath off the kitchen, two small bedrooms on the 1st floor and one large bedroom on the 2nd floor, two living areas and a dining room along with a large screened in back porch allow for some peaceful mornings and a little entertaining in the evening. Large back yard offers room to play. You don't find many homes that you can move into under $100k, but today is your lucky day.
Key facts
- Large back yard
- 1st floor laundry
- 0.89 acre lot
Tags
Property features AI
Exterior
- Parking: No garage
- Utilities: Well water; Septic tank; Cable available
- Home design: 2-story home; Existing/resale property
- Construction: Aluminum siding; Stone foundation; Built previously (existing)
- Exterior features: Gravel driveway; Porch (screened)
Interior
- Kitchen: Breakfast bar (kitchen opening to living/entry area)
- Bedrooms: 2 bedrooms (both on the main level)
- Flooring: Carpet; Laminate; Varies
- Bathrooms: 1 full bathroom (on the main level)
- Heating & cooling: Oil forced-air heating
- Interior features: Breakfast bar; Entrance foyer; Bedroom on main level; Partial dirt-floor basement
- Laundry & utility: Laundry on the main level; Electric water heater
Neighborhood map
What this means for you Summary
Snapshot
- This is a 2-bed/1.0-bath single-family listed at $95k.
Deal economics
- At list price, monthly cash flow is $289 ($3k/yr) — positive.
- The deal already cash-flows at list — no discount required.
- Meets the 1% rule at list price ($1k rent vs $95k).
- Cap rate 9.9% vs local median 3.0% in Camden — top-decile yield for the area; either an underpriced asset or a hidden risk that comps aren't pricing in. Stress-test before assuming the spread holds.
Location & tenants
- Location reads 68/100 on livability (#549 in NY) — a middle-class / working-renter tenant base. Strengths: cost of living A+, housing A+, crime A-; Watch: employment D+, amenities F, commute F.
- Camden Central School District (rural): math 34% / reading 48% proficiency, ranked #504 of 590 in NY (top 85%) — families likely to look elsewhere, expect single-tenant / working-renter base with shorter leases.
- Market conditions: 55 active listings in the ZIP; 204 units permitted in Oneida County in 2024 (68 in 5+ unit buildings).
Forward outlook
- In year one you build about $10k of equity ($657 loan paydown + $10k appreciation (10.0% local appreciation)).
- Oneida County population projected at -12% by 2050 — secular population decline; favor cash flow + early exit over multi-decade hold.
- At projected returns (10.0% appreciation + 3.0% rent growth), your $27k cash investment doubles in ~2 years — after that, you're playing with house money.
- By year 4, paydown + projected appreciation supports a ~$36k cash-out refi (75% LTV) — recoverable capital for the next deal without selling this one.
Negotiation context
- Only 11 days on market — expect competitive offers; lowballing is unlikely to land.
Risks & watch-outs
- Watch-outs: built in 1930 — expect roof / HVAC / electrical / plumbing capex.
Questions for the listing agent
- Built in 1930 — when were the roof, HVAC, electrical panel, plumbing, and water heater last replaced?
- Is there a deadline driving the sale (1031 exchange, divorce, estate, relocation)? That informs how much negotiation room exists.
- What's the average days-on-market for RENTAL listings here right now (not sales)? A rising rental-DOM trend means longer vacancies and softer asking-rent achievability than the comps imply.
- What's the recent tenant-quality profile in this submarket — average credit score on applications, eviction rate, late-payment / NSF rate, and stable-employment percentage? A property-management company in the area should have these aggregated.
- How much new for-sale + rental construction is in the pipeline within 1–3 miles? Heavy new supply typically softens prices + rents 12–24 months out; constrained supply supports both.
Investment metrics
- 1% rule
- 1.21% ✓
- Cap rate
- 9.95%
- Cash-on-cash
- 13.05%
- DSCR
- 1.58
- GRM
- 6.9
CMA / ARV
- ARV (on-the-fly)
- $94,636
- Comps found
- 3
Show comp detail 3 sales within ~0.75 mi
| Address | Dist | Beds/Ba | Sqft | Sold | Price | $/sf | Match |
|---|---|---|---|---|---|---|---|
| 78 Mexico St | 0.50mi | 3/2.0 (+1) | 1,614 (+1%) | 16mo | $94,760 | $59 | 53 |
| 16 Fayette St | 0.66mi | 3/1.0 (+1) | 1,520 (-5%) | 12mo | $82,400 | $54 | 46 |
| 1630 Nys Rt 69 | 0.73mi | 3/1.0 (+1) | 1,512 (-6%) | 15mo | $369,900 | $245 | 39 |
Match score weights: distance 35% · size 25% · config 20% · recency 20%. Top-matched comps best support the ARV.
Projected returns pro-forma
10.0% appreciation · 3.0% rent growth · sell at horizon
- IRR
- 33.9%
- Equity multiple
- 3.64×
- Total profit
- $70,157
- Equity at exit
- $85,584
- IRR
- 29.2%
- Equity multiple
- 8.22×
- Total profit
- $192,108
- Equity at exit
- $184,564
Cash invested: $26,600 (down + closing). Projections, not guarantees.
Landlord ↔ Tenant lean methodology
- Overall (STATE)
- 15 Strongly Tenant-Friendly
- State New York
- 15 Strongly Tenant-Friendly · D+10
- County
- — inherits STATE
- City
- — inherits STATE
ZIP-level market 13316
- Home prices YoY
- 5.4%
- Active inventory
- 55
- Price-to-rent
- 6.9×
Monthly cashflow live
- Estimated rent
- $1,154 medium interval (Pro) →
- Mortgage (P&I)
- −$498
- Tax from tax record
- −$84 /mo · $1,012/yr
- Insurance
- −$40
- HOA
- −$0
- Vacancy / Maint / Mgmt
- −$242
- Net cashflow
- $289
Break-even live
Sensitivity live
| Price | -10% $343 | -5% $316 | +0% $289 | +5% $262 | +10% $235 |
|---|---|---|---|---|---|
| Rent | -10% $198 | -5% $244 | +0% $289 | +5% $335 | +10% $380 |
| Rate | -1.0pp $337 | -0.5pp $313 | base $289 | +0.5pp $265 | +1.0pp $240 |
UW: 25.0% down · 7.5% · 30yr · 1.5% tax · 5.0% vac · 8.0% maint · 8.0% mgmt
Financing live
Cash to close
- Down payment
- $23,750
- Closing costs
- $2,850
- Reserves months
- —
- Total cash needed
- —
Loan-product check · same deal, 3 products live
Conventional
25% down · 7.5% · 30yr
- Down + closing
- —
- Monthly P&I
- —
- Monthly cashflow
- —
- DSCR
- —
- Eligible?
- —
Personal DTI + credit; lowest rate.
DSCR
20% down · 8.5% · 30yr
- Down + closing
- —
- Monthly P&I
- —
- Monthly cashflow
- —
- DSCR
- —
- Eligible?
- —
No personal income docs; deal must DSCR.
Hard money
10% down · 12.0% · 12mo
- Down + closing
- —
- Monthly P&I
- —
- Monthly cashflow
- —
- DSCR
- —
- Eligible?
- —
Short-term bridge; refi at stabilization.
Listing history 9 events
-
2026-06-21days on market $95,000 Active 11 DOM
-
2026-06-21days on market $95,000 Active 10 DOM
-
2026-06-18days on market $95,000 Active 8 DOM
-
2026-06-17days on market $95,000 Active 7 DOM
-
2026-06-16days on market $95,000 Active 6 DOM
-
2026-06-15days on market $95,000 Active 5 DOM
-
2026-06-13days on market $95,000 Active 3 DOM
-
2026-06-12remarks 563-char remark
-
2026-06-12$95,000 Active 2 DOM
ⓘ Source: listings_history table (triggers on properties + properties_extension) + one-shot
backfill from property_details.listing_events for pre-trigger history.
Tax reassessment forecast NY · Partial reset (capped growth)
- Current annual tax
- $1,012 · $84/mo
- Projected year-2 tax
- $1,309 · $109/mo
- Expected delta
- +$297/yr (+$25/mo · 29.3%)
ⓘ Screening estimate from a state-policy table — verify with the county assessor before closing.
Climate risk First Street
- Flood 1/10 Low FEMA zone X (unshaded) · 0% chance over 30 yrs
- Wildfire 3/10 Moderate
- Heat 2/10 Low 7 d/yr ≥93°F today · 16 d/yr by 30 yrs out
- Wind 1/10 Low
- Air quality 2/10 Low 1 unhealthy d/yr today · 1 by 30 yrs out
Nearby sold comps map
Loading sold comps map…
Walkable amenities ~0.75 mi
Loading nearby amenities…
Taxation est. · year 1
- Rental income
- $13,844
- − Mortgage interest
- −$5,321
- − Property taxes
- −$1,012
- − Insurance
- −$475
- − Repairs & maintenance
- −$1,107
- − Management
- −$1,107
- − Depreciation
- −$2,764
- Taxable income
- $2,056
- Est. tax owed @ 24.0%
- −$493
- After-tax cash flow
- $2,977/yr
For passive investors: Depreciation is non-cash, so a rental often shows a tax loss while cash-flowing — sheltering income. Rental losses are passive: they offset passive income freely, and up to $25,000/yr can offset ordinary (W-2) income if you actively participate and your MAGI is under $100k (phasing out to $0 by $150k); unused losses carry forward. On sale, claimed depreciation is recaptured at up to 25%, and gains may owe capital-gains tax (a 1031 exchange can defer both). Figures are a year-1 estimate at your 24.0% rate — not tax advice; consult a CPA.
Schools (NCES district)
- District
- Camden Central School District
- NCES district ID
- 3606240
- Math proficiency
- 34% ▼ -14.00%
- Reading proficiency
- 48% ▲ 1.00%
- Median HH income
- $48,686
- Composite
- 35.15/100
- National rank
- #5008
- State rank
- #504 of 590 in NY
Livability — Camden
- Score
- 68/100
- State rank
- #549
- US rank
- #9877
Category grades
Schools grade is shown separately in the Schools card above.
Census & demographics
- Population (ZIP)
- 5,924
Population outlook (Oneida County) Hauer SSP2
- Today (2025)
- 225,223 people
- By 2030
- 220,384 · -2.1%
- By 2040
- 209,071 · -7.2%
- By 2050
- 197,920 · -12.1%
- By 2075
- 175,541 · -22.1%
- By 2100
- 148,491 · -34.1%
Race, ethnicity, and origin ACS 2023
- Neighborhood character
- Predominantly White (93%)
- Race & ethnicity
- White 93% Two or more races 4% Hispanic / Latino 1%
- Common ancestry
- Romanian 5% Lithuanian 5% Italian 2%
- Foreign-born
- 1% · Canada
- Languages at home
- 97% English-only · Spanish 2%
Political lean MEDSL · Oneida
- 2024 margin
- Strong R (+21.3) · D 39.4% · R 60.6%
- 2008→2024 swing
- -15.2pp toward R · 2008: -6.1pp · 2024: -21.3pp
- All cycles
- 2024: R+21.3 2020: R+15.5 2016: R+21.1 2012: R+5.3 2008: R+6.1
Not yet ingested
- Civics
- —
Market trends
- HPI YoY
- ▲ 16.23%
- Current HPI
- 316.4996
- Rent YoY
- —
- Metro
- —
- State GDP YoY
- ▲ 2.60%
- F500 in state
- 92
Industry mix (Fortune 500 HQ in NY)
| Industry | F500 HQs | Revenue |
|---|---|---|
| Financial Services | 10 | $950B |
|
||
| Consumer Goods | 9 | $162B |
|
||
| Insurance | 4 | $225B |
|
||
| Telecommunications | 2 | $144B |
|
||
| Pharmaceuticals | 2 | $112B |
|
||
| Media / Entertainment | 2 | $69B |
|
||
Price history
1 event — show timeline
- 2026-06-09 Listed $95,000 CNYIS
Property tax history
+14.8%/yrLatest (2025): $1,012 · +15.5% YoY. Source: county tax records.
Cash-flow waterfall
monthlySold comps — $/sqft
last 12 mo · ≤1 miLoading sold comps…