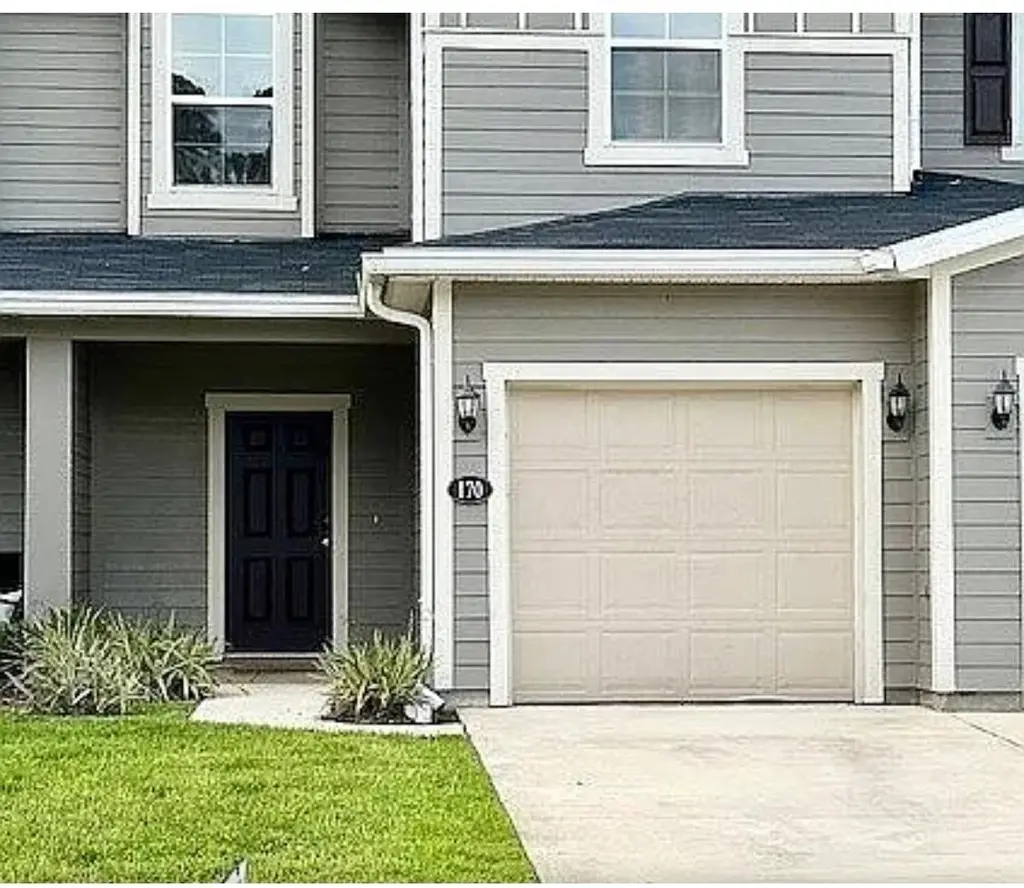
170 Great Star Ct · St. Augustine South, FL
Flood risk 1/10 · Minimal
- FEMA flood zone
- X (unshaded)
- Chance of flooding over 30 yrs
- 0.0%
- Est. flood insurance / yr
- $507 – $1,088
Fire risk 7/10 · Major
- Est. fire insurance / yr
- $947 – $1,759
Heat risk 9/10 · Severe
- Hot days now (above 106°F)
- 7 days/yr
- Hot days in 30 yrs
- 20 days/yr
Wind risk 9/10 · Severe
- Chance of severe wind over 30 yrs
- 99.0%
Air-quality risk 2/10 · Minimal
- Unhealthy air days now
- 2 days/yr
- Unhealthy air days in 30 yrs
- 2 days/yr
Risk factors via First Street. Map © Google.
Why this score? — see what drove the D grade
The composite is a weighted blend of 9 inputs, each scored 0–100. Each bar is that input's sub-score; the figure is the points it added to the 100-point composite (weight × sub-score).
- ARV discount +15.0/15.0
- Cash flow +7.1/30.0
- Schools +6.4/10.0
- 1% rule +2.8/10.0
- Rent growth +2.7/5.0
- Livability +2.5/5.0
- Condition / age +2.5/5.0
- DSCR +1.3/10.0
- Appreciation +0.0/10.0
$259,000
🖨 Deal sheet (PDF) 📄 Offer letter ✓ Due diligence
Listing remarks MLS
Welcome to 170 Great Star Court- Where Comfort meets Convenience. Nestled in the heart of Saint Augustine, this beautifully maintained 3-bedroom, 2.5-bath townhouse offers the perfect blend of style and practicality. With 1,567 square feet of thoughtfully designed living space, it's ideal for families, professionals, or anyone seeking a low-maintenance lifestyle near everything.
Key facts
- $190 HOA
- Built 2023
- Listed 226 days
Neighborhood map
What this means for you Summary
Snapshot
- This is a 3-bed/2.5-bath single-family listed at $259k.
Deal economics
- At list price, monthly cash flow is $-363 ($-4k/yr) — negative.
- To cash-flow at today's rent, offer at most $195k (24.7% below list).
- To meet the 1% rule (rent ≥ 1% of price), the offer needs to be $201k (22.4% below list).
- Recommended offer: $195k (24.7% below list) — sets the bar for cash-flow.
Location & tenants
- Location reads: area grade D — affects rentability + tenant quality, not the cash-flow math above.
- St. Johns (rural): math 75% / reading 73% proficiency, ranked #2 of 73 in FL (top 3%) — strong family-tenant draw, lease renewals of 3-5y typical; only 20% free/reduced lunch — higher-income household profile.
- Zoned schools: Otis A. Mason Elementary School (math 76% / reading 60%, grade B+, #425 of 2,144 statewide, top 20%, 719 students, 45% FRL); Gamble Rogers Middle School (math 61% / reading 55%, grade B, #151 of 571 statewide, top 27%, 925 students, 47% FRL); Pedro Menendez High School (math 31% / reading 54%, grade F, #264 of 667 statewide, top 41%, 1,519 students, 39% FRL) — zoned schools average 44% FRL vs 20% district-wide (24 pts higher); higher-poverty schools than district average — tighter screening recommended.
- Zoned-school proficiency averages 56% at this address vs 74% district-wide (-18 pts) — the specific schools serving this property underperform the St. Johns average; the district grade overstates school quality for this exact location.
- Market conditions: Rents flat; 407 active listings in the ZIP; 13 comparable units currently listed for rent nearby; rentals at typical pace (median 22d on market — plan ~3-4 weeks tenant-placement turnaround); solid renter incomes; 5,575 units permitted in St. Johns County in 2024 (584 in 5+ unit buildings).
- This rent runs 32% of the median local income ($77k/yr) — at the standard rent-burdened threshold; future hikes will face affordability resistance.
Forward outlook
- Local home prices are declining (-3.0%/yr); year-one equity from $2k of loan paydown is wiped out by about $8k of value loss. Plan a longer hold.
- St. Johns County population projected at +60% by 2050 — long-run rental-demand tailwind backs the buy-and-hold thesis.
Negotiation context
- It's been on market 226 days — a 12% lower offer ($228k) is reasonable based on typical stale-listing flexibility.
- 4 sale attempts since 3y ago; this cycle's ask has dropped $16k (6%) from the opening price — seller is motivated, your offer sets the floor, not the list.
Risks & watch-outs
- Climate carrying-cost: severe wind risk, 99% chance of damaging wind over 30y; major wildfire risk; extreme-heat days projected 7→20/yr by 2055 (HVAC capex compounding) — expect insurance premiums to compound above CPI over the hold.
Questions for the listing agent
- What do current leases actually rent for vs. the listed asking? Can we see a recent rent roll and the last 12 months of T-12 income?
- It's been on market 226 days. Have you received any prior offers? Is the seller open to a 25% concession, seller financing, or rate buy-down credit?
- What does the HOA fee cover, when was the last increase, and are there any pending special assessments or reserve-fund shortfalls?
- Why hasn't it sold? Are there any deal-killer items the seller is aware of (foundation, flood, title, zoning, code violations)?
- Is there a deadline driving the sale (1031 exchange, divorce, estate, relocation)? That informs how much negotiation room exists.
- The area grade is low — what's the realistic commute time and amenity access for the typical tenant pool here? Any planned neighborhood developments (good or bad) we should know about?
- What's the average days-on-market for RENTAL listings here right now (not sales)? A rising rental-DOM trend means longer vacancies and softer asking-rent achievability than the comps imply.
- What's the recent tenant-quality profile in this submarket — average credit score on applications, eviction rate, late-payment / NSF rate, and stable-employment percentage? A property-management company in the area should have these aggregated.
- How much new for-sale + rental construction is in the pipeline within 1–3 miles? Heavy new supply typically softens prices + rents 12–24 months out; constrained supply supports both.
Investment metrics
- 1% rule
- 0.78% ✗
- Cap rate
- 4.61%
- Cash-on-cash
- -6.00%
- DSCR
- 0.73
- GRM
- 10.7
CMA / ARV
- ARV (median comp)
- $333,379
- List price
- $259,000
- Delta
- -22.31%
- Verdict
- UNDERPRICED
- Comps
- 20 within 1.0 mi
Show comp detail 12 sales within ~0.75 mi
| Address | Dist | Beds/Ba | Sqft | Sold | Price | $/sf | Match |
|---|---|---|---|---|---|---|---|
| 208 Beach Palm Ct | 0.48mi | 3/2.5 | 1,356 (+0%) | 6mo | $250,000 | $184 | 73 |
| 20 Pittman Ct | 0.29mi | 2/2.5 (-1) | 1,259 (-7%) | 6mo | $250,000 | $199 | 65 |
| 39 Moultrie Creek Cir | 0.16mi | 3/2.5 | 1,553 (+15%) | 10mo | $334,000 | $215 | 60 |
| 94 Moultrie Creek Cir | 0.17mi | 2/1.5 (-1) | 1,208 (-11%) | 11mo | $160,000 | $132 | 56 |
| 110 Wild Egret Ln | 0.34mi | 3/2.0 | 1,492 (+10%) | 15mo | $386,000 | $259 | 53 |
| 83 S Twin Maple Rd | 0.65mi | 3/2.0 | 1,277 (-6%) | 11mo | $299,000 | $234 | 49 |
| 180 Sawmill Landing Dr | 0.71mi | 3/2.0 | 1,438 (+6%) | 7mo | $360,000 | $250 | 49 |
| 135 Sawmill Landing Dr | 0.66mi | 3/2.0 | 1,299 (-4%) | 18mo | $315,000 | $242 | 46 |
| 104 Twin Lakes Dr | 0.70mi | 3/2.0 | 1,460 (+8%) | 10mo | $410,000 | $281 | 44 |
| 2985 Hilltop Rd A | 0.45mi | 3/2.0 | 1,540 (+14%) | 14mo | $421,000 | $273 | 43 |
| 1212 Fort Peyton Dr | 0.74mi | 3/2.0 | 1,233 (-9%) | 9mo | $409,000 | $332 | 41 |
| 1218 Fort Peyton Dr | 0.72mi | 3/2.0 | 1,248 (-8%) | 15mo | $341,999 | $274 | 39 |
Match score weights: distance 35% · size 25% · config 20% · recency 20%. Top-matched comps best support the ARV.
Projected returns pro-forma
-3.0% appreciation · 0.85% rent growth · sell at horizon
- IRR
- -29.2%
- Equity multiple
- 0.05×
- Total profit
- $-69,202
- Equity at exit
- $38,618
- IRR
- -42.7%
- Equity multiple
- -0.46×
- Total profit
- $-106,212
- Equity at exit
- $22,394
Cash invested: $72,520 (down + closing). Projections, not guarantees.
Landlord ↔ Tenant lean methodology
- Overall (STATE)
- 87 Strongly Landlord-Friendly
- State Florida
- 87 Strongly Landlord-Friendly · R+3
- County
- — inherits STATE
- City
- — inherits STATE
ZIP-level market 32086
- Rents YoY
- 0.8%
- Active inventory
- 407
- Price-to-rent
- 10.7×
Monthly cashflow live
- Estimated rent
- $2,009 high interval (Pro) →
- Mortgage (P&I)
- −$1,358
- Tax from tax record
- −$294 /mo · $3,523/yr
- Insurance
- −$108
- HOA
- −$190
- Vacancy / Maint / Mgmt
- −$422
- Net cashflow
- $-363
Break-even live
Sensitivity live
| Price | -10% $-216 | -5% $-289 | +0% $-363 | +5% $-436 | +10% $-509 |
|---|---|---|---|---|---|
| Rent | -10% $-521 | -5% $-442 | +0% $-363 | +5% $-283 | +10% $-204 |
| Rate | -1.0pp $-232 | -0.5pp $-297 | base $-363 | +0.5pp $-430 | +1.0pp $-498 |
UW: 25.0% down · 7.5% · 30yr · 1.5% tax · 5.0% vac · 8.0% maint · 8.0% mgmt
Financing live
Cash to close
- Down payment
- $64,750
- Closing costs
- $7,770
- Reserves months
- —
- Total cash needed
- —
Loan-product check · same deal, 3 products live
Conventional
25% down · 7.5% · 30yr
- Down + closing
- —
- Monthly P&I
- —
- Monthly cashflow
- —
- DSCR
- —
- Eligible?
- —
Personal DTI + credit; lowest rate.
DSCR
20% down · 8.5% · 30yr
- Down + closing
- —
- Monthly P&I
- —
- Monthly cashflow
- —
- DSCR
- —
- Eligible?
- —
No personal income docs; deal must DSCR.
Hard money
10% down · 12.0% · 12mo
- Down + closing
- —
- Monthly P&I
- —
- Monthly cashflow
- —
- DSCR
- —
- Eligible?
- —
Short-term bridge; refi at stabilization.
Rent comps 13 comps
| Address | Beds | Baths | Sqft | Rent | $/sqft | DOM | Units | Dist |
|---|---|---|---|---|---|---|---|---|
| 5 Moultrie Creek Cir Saint Augustine, FL | 2.0 | 1.5 | 1078 | $1,350 | $1.25 | 22d | 1 | 0.15mi |
| 10 Moultrie Creek Cir Unit 1 St. Augustine, FL | 2.0 | 1.5 | 1078 | $1,700 | $1.58 | 25d | 1 | 0.16mi |
| 150 Silver Fern Dr Saint Augustine, FL | 3.0 | 2.0 | 1354 | $1,900 | $1.40 | 23d | 1 | 0.21mi |
| 64 Pittman Ct Saint Augustine, FL | 3.0 | 2.5 | 1567 | $2,100 | $1.34 | 0d | 1 | 0.34mi |
| 159 Beach Palm Ct Saint Augustine, FL | 3.0 | 2.5 | 1354 | $1,800 | $1.33 | 19d | 1 | 0.44mi |
| 97 Ayamonte Rd Saint Augustine, FL | 3.0 | 2.5 | 1308 | $1,775 | $1.36 | 18d | 1 | 0.90mi |
| 258 Jarama Cir Saint Augustine, FL | 4.0 | 2.0 | 1862 | $2,350 | $1.26 | 16d | 1 | 0.91mi |
| 121 Ardila Cir Saint Augustine, FL | 3.0 | 2.0 | 1711 | $2,400 | $1.40 | 25d | 1 | 1.13mi |
| 3421 Red Cloud Trl Saint Augustine, FL | 4.0 | 2.0 | 1524 | $2,650 | $1.74 | 25d | 1 | 1.18mi |
| 339 Caminha Rd Saint Augustine, FL | 4.0 | 2.0 | 1779 | $2,295 | $1.29 | 9d | 1 | 1.18mi |
| 339 Caminha Rd Saint Augustine, FL | 4.0 | 2.0 | 1774 | $2,295 | $1.29 | 0d | 1 | 1.18mi |
| 890 Poinsettia Rd Unit B St. Augustine, FL | 2.0 | 2.0 | 1032 | $1,590 | $1.54 | 25d | 1 | 1.20mi |
| 121 Aveiro Way Saint Augustine, FL | 3.0 | 2.0 | 1711 | $2,250 | $1.32 | 21d | 1 | 1.33mi |
HOA detail
- Monthly dues
- $190 · $2,280/yr
Listing history 14 events
-
2026-06-03days on market $259,000 Active 226 DOM
-
2026-06-02days on market $259,000 Active 225 DOM
-
2026-06-01days on market $259,000 Active 224 DOM
-
2026-05-31days on market $259,000 Active 223 DOM
-
2026-04-14status Active 381-char remark
Show marketing remark (381 chars)
Welcome to 170 Great Star Court- Where Comfort meets Convenience. Nestled in the heart of Saint Augustine, this beautifully maintained 3-bedroom, 2.5-bath townhouse offers the perfect blend of style and practicality. With 1,567 square feet of thoughtfully designed living space, it's ideal for families, professionals, or anyone seeking a low-maintenance lifestyle near everything.
-
2026-04-03historical 381-char remark
Show marketing remark (381 chars)
Welcome to 170 Great Star Court- Where Comfort meets Convenience. Nestled in the heart of Saint Augustine, this beautifully maintained 3-bedroom, 2.5-bath townhouse offers the perfect blend of style and practicality. With 1,567 square feet of thoughtfully designed living space, it's ideal for families, professionals, or anyone seeking a low-maintenance lifestyle near everything.
-
2025-12-06price $259,000 381-char remark
Show marketing remark (381 chars)
Welcome to 170 Great Star Court- Where Comfort meets Convenience. Nestled in the heart of Saint Augustine, this beautifully maintained 3-bedroom, 2.5-bath townhouse offers the perfect blend of style and practicality. With 1,567 square feet of thoughtfully designed living space, it's ideal for families, professionals, or anyone seeking a low-maintenance lifestyle near everything.
-
2025-10-06$275,000 Active 381-char remark
Show marketing remark (381 chars)
Welcome to 170 Great Star Court- Where Comfort meets Convenience. Nestled in the heart of Saint Augustine, this beautifully maintained 3-bedroom, 2.5-bath townhouse offers the perfect blend of style and practicality. With 1,567 square feet of thoughtfully designed living space, it's ideal for families, professionals, or anyone seeking a low-maintenance lifestyle near everything.
-
2024-07-21price $295,000
-
2023-04-07status Active
-
2023-04-07soldstatus $282,500 Sold
-
2023-03-17historical
-
2023-03-15price $292,990
-
2023-02-02$299,990 Active
ⓘ Source: listings_history table (triggers on properties + properties_extension) + one-shot
backfill from property_details.listing_events for pre-trigger history.
Tax reassessment forecast FL · Resets to sale price
- Current annual tax
- $3,523 · $294/mo
- Projected year-2 tax
- $3,523 · $294/mo
- Expected delta
- $0/yr ($0/mo · 0.0%)
ⓘ Screening estimate from a state-policy table — verify with the county assessor before closing.
Climate risk First Street
- Flood 1/10 Low FEMA zone X (unshaded) · 0% chance over 30 yrs
- Wildfire 7/10 Severe
- Heat 9/10 Extreme 7 d/yr ≥106°F today · 20 d/yr by 30 yrs out
- Wind 9/10 Extreme 99% chance of damaging wind over 30 yrs
- Air quality 2/10 Low 2 unhealthy d/yr today · 2 by 30 yrs out
Nearby sold comps map
Loading sold comps map…
Walkable amenities ~0.75 mi
Loading nearby amenities…
Taxation est. · year 1
- Rental income
- $24,105
- − Mortgage interest
- −$14,508
- − Property taxes
- −$3,523
- − Insurance
- −$1,295
- − Repairs & maintenance
- −$1,928
- − Management
- −$1,928
- − HOA
- −$2,280
- − Depreciation
- −$7,535
- Taxable loss
- −$8,892
- Est. tax savings @ 24.0%
- +$2,134
- After-tax cash flow
- $-2,219/yr
For passive investors: Depreciation is non-cash, so a rental often shows a tax loss while cash-flowing — sheltering income. Rental losses are passive: they offset passive income freely, and up to $25,000/yr can offset ordinary (W-2) income if you actively participate and your MAGI is under $100k (phasing out to $0 by $150k); unused losses carry forward. On sale, claimed depreciation is recaptured at up to 25%, and gains may owe capital-gains tax (a 1031 exchange can defer both). Figures are a year-1 estimate at your 24.0% rate — not tax advice; consult a CPA.
Schools (NCES district)
- District
- St. Johns
- NCES district ID
- 1201740
- Math proficiency
- 75% ▼ -5.00%
- Reading proficiency
- 73% ▼ -2.00%
- Median HH income
- $66,842
- Composite
- 64.31/100
- National rank
- #556
- State rank
- #2 of 73 in FL
Livability — St. Augustine South
No livability data for this city. (Only ~50 U.S. cities are tracked.)
Census & demographics
- County
- Saint Johns County · 301,599 people
- Metro
- Jacksonville, FL
- Population (ZIP)
- 34,855
- Household income
- $76,512
- Rent vs Own
- Severe rent burden
- 634.0
Population outlook (St. Johns County) Hauer SSP2
- Today (2025)
- 303,941 people
- By 2030
- 342,590 · +12.7%
- By 2040
- 417,328 · +37.3%
- By 2050
- 487,011 · +60.2%
- By 2075
- 635,395 · +109.1%
- By 2100
- 717,469 · +136.1%
Race, ethnicity, and origin ACS 2023
- Neighborhood character
- Predominantly White (84%)
- Race & ethnicity
- White 84% Hispanic / Latino 8% Two or more races 5% Black 3% Asian 1%
- Hispanic origin (detail)
- Puerto Rican 2% Dominican 1%
- Common ancestry
- Romanian 3% Lithuanian 3% Italian 2%
- Foreign-born
- 7% · Canada, Jamaica, Guatemala
- Languages at home
- 91% English-only · Spanish 5% German/W. Germanic 1% Other Indo-European 1%
Political lean MEDSL · St. Johns
- 2024 margin
- Solid R (+31.4) · D 33.9% · R 65.2%
- 2008→2024 swing
- +0.2pp no change · 2008: -31.6pp · 2024: -31.4pp
- All cycles
- 2024: R+31.4 2020: R+26.7 2016: R+33.4 2012: R+37.8 2008: R+31.6
Not yet ingested
- Civics
- —
Market trends
- HPI YoY
- ▼ -278.21%
- Current HPI
- 306.2813
- Rent YoY
- ▲ 0.85%
- Metro
- Jacksonville, FL
- State GDP YoY
- ▲ 3.28%
- F500 in state
- 36
Industry mix (Fortune 500 HQ in FL)
| Industry | F500 HQs | Revenue |
|---|---|---|
| Industrial Technology | 2 | $29B |
|
||
| Insurance | 2 | $17B |
|
||
| Retail | 1 | $60B |
|
||
| Technology Distribution | 1 | $58B |
|
||
| Homebuilding | 1 | $35B |
|
||
| Technology Manufacturing | 1 | $35B |
|
||
Price history
-13.7% since first listed10 events — show timeline
- 2026-04-14 Relisted — St. Augustine and St. Johns County Board of REALTORS®
- 2026-04-03 Delisted — St. Augustine and St. Johns County Board of REALTORS®
- 2025-12-06 Price Changed $259,000 St. Augustine and St. Johns County Board of REALTORS®
- 2025-10-06 Listed $275,000 St. Augustine and St. Johns County Board of REALTORS®
- 2024-07-21 Price Changed $295,000 St. Augustine and St. Johns County Board of REALTORS®
- 2023-04-07 Relisted — realMLS
- 2023-04-07 Sold (MLS) $282,500 realMLS
- 2023-03-17 Listing Removed — realMLS
- 2023-03-15 Price Changed $292,990 realMLS
- 2023-02-02 Listed $299,990 realMLS
Property tax history
+60.8%/yrLatest (2025): $3,523 · +7.2% YoY. Source: county tax records.
Cash-flow waterfall
monthlySold comps — $/sqft
last 12 mo · ≤1 miLoading sold comps…