 🌊 Lakefront
4311 Crystal Lake Dr #407 · Deerfield Beach, FL
Flood risk 1/10 · Minimal
- FEMA flood zone
- X (unshaded)
- Chance of flooding over 30 yrs
- 0.0%
- Est. flood insurance / yr
- $507 – $1,088
Fire risk 1/10 · Minimal
- Est. fire insurance / yr
- $947 – $1,759
Heat risk 9/10 · Severe
- Hot days now (above 107°F)
- 7 days/yr
- Hot days in 30 yrs
- 26 days/yr
Wind risk 10/10 · Severe
- Chance of severe wind over 30 yrs
- 99.0%
Air-quality risk 2/10 · Minimal
- Unhealthy air days now
- 1 days/yr
- Unhealthy air days in 30 yrs
- 3 days/yr
Risk factors via First Street. Map © Google.
Why this score? — see what drove the C- grade
The composite is a weighted blend of 9 inputs, each scored 0–100. Each bar is that input's sub-score; the figure is the points it added to the 100-point composite (weight × sub-score).
- Cash flow +17.7/30.0
- 1% rule +7.6/10.0
- ARV discount +7.5/15.0
- DSCR +5.5/10.0
- Schools +4.1/10.0
- Livability +3.8/5.0
- Rent growth +2.9/5.0
- Condition / age +2.5/5.0
- Appreciation +0.0/10.0
$179,900
🖨 Deal sheet 📄 Offer letter ✓ Due diligence
Listing remarks
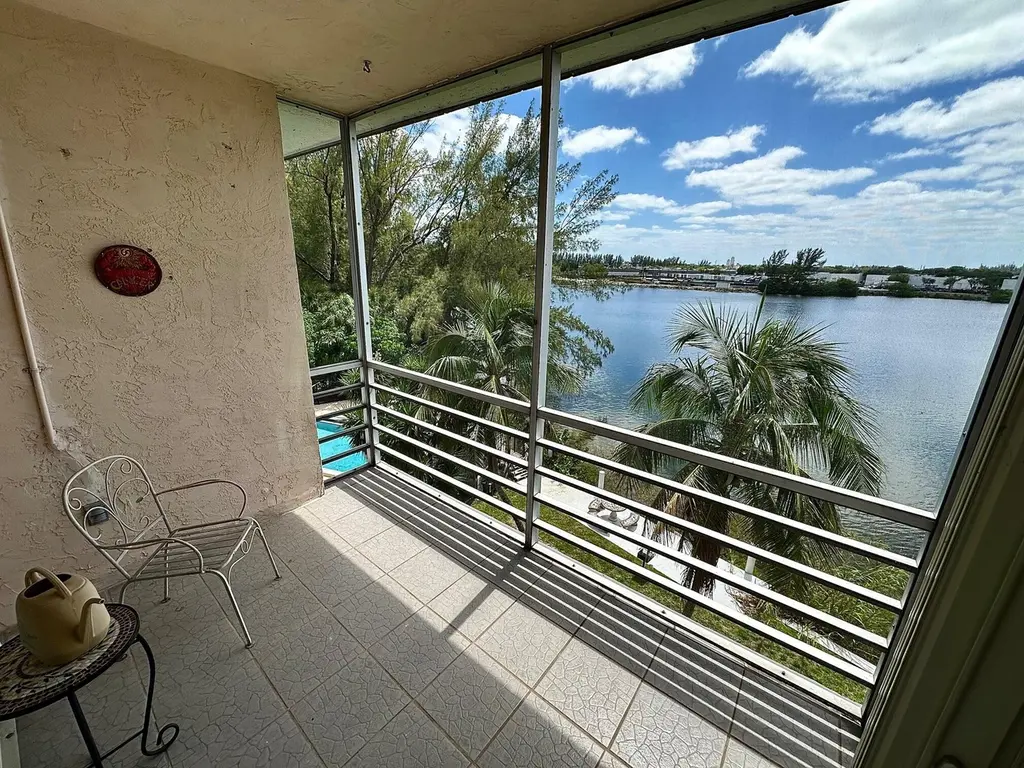
Really nice top floor 2/2 condo with direct views of large lake from every room! Screened patio overlooks both the lake and the community pool. All ages community. This clean and well-kept home is move-in ready. The kitchen has refinished cabinets and quartz countertops, and good cabinet space. All rear windows are impact glass, front windows have shutters. Convenient to I-95, the Turnpike, shopping, and only 3 miles from the beach. The building has two elevators and multiple laundry rooms with many washers and dryers. The assigned parking space (56) is close to the building, and there are plenty of guest spaces. Also there is a separate locking storage closet. This condo has much to offer!
Key facts
- Screened patio
- Direct views
- Community pool
Tags
Property features AI
Finance
- Financial info: Pets allowed with possible restrictions, breed and number limits
- HOA & community: Wincast Arms association; Monthly HOA fee (approx. $589) covering water, sewer, common areas and elevator; Community amenities include elevator, laundry room and pool
Exterior
- Parking: Assigned parking; Two parking spaces total (one open space)
- Security: Smoke detectors
- Utilities: Public water; Public sewer; Cable connected
- Home design: Condominium; Resale unit; Building name: Wincast Arms; Faces northeast; 4-story building; Living area approximately 1,200
- Construction: Concrete construction; Tar and gravel roof; Built-in foundation
- Exterior features: Screened patio; Patio; Waterfront property (no specified waterfront features)
Interior
- Kitchen: Disposal; Dishwasher; Electric range; Refrigerator; Electric water heater
- Bedrooms: One main-level bedroom
- Flooring: Carpet; Laminate
- Bathrooms: Two full bathrooms (one on the main level)
- Heating & cooling: Central heating; Central air; Ceiling fans
- Interior features: Walk-in closets; Stacked bedroom layout; Storm windows
- Laundry & utility: Laundry in multiple locations; Unfurnished
Neighborhood map
What this means for you Summary
Snapshot
- This is a 2-bed/2.0-bath condo listed at $180k.
Deal economics
- At list price, monthly cash flow is $146 ($2k/yr) — positive.
- The deal already cash-flows at list — no discount required.
- Meets the 1% rule at list price ($2k rent vs $180k).
- Recommended offer: $175k (3.0% below list) — sets the bar for market timing.
- Cap rate 7.3% vs local median 4.2% in Deerfield Beach — top-decile yield for the area; either an underpriced asset or a hidden risk that comps aren't pricing in. Stress-test before assuming the spread holds.
Location & tenants
- Location reads 75/100 on livability (#250 in FL, #3,970 nationally) — a middle-class / working-renter tenant base. Strengths: housing A+, health & safety A+, cost of living A; Watch: amenities D-, employment D-.
- Broward (suburban): math 42% / reading 53% proficiency, ranked #46 of 73 in FL (top 63%) — families likely to look elsewhere, expect single-tenant / working-renter base with shorter leases.
- Zoned schools: Quiet Waters Elementary School (math 40% / reading 48%, grade F, #1,330 of 2,144 statewide, top 63%, 1,128 students, 62% FRL); Crystal Lake Middle School (math 24% / reading 38%, grade F, #462 of 571 statewide, top 81%, 1,055 students, 74% FRL); Blanche Ely High School (math 7% / reading 29%, grade F, #570 of 667 statewide, top 86%, 1,906 students, 75% FRL) — zoned schools average 70% FRL vs 51% district-wide (19 pts higher); higher-poverty schools than district average — tighter screening recommended.
- Zoned-school proficiency averages 31% at this address vs 48% district-wide (-16 pts) — the specific schools serving this property underperform the Broward average; the district grade overstates school quality for this exact location.
- Market conditions: Rents rising (+1.8%/yr); 591 active listings in the ZIP; 40 comparable units currently listed for rent nearby; rentals at typical pace (median 25d on market — plan ~3-4 weeks tenant-placement turnaround); 2,111 units permitted in Broward County in 2024 (1,265 in 5+ unit buildings).
Forward outlook
- Local home prices are declining (-3.0%/yr); year-one equity from $1k of loan paydown is wiped out by about $5k of value loss. Plan a longer hold.
- Broward County population projected at +34% by 2050 — long-run rental-demand tailwind backs the buy-and-hold thesis.
Negotiation context
- It's been on market 60 days — a 3% lower offer ($175k) is reasonable based on typical stale-listing flexibility.
- 2 sale attempts since 20y ago with the ask held roughly flat each time — persistent listings suggest the price (not the market) is what's stuck; bring a comps-based counter.
- Current owner paid $85k; list at $180k implies a 112% gain — meaningful room to come down on a strong offer.
Risks & watch-outs
- Watch-outs: HOA is 26% of rent.
- Climate carrying-cost: severe wind risk, 99% chance of damaging wind over 30y; extreme-heat days projected 7→26/yr by 2055 (HVAC capex compounding) — expect insurance premiums to compound above CPI over the hold.
Questions for the listing agent
- It's been on market 60 days. Have you received any prior offers? Is the seller open to a 3% concession, seller financing, or rate buy-down credit?
- Built in 1970 — when were the roof, HVAC, electrical panel, plumbing, and water heater last replaced?
- What does the HOA fee cover, when was the last increase, and are there any pending special assessments or reserve-fund shortfalls?
- Any open or pending special assessments — roof, HVAC, plumbing, elevator, façade? What's the per-unit balance and payoff schedule, and is the seller paying it off at close or rolling it to the buyer?
- Is there a deadline driving the sale (1031 exchange, divorce, estate, relocation)? That informs how much negotiation room exists.
- Schools are D-rated, which usually means shorter tenancies and higher turnover. Who's the typical renter profile here, and what's been the actual vacancy rate?
- This sits on a lake — are riparian / water-frontage rights deeded with the parcel? Any dock permits, shoreline easements, or HOA water-use restrictions?
- What's the documented flood / surge / shoreline-erosion history here (FEMA AND non-FEMA — e.g., storm surge, creek backup, septic-field saturation)?
- Any water-quality or seasonal algae-bloom issues that affect tenant satisfaction or short-term-rental demand?
- What's the average days-on-market for RENTAL listings here right now (not sales)? A rising rental-DOM trend means longer vacancies and softer asking-rent achievability than the comps imply.
- What's the recent tenant-quality profile in this submarket — average credit score on applications, eviction rate, late-payment / NSF rate, and stable-employment percentage? A property-management company in the area should have these aggregated.
- How much new apartment / multifamily construction is in the pipeline within 1–3 miles? Heavy new supply (>2% of stock underway) typically softens rents 12–24 months out; light construction supports rent growth.
Investment metrics
- 1% rule
- 1.26% ✓
- Cap rate
- 7.26%
- Cash-on-cash
- 3.47%
- DSCR
- 1.15
- GRM
- 6.6
CMA / ARV
No comps found within radius.
Projected returns pro-forma
-3.0% appreciation · 1.75% rent growth · sell at horizon
- IRR
- -12.5%
- Equity multiple
- 0.56×
- Total profit
- $-22,411
- Equity at exit
- $26,824
- IRR
- -5.8%
- Equity multiple
- 0.65×
- Total profit
- $-17,714
- Equity at exit
- $15,554
Cash invested: $50,372 (down + closing). Projections, not guarantees.
Landlord ↔ Tenant lean methodology
- Overall (STATE)
- 87 Strongly Landlord-Friendly
- State Florida
- 87 Strongly Landlord-Friendly · R+3
- County
- — inherits STATE
- City
- — inherits STATE
ZIP-level market 33064
- Home prices YoY
- -18.7%
- Rents YoY
- 1.8%
- Active inventory
- 591
- Price-to-rent
- 6.6×
Monthly cashflow live
- Estimated rent
- $2,275 high interval (Pro) →
- Mortgage (P&I)
- −$943
- Tax from tax record
- −$44 /mo · $528/yr
- Insurance
- −$75
- HOA
- −$589
- Vacancy / Maint / Mgmt
- −$478
- Net cashflow
- $146
Break-even live
UW: 25.0% down · 7.5% · 30yr · 1.5% tax · 5.0% vac · 8.0% maint · 8.0% mgmt
Financing live
Cash to close
- Down payment
- $44,975
- Closing costs
- $5,397
- Reserves months
- —
- Total cash needed
- —
Loan-product check · same deal, 3 products live
Conventional
25% down · 7.5% · 30yr
- Down + closing
- —
- Monthly P&I
- —
- Monthly cashflow
- —
- DSCR
- —
- Eligible?
- —
Personal DTI + credit; lowest rate.
DSCR
20% down · 8.5% · 30yr
- Down + closing
- —
- Monthly P&I
- —
- Monthly cashflow
- —
- DSCR
- —
- Eligible?
- —
No personal income docs; deal must DSCR.
Hard money
10% down · 12.0% · 12mo
- Down + closing
- —
- Monthly P&I
- —
- Monthly cashflow
- —
- DSCR
- —
- Eligible?
- —
Short-term bridge; refi at stabilization.
Rent comps 40 comps
| Address | Beds | Baths | Sqft | Rent | $/sqft | DOM | Units | Dist |
|---|---|---|---|---|---|---|---|---|
| 4491 Crystal Lake Dr Unit 201A Pompano Beach, FL | 2.0 | 2.0 | 1275 | $2,700 | $2.12 | 19d | 1 | 0.15mi |
| 1421 NW 45th St #5 Deerfield Beach, FL | 2.0 | 2.0 | 760 | $2,000 | $2.63 | 24d | 1 | 0.20mi |
| 4040 Crystal Lake Dr #101 Deerfield Beach, FL | 2.0 | 2.0 | 1380 | $2,350 | $1.70 | 8d | 1 | 0.21mi |
| 4040 Crystal Lake Dr #101 Deerfield Beach, FL | 2.0 | 2.0 | 1346 | $2,350 | $1.75 | 19d | 1 | 0.21mi |
| 4550 NW 18th Ave #506 Deerfield Beach, FL | 2.0 | 2.0 | 1070 | $2,100 | $1.96 | 11d | 1 | 0.23mi |
| 4020 Crystal Lake Dr #209 Deerfield Beach, FL | 2.0 | 2.0 | 1380 | $2,350 | $1.70 | 24d | 1 | 0.23mi |
| 4570 NW 18th Ave #605 Deerfield Beach, FL | 1.0 | 2.0 | 930 | $1,750 | $1.88 | 15d | 1 | 0.32mi |
| 3910 Crystal Lake Dr #201 Deerfield Beach, FL | 2.0 | 2.0 | 884 | $2,000 | $2.26 | 24d | 1 | 0.34mi |
| 3808 Crystal Lake Dr Pompano Beach, FL | 3.0 | 2.0 | 1242 | $2,830 | $2.28 | 24d | 1 | 0.45mi |
| 4329 Veleiros Ave Pompano Beach, FL | 3.0 | 2.5 | 1479 | $3,499 | $2.37 | 24d | 1 | 0.47mi |
| 1001 NW 45th St #6 Deerfield Beach, FL | 2.0 | 2.0 | 850 | $2,200 | $2.59 | 15d | 1 | 0.50mi |
| 3801 Crystal Lake Dr Deerfield Beach, FL | 1.0–2.0 | 1.0–2.0 | 968 | $2,325 | $2.40 | 2d | 8 | 0.50mi |
| 1101 Crystal Lake Dr #203 Deerfield Beach, FL | 2.0 | 2.0 | 930 | $2,200 | $2.37 | 24d | 1 | 0.53mi |
| 4321 NW 9th Ave #204 Deerfield Beach, FL | 2.0 | 2.0 | 1360 | $2,350 | $1.73 | 8d | 1 | 0.55mi |
| 4061 NW 9th Ave #206 Deerfield Beach, FL | 2.0 | 2.0 | 800 | $1,900 | $2.38 | 24d | 1 | 0.57mi |
| 1021 Crystal Lake Dr #203 Deerfield Beach, FL | 2.0 | 2.0 | 890 | $1,800 | $2.02 | 15d | 1 | 0.57mi |
| 4053 Eastridge Dr Deerfield Beach, FL | 3.0 | 2.5 | 1478 | $3,300 | $2.23 | 24d | 1 | 0.61mi |
| 3901 NW 9th Ave Deerfield Beach, FL | 2.0 | 2.0 | 800 | $1,995 | $2.49 | 24d | 1 | 0.62mi |
| 941 Crystal Lake Dr #302 Deerfield Beach, FL | 2.0 | 2.0 | 882 | $1,890 | $2.14 | 15d | 1 | 0.63mi |
| 3550 Blue Lake Dr Pompano Beach, FL | 1.0 | 1.5 | 850 | $1,850 | $2.18 | 24d | 1 | 0.64mi |
| 3590 Blue Lake Dr #504 Pompano Beach, FL | 2.0 | 2.0 | 1150 | $2,200 | $1.91 | 24d | 1 | 0.67mi |
| 3500 Blue Lake Dr #101 Pompano Beach, FL | 1.0 | 1.5 | 850 | $1,900 | $2.24 | 24d | 1 | 0.67mi |
| 3400 Blue Lake Dr Pompano Beach, FL | 2.0 | 2.0 | 1039 | $2,288 | $2.20 | 24d | 2 | 0.67mi |
| 4304 NW 9th Ave Unit 2-2D Pompano Beach, FL | 2.0 | 2.0 | 1040 | $1,750 | $1.68 | 15d | 1 | 0.68mi |
| 4314 NW 9th Ave Deerfield Beach, FL | 1.0–2.0 | 1.5–2.0 | 992 | $1,940 | $1.95 | 15d | 2 | 0.68mi |
| 4344 NW 9th Ave Unit 10-2B Pompano Beach, FL | 2.0 | 2.0 | 1290 | $1,730 | $1.34 | 24d | 1 | 0.68mi |
| 4394 NW 9th Ave Unit 20-1A Deerfield Beach, FL | 2.0 | 2.0 | 950 | $1,700 | $1.79 | 24d | 1 | 0.68mi |
| 4354 NW 9th Ave Unit 12-3D Pompano Beach, FL | 2.0 | 2.0 | 1040 | $2,000 | $1.92 | 24d | 1 | 0.68mi |
| 3450 Blue Lake Dr #107 Pompano Beach, FL | 2.0 | 2.0 | 1150 | $2,200 | $1.91 | 3d | 1 | 0.69mi |
| 4450 Military Trl Unit 22 Pompano Beach, FL | 2.0 | 1.0 | 940 | $1,950 | $2.07 | 24d | 1 | 0.69mi |
| 3400 Blue Lake Dr #401 Pompano Beach, FL | 2.0 | 2.0 | 1150 | $2,400 | $2.09 | 22d | 1 | 0.71mi |
| 887 Crystal Lake Dr Deerfield Beach, FL | 2.0 | 1.5 | 1380 | $2,670 | $1.93 | 24d | 1 | 0.72mi |
| 887 Crystal Lake Dr Deerfield Beach, FL | 2.0 | 1.5 | 1132 | $2,450 | $2.16 | 14d | 1 | 0.72mi |
| 858 Crystal Lake Dr #858 Pompano Beach, FL | 2.0 | 2.0 | 987 | $2,200 | $2.23 | 24d | 1 | 0.76mi |
| 3313 Quail Close #3313 Pompano Beach, FL | 3.0 | 2.5 | 1420 | $2,500 | $1.76 | 24d | 1 | 0.77mi |
| 661 Cypress Lake Blvd Unit I20 Deerfield Beach, FL | 3.0 | 2.0 | 974 | $2,300 | $2.36 | 24d | 1 | 0.82mi |
| 661 Cypress Lake Blvd Unit I20 Deerfield Beach, FL | 3.0 | 2.0 | 974 | $2,250 | $2.31 | 1d | 1 | 0.82mi |
| 2173 Discovery Cir W Deerfield Beach, FL | 2.0 | 2.0 | 1126 | $2,950 | $2.62 | 3d | 1 | 0.85mi |
| 671 Cypress Lake Blvd Unit D21 Deerfield Beach, FL | 3.0 | 2.0 | 974 | $2,250 | $2.31 | 12d | 1 | 0.85mi |
| 800 Cypress Park Way Unit F1 Deerfield Beach, FL | 2.0 | 2.0 | 807 | $2,000 | $2.48 | 24d | 1 | 0.85mi |
HOA detail condo
- Monthly dues
- $589 · $7,068/yr
- Likely covers
- poolparking
- Assessments
- None detected in remarks — confirm with the listing agent.
Listing history 21 events
-
2026-06-18days on market $179,900 Active 60 DOM
-
2026-06-17days on market $179,900 Active 59 DOM
-
2026-06-16days on market $179,900 Active 58 DOM
-
2026-06-15days on market $179,900 Active 57 DOM
-
2026-06-13days on market $179,900 Active 55 DOM
-
2026-06-09days on market $179,900 Active 51 DOM
-
2026-06-08days on market $179,900 Active 50 DOM
-
2026-06-07days on market $179,900 Active 49 DOM
-
2026-06-04days on market $179,900 Active 46 DOM
-
2026-06-03days on market $179,900 Active 45 DOM
-
2026-06-02days on market $179,900 Active 44 DOM
-
2026-06-01days on market $179,900 Active 43 DOM
-
2026-05-31days on market $179,900 Active 42 DOM
-
2026-05-12price $179,900
-
2026-04-19$185,000 Active
-
2006-10-22historical
-
2006-06-17$179,800
-
2003-10-17soldstatus $85,000
-
2000-10-20soldstatus $50,500
-
1997-10-17soldstatus $40,000
-
1982-04-01soldstatus $65,000
ⓘ Source: listings_history table (triggers on properties + properties_extension) + one-shot
backfill from property_details.listing_events for pre-trigger history.
Tax reassessment forecast FL · Resets to sale price
- Current annual tax
- $528 · $44/mo
- Projected year-2 tax
- $1,493 · $124/mo
- Expected delta
- +$966/yr (+$80/mo · 183.1%)
ⓘ Screening estimate from a state-policy table — verify with the county assessor before closing.
Climate risk First Street
- Flood 1/10 Low FEMA zone X (unshaded) · 0% chance over 30 yrs
- Wildfire 1/10 Low
- Heat 9/10 Extreme 7 d/yr ≥107°F today · 26 d/yr by 30 yrs out
- Wind 10/10 Extreme 99% chance of damaging wind over 30 yrs
- Air quality 2/10 Low 1 unhealthy d/yr today · 3 by 30 yrs out
Nearby sold comps map
Loading sold comps map…
Walkable amenities ~0.75 mi
Loading nearby amenities…
Taxation est. · year 1
- Rental income
- $27,297
- − Mortgage interest
- −$10,077
- − Property taxes
- −$528
- − Insurance
- −$900
- − Repairs & maintenance
- −$2,184
- − Management
- −$2,184
- − HOA
- −$7,068
- − Depreciation
- −$5,233
- Taxable loss
- −$876
- Est. tax savings @ 24.0%
- +$210
- After-tax cash flow
- $1,959/yr
For passive investors: Depreciation is non-cash, so a rental often shows a tax loss while cash-flowing — sheltering income. Rental losses are passive: they offset passive income freely, and up to $25,000/yr can offset ordinary (W-2) income if you actively participate and your MAGI is under $100k (phasing out to $0 by $150k); unused losses carry forward. On sale, claimed depreciation is recaptured at up to 25%, and gains may owe capital-gains tax (a 1031 exchange can defer both). Figures are a year-1 estimate at your 24.0% rate — not tax advice; consult a CPA.
Schools (NCES district)
- District
- Broward
- NCES district ID
- 1200180
- Math proficiency
- 42% ▼ -18.00%
- Reading proficiency
- 53% ▼ -5.00%
- Median HH income
- $52,139
- Composite
- 40.88/100
- National rank
- #3621
- State rank
- #46 of 73 in FL
Livability — Deerfield Beach
- Score
- 75/100
- State rank
- #250
- US rank
- #3970
Category grades
Schools grade is shown separately in the Schools card above.
Census & demographics
- Census place
- Deerfield Beach, FL
- County
- Broward County · 1,963,430 people
- City population
- 61,449
- Metro
- Miami-Fort Lauderdale-Pompano Beach, FL
- Population (ZIP)
- 64,563
- Household income
- $71,301
- Rent vs Own
- Severe rent burden
- 2907.0
Population outlook (Broward County) Hauer SSP2
- Today (2025)
- 2,207,033 people
- By 2030
- 2,360,704 · +7.0%
- By 2040
- 2,661,208 · +20.6%
- By 2050
- 2,946,698 · +33.5%
- By 2075
- 3,602,273 · +63.2%
- By 2100
- 3,970,984 · +79.9%
Race, ethnicity, and origin ACS 2023
- Neighborhood character
- Highly diverse neighborhood (Simpson 0.75)
- Race & ethnicity
- White 34% Hispanic / Latino 27% Black 25% Two or more races 24% Asian 2%
- Hispanic origin (detail)
- Mexican 4% Puerto Rican 4% Cuban 4% Dominican 2%
- Common ancestry
- Hispanic 13% Estonian 10% Romanian 1%
- Foreign-born
- 43% · Canada, Jamaica, Dominican Republic
- Languages at home
- 45% English-only · Spanish 23% French/Haitian/Cajun 16% Other Indo-European 13%
Political lean MEDSL · Broward
- 2024 margin
- D (+17.0) · D 58.0% · R 41.0%
- 2008→2024 swing
- -17.8pp toward R · 2008: 34.7pp · 2024: 17.0pp
- All cycles
- 2024: D+17.0 2020: D+29.8 2016: D+35.0 2012: D+34.9 2008: D+34.7
Not yet ingested
- Civics
- —
Market trends
- HPI YoY
- ▼ -109.09%
- Current HPI
- 474.7007
- Rent YoY
- ▲ 1.75%
- Metro
- Miami-Fort Lauderdale-Pompano Beach, FL
- State GDP YoY
- ▲ 3.28%
- F500 in state
- 36
Industry mix (Fortune 500 HQ in FL)
| Industry | F500 HQs | Revenue |
|---|---|---|
| Industrial Technology | 2 | $29B |
|
||
| Insurance | 2 | $17B |
|
||
| Retail | 1 | $60B |
|
||
| Technology Distribution | 1 | $58B |
|
||
| Homebuilding | 1 | $35B |
|
||
| Technology Manufacturing | 1 | $35B |
|
||
Price history
+176.8% since first listed8 events — show timeline
- 2026-05-12 Price Changed $179,900 Beaches MLS
- 2026-04-19 Listed $185,000 Beaches MLS
- 2006-10-22 Listing Removed — Beaches MLS
- 2006-06-17 Listed $179,800 Beaches MLS
- 2003-10-17 Sold (Public Records) $85,000 Public Records
- 2000-10-20 Sold (Public Records) $50,500 Public Records
- 1997-10-17 Sold (Public Records) $40,000 Public Records
- 1982-04-01 Sold (Public Records) $65,000 Public Records
Property tax history
+4.5%/yrLatest (2025): $528 · +10.1% YoY. Source: county tax records.
Cash-flow waterfall
monthlySold comps — $/sqft
last 12 mo · ≤1 miLoading sold comps…