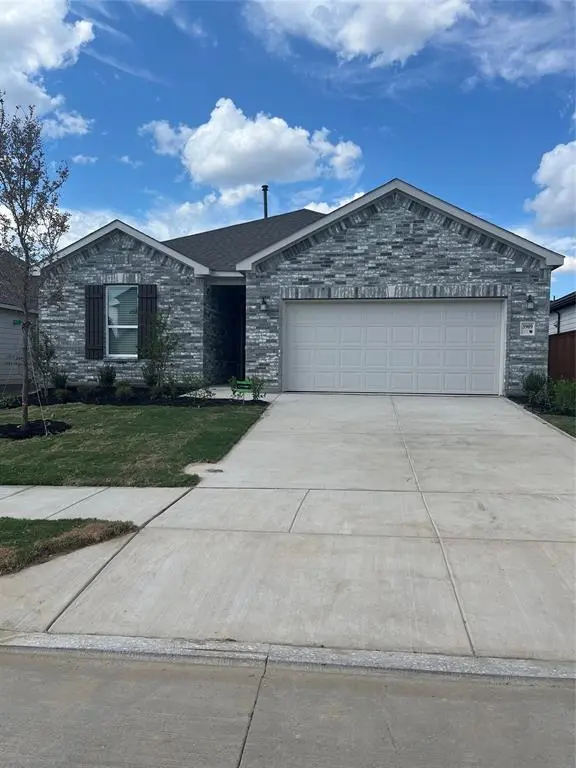
3909 Belleview Pl · Heartland, TX
Flood risk 1/10 · Minimal
- FEMA flood zone
- X (unshaded)
- Chance of flooding over 30 yrs
- 0.0%
- Est. flood insurance / yr
- $507 – $1,088
Fire risk 5/10 · Moderate
- Est. fire insurance / yr
- $1,222 – $2,270
Heat risk 7/10 · Major
- Hot days now (above 110°F)
- 7 days/yr
- Hot days in 30 yrs
- 24 days/yr
Wind risk 6/10 · Moderate
- Chance of severe wind over 30 yrs
- 27.0%
Air-quality risk 2/10 · Minimal
- Unhealthy air days now
- 1 days/yr
- Unhealthy air days in 30 yrs
- 1 days/yr
Risk factors via First Street. Map © Google.
Why this score? — see what drove the B- grade
The composite is a weighted blend of 9 inputs, each scored 0–100. Each bar is that input's sub-score; the figure is the points it added to the 100-point composite (weight × sub-score).
- Cash flow +30.0/30.0
- 1% rule +10.0/10.0
- DSCR +10.0/10.0
- ARV discount +7.5/15.0
- Schools +3.6/10.0
- Rent growth +2.5/5.0
- Livability +2.5/5.0
- Condition / age +2.5/5.0
- Appreciation +0.0/10.0
$145,555
🖨 Deal sheet 📄 Offer letter ✓ Due diligence
Listing remarks
Investor Opportunity knocks in Heartland! MOTIVATED SELLER!!! This 2024 build has 4-bedroom, 2-bath home offers a rare chance for the right buyer to restore and capitalize on value in a growing community. Featuring an open-concept layout, the home was designed for modern living with a seamless flow between the living, kitchen, and dining areas. The exterior brick remains in solid condition, providing a strong foundation for renovation and curb appeal. Interior repairs are needed due to fire damage, with impact primarily noted in the garage area and attic, making this an ideal project for experienced investors or cash buyers looking to customize and rebuild. Located in the desirable Heartla
Key facts
- Open-concept layout
- Exterior brick
- 6,055 sq ft lot
Tags
Property features AI
Finance
- Financial info: Listing terms: Cash
- HOA & community: Mandatory association; Semi-annual HOA fee of $300; HOA managed by CCMC; Association covers full use of facilities and grounds maintenance
Exterior
- Parking: Attached 2-car garage; 2 covered parking spaces; Garage faces front
- Utilities: Electricity available; Phone service available; Located in a municipal utility district
- Home design: Single-family residence; One story; Residential property; Subdivision: Heartland Ph 21
- Construction: Built in 2024; Composition roof; Not attached to another property
- Exterior features: Wood fencing; Sidewalks
Interior
- Kitchen: Refrigerator included
- Bedrooms: Primary bedroom on level 1 (approx. 17 x 14); Total of 4 bedrooms
- Flooring: Carpet; Laminate
- Bathrooms: 2 full bathrooms
- Interior features: Kitchen island; Open floorplan; Pantry; One living area; One dining area; Room count includes main living spaces
- Laundry & utility: Full-size washer/dryer area
Neighborhood map
What this means for you Summary
Snapshot
- This is a 4-bed/2.0-bath land listed at $146k.
Deal economics
- At list price, monthly cash flow is $1k ($13k/yr) — positive.
- The deal already cash-flows at list — no discount required.
- Meets the 1% rule at list price ($3k rent vs $146k).
- Recommended offer: $143k (1.5% below list) — sets the bar for market timing.
- Cap rate 15.0% vs local median 4.6% in Heartland — top-decile yield for the area; either an underpriced asset or a hidden risk that comps aren't pricing in. Stress-test before assuming the spread holds.
Location & tenants
- Location reads: area grade B — affects rentability + tenant quality, not the cash-flow math above.
- Crandall ISD (rural): math 36% / reading 42% proficiency, ranked #351 of 826 in TX (top 42%) — families likely to look elsewhere, expect single-tenant / working-renter base with shorter leases.
- Market conditions: 787 active listings in the ZIP; 12 comparable units currently listed for rent nearby; rentals at typical pace (median 19d on market — plan ~3-4 weeks tenant-placement turnaround); solid renter incomes; 1,747 units permitted in Kaufman County in 2024 (180 in 5+ unit buildings).
- This rent runs 36% of the median local income ($88k/yr) — at the standard rent-burdened threshold; future hikes will face affordability resistance.
Forward outlook
- Local home prices are declining (-3.0%/yr); year-one equity from $1k of loan paydown is wiped out by about $4k of value loss. Plan a longer hold.
- Kaufman County population projected at +43% by 2050 — long-run rental-demand tailwind backs the buy-and-hold thesis.
- At projected returns (-3.0% appreciation + 3.0% rent growth), your $41k cash investment doubles in ~4 years — after that, you're playing with house money.
Negotiation context
- It's been on market 24 days — a 2% lower offer ($143k) is reasonable based on typical stale-listing flexibility.
- 2 sale attempts; this cycle's ask has dropped $19k (12%) from the opening price — seller is motivated, your offer sets the floor, not the list.
Risks & watch-outs
- Climate carrying-cost: major wind risk, 27% chance of damaging wind over 30y; moderate wildfire risk; extreme-heat days projected 7→24/yr by 2055 (HVAC capex compounding) — expect insurance premiums to compound above CPI over the hold.
Questions for the listing agent
- What does the HOA fee cover, when was the last increase, and are there any pending special assessments or reserve-fund shortfalls?
- Is there a deadline driving the sale (1031 exchange, divorce, estate, relocation)? That informs how much negotiation room exists.
- What's the average days-on-market for RENTAL listings here right now (not sales)? A rising rental-DOM trend means longer vacancies and softer asking-rent achievability than the comps imply.
- What's the recent tenant-quality profile in this submarket — average credit score on applications, eviction rate, late-payment / NSF rate, and stable-employment percentage? A property-management company in the area should have these aggregated.
- How much new for-sale + rental construction is in the pipeline within 1–3 miles? Heavy new supply typically softens prices + rents 12–24 months out; constrained supply supports both.
Investment metrics
- 1% rule
- 1.83% ✓
- Cap rate
- 14.97%
- Cash-on-cash
- 31.01%
- DSCR
- 2.38
- GRM
- 4.5
CMA / ARV
- ARV (median comp)
- $330,121
- List price
- $145,555
- Delta
- -55.91%
- Verdict
- UNDERPRICED
- Comps
- 20 within 1.0 mi
Projected returns pro-forma
-3.0% appreciation · 3.0% rent growth · sell at horizon
- IRR
- 25.8%
- Equity multiple
- 2.07×
- Total profit
- $43,553
- Equity at exit
- $21,703
- IRR
- 33.5%
- Equity multiple
- 4.06×
- Total profit
- $124,576
- Equity at exit
- $12,585
Cash invested: $40,755 (down + closing). Projections, not guarantees.
Landlord ↔ Tenant lean methodology
- Overall (STATE)
- 87 Strongly Landlord-Friendly
- State Texas
- 87 Strongly Landlord-Friendly · R+5
- County
- — inherits STATE
- City
- — inherits STATE
ZIP-level market 75114
- Home prices YoY
- -26.7%
- Active inventory
- 787
- Price-to-rent
- 4.5×
Monthly cashflow live
- Estimated rent
- $2,670 high interval (Pro) →
- Mortgage (P&I)
- −$763
- Tax est. 1.5%
- −$182 /mo · $2,183/yr
- Insurance
- −$61
- HOA
- −$50
- Vacancy / Maint / Mgmt
- −$561
- Net cashflow
- $1,053
Break-even live
UW: 25.0% down · 7.5% · 30yr · 1.5% tax · 5.0% vac · 8.0% maint · 8.0% mgmt
Financing live
Cash to close
- Down payment
- $36,389
- Closing costs
- $4,367
- Reserves months
- —
- Total cash needed
- —
Loan-product check · same deal, 3 products live
Conventional
25% down · 7.5% · 30yr
- Down + closing
- —
- Monthly P&I
- —
- Monthly cashflow
- —
- DSCR
- —
- Eligible?
- —
Personal DTI + credit; lowest rate.
DSCR
20% down · 8.5% · 30yr
- Down + closing
- —
- Monthly P&I
- —
- Monthly cashflow
- —
- DSCR
- —
- Eligible?
- —
No personal income docs; deal must DSCR.
Hard money
10% down · 12.0% · 12mo
- Down + closing
- —
- Monthly P&I
- —
- Monthly cashflow
- —
- DSCR
- —
- Eligible?
- —
Short-term bridge; refi at stabilization.
Rent comps 12 comps
| Address | Beds | Baths | Sqft | Rent | $/sqft | DOM | Units | Dist |
|---|---|---|---|---|---|---|---|---|
| 4101 Valley Mills Dr Crandall, TX | 4.0 | 2.5 | 2278 | $2,550 | $1.12 | 1d | 1 | 0.12mi |
| 3011 Temple Gate Ct Crandall, TX | 5.0 | 3.0 | 2730 | $3,300 | $1.21 | 1d | 1 | 0.63mi |
| 3028 Willow Wood Ct Crandall, TX | 3.0 | 2.5 | 1764 | $2,600 | $1.47 | 43d | 1 | 0.73mi |
| 1968 Marble Ln Forney, TX | 3.0 | 2.5 | 2051 | $2,350 | $1.15 | 15d | 1 | 0.74mi |
| 3750 Honey Daisy Dr Crandall, TX | 4.0 | 3.5 | 2885 | $2,750 | $0.95 | 10d | 1 | 0.83mi |
| 3004 Dakota Trl Crandall, TX | 4.0 | 2.0 | 1938 | $2,300 | $1.19 | 3d | 1 | 0.85mi |
| 3147 Blossom Trl Crandall, TX | 4.0 | 3.0 | 2177 | $2,700 | $1.24 | 43d | 1 | 0.86mi |
| 4121 Gaillardia Way Forney, TX | 4.0 | 2.0 | 2135 | $2,250 | $1.05 | 18d | 1 | 1.00mi |
| 4005 Indian Paintbrush Ln Forney, TX | 4.0 | 2.5 | 2866 | $2,700 | $0.94 | 12d | 1 | 1.06mi |
| 3916 Ford Dr Heartland, TX | 4.0 | 3.0 | 2484 | $2,600 | $1.05 | 20d | 1 | 1.11mi |
| 2237 Mustang Ghost Trl Crandall, TX | 3.0 | 2.0 | 1952 | $2,040 | $1.05 | 43d | 1 | 1.23mi |
| 4009 Bighorn Dr Forney, TX | 4.0 | 2.5 | 2515 | $2,499 | $0.99 | 43d | 1 | 1.35mi |
HOA detail
- Monthly dues
- $50 · $600/yr
Listing history 5 events
-
2026-05-16price $145,555 1034-char remark
-
2026-05-13status Active 1034-char remark
-
2026-05-09status Pending 1034-char remark
-
2026-05-04price $154,999 1034-char remark
-
2026-04-29$164,999 Active 1034-char remark
ⓘ Source: listings_history table (triggers on properties + properties_extension) + one-shot
backfill from property_details.listing_events for pre-trigger history.
Climate risk First Street
- Flood 1/10 Low FEMA zone X (unshaded) · 0% chance over 30 yrs
- Wildfire 5/10 Major
- Heat 7/10 Severe 7 d/yr ≥110°F today · 24 d/yr by 30 yrs out
- Wind 6/10 Major 27% chance of damaging wind over 30 yrs
- Air quality 2/10 Low 1 unhealthy d/yr today · 1 by 30 yrs out
Nearby sold comps map
Loading sold comps map…
Walkable amenities ~0.75 mi
Loading nearby amenities…
Taxation est. · year 1
- Rental income
- $32,034
- − Mortgage interest
- −$8,153
- − Property taxes
- −$2,183
- − Insurance
- −$728
- − Repairs & maintenance
- −$2,563
- − Management
- −$2,563
- − HOA
- −$600
- − Depreciation
- −$4,234
- Taxable income
- $11,010
- Est. tax owed @ 24.0%
- −$2,642
- After-tax cash flow
- $9,994/yr
For passive investors: Depreciation is non-cash, so a rental often shows a tax loss while cash-flowing — sheltering income. Rental losses are passive: they offset passive income freely, and up to $25,000/yr can offset ordinary (W-2) income if you actively participate and your MAGI is under $100k (phasing out to $0 by $150k); unused losses carry forward. On sale, claimed depreciation is recaptured at up to 25%, and gains may owe capital-gains tax (a 1031 exchange can defer both). Figures are a year-1 estimate at your 24.0% rate — not tax advice; consult a CPA.
Schools (NCES district)
- District
- Crandall ISD
- NCES district ID
- 4815510
- Math proficiency
- 36% ▼ -13.00%
- Reading proficiency
- 42% ▼ -8.00%
- Median HH income
- $70,076
- Composite
- 35.57/100
- National rank
- #4901
- State rank
- #351 of 826 in TX
Livability — Heartland
No livability data for this city. (Only ~50 U.S. cities are tracked.)
Census & demographics
- Census place
- Heartland, TX
- County
- Kaufman County · 122,338 people
- Metro
- Dallas-Fort Worth-Arlington, TX
- Population (ZIP)
- 9,333
- Household income
- $88,013
- Rent vs Own
- Severe rent burden
- 33.0
Population outlook (Kaufman County) Hauer SSP2
- Today (2025)
- 138,716 people
- By 2030
- 150,815 · +8.7%
- By 2040
- 174,877 · +26.1%
- By 2050
- 198,020 · +42.8%
- By 2075
- 251,908 · +81.6%
- By 2100
- 285,325 · +105.7%
Race, ethnicity, and origin ACS 2023
- Neighborhood character
- Diverse neighborhood (Simpson 0.62)
- Race & ethnicity
- White 48% Hispanic / Latino 36% Two or more races 14% Black 14%
- Hispanic origin (detail)
- Mexican 34%
- Common ancestry
- Slovak 1%
- Foreign-born
- 18% · Canada, China
- Languages at home
- 71% English-only · Spanish 27% Other Indo-European 1%
Political lean MEDSL · Kaufman
- 2024 margin
- Strong R (+27.9) · D 35.6% · R 63.5%
- 2008→2024 swing
- +7.9pp toward D · 2008: -35.8pp · 2024: -27.9pp
- All cycles
- 2024: R+27.9 2020: R+33.9 2016: R+47.0 2012: R+44.4 2008: R+35.8
Not yet ingested
- Civics
- —
Market trends
- HPI YoY
- ▼ -71.61%
- Current HPI
- 196.4773
- Rent YoY
- —
- Metro
- Dallas-Fort Worth-Arlington, TX
- State GDP YoY
- ▲ 3.95%
- F500 in state
- 110
Industry mix (Fortune 500 HQ in TX)
| Industry | F500 HQs | Revenue |
|---|---|---|
| Energy | 16 | $1,198B |
|
||
| Technology | 5 | $198B |
|
||
| Engineering / Construction | 4 | $72B |
|
||
| Energy Services | 3 | $60B |
|
||
| Utilities | 3 | $41B |
|
||
| Healthcare | 2 | $330B |
|
||
Price history
-11.8% since first listed9 events — show timeline
- 2026-06-09 Sold (Public Records) — Public Records
- 2026-06-05 Sold (MLS) — NTREIS
- 2026-05-27 Pending — NTREIS
- 2026-05-23 Contingent — NTREIS
- 2026-05-16 Price Changed $145,555 NTREIS
- 2026-05-13 Relisted — NTREIS
- 2026-05-09 Pending — NTREIS
- 2026-05-04 Price Changed $154,999 NTREIS
- 2026-04-29 Listed $164,999 NTREIS
Property tax history
+223.5%/yrLatest (2025): $11,342 · +576.5% YoY. Source: county tax records.
Cash-flow waterfall
monthlySold comps — $/sqft
last 12 mo · ≤1 miLoading sold comps…