 Fourplex
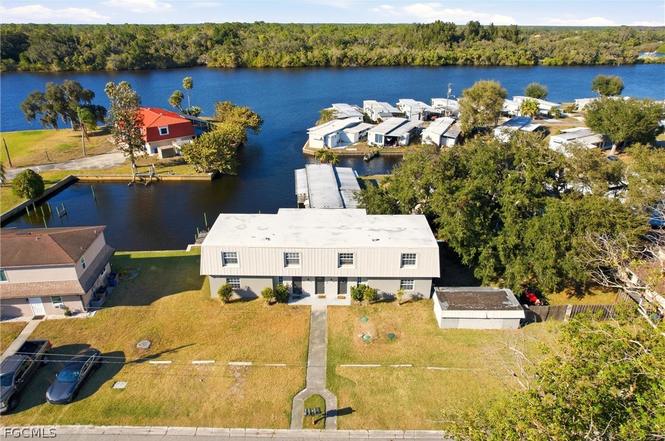
14938 Wise Way · Fort Myers Shores, FL
Flood risk 7/10 · Major
- FEMA flood zone
- AE
- Chance of flooding over 30 yrs
- 0.98%
- Est. flood insurance / yr
- $1,737 – $8,500
Fire risk 4/10 · Minor
- Est. fire insurance / yr
- $947 – $1,759
Heat risk 10/10 · Severe
- Hot days now (above 107°F)
- 7 days/yr
- Hot days in 30 yrs
- 30 days/yr
Wind risk 10/10 · Severe
- Chance of severe wind over 30 yrs
- 99.0%
Air-quality risk 2/10 · Minimal
- Unhealthy air days now
- 1 days/yr
- Unhealthy air days in 30 yrs
- 1 days/yr
Risk factors via First Street. Map © Google.
Why this score? — see what drove the C grade
The composite is a weighted blend of 9 inputs, each scored 0–100. Each bar is that input's sub-score; the figure is the points it added to the 100-point composite (weight × sub-score).
- Cash flow +23.2/30.0
- ARV discount +7.5/15.0
- DSCR +7.4/10.0
- 1% rule +5.0/10.0
- Schools +4.1/10.0
- Livability +3.5/5.0
- Condition / age +2.5/5.0
- Rent growth +1.8/5.0
- Appreciation +0.0/10.0
$649,990
🖨 Deal sheet 📄 Offer letter ✓ Due diligence
Multi-family units
County records classify this as Multi-Family (2-4 Unit). Listing-text estimate: 4 units. confirmed
Listing remarks MLS
Waterfront 4 plex with 2 docks. Located in Olga with direct access and river views. Excellent rental history with excellent tenants. This property has been 100% remodeled in the last 5 years. Everything is new, Seawall, docks, roof, tile through out, kitchens and baths. New Septic and drain field. Large side yard with Oaks and storage building which produced additional income.
Key facts
- Gulf access canal
- 0.32 acre lot
- Built 1971
Tags
Property features AI
Finance
- Other: Lot is irregularly shaped (dimensions 148 x 99 x 148 x 101)
- Financial info: Total of 4 units; Gross scheduled income listed as $60,600; Operating expenses listed as $18,347; Individual actual rents reported per unit: $1,150, $1,200, $1,200, $1,500; Tenants pay electricity; Pets allowed
- HOA & community: No association fee (listed as 0.0); Community amenities include boat facilities; community is non-gated
Exterior
- Parking: No parking details provided
- Security: No security details provided
- Utilities: Cable available; Public water; Septic tank sewer
- Home design: Two-story building; Resale property; Waterfront with canal access and seawall; Zoned RM-2
- Construction: Metal roof; Stucco and wood frame construction
- Exterior features: Patio; Screened lanai/porch or screened balcony for units
Interior
- Kitchen: No kitchen appliance details provided
- Bedrooms: Four 2-bedroom units (each unit listed as two bedroom)
- Flooring: Tile flooring
- Bathrooms: Four full bathrooms (one per unit)
- Heating & cooling: Central electric heating; Central electric cooling
- Interior features: Single-hung windows
- Laundry & utility: No washer/dryer or utility room details provided
Neighborhood map
What this means for you Summary
Snapshot
- This is a 4 × 2-bed/1.0-bath units multifamily listed at $650k.
Deal economics
- At list price, monthly cash flow is $747 ($9k/yr) — positive. Per door: $187/mo.
- The deal already cash-flows at list — no discount required.
- To meet the 1% rule (rent ≥ 1% of price), the offer needs to be $650k (0.1% below list).
- Recommended offer: $591k (9.0% below list) — sets the bar for market timing.
- Cap rate 8.5% vs local median 3.1% in Fort Myers Shores — top-decile yield for the area; either an underpriced asset or a hidden risk that comps aren't pricing in. Stress-test before assuming the spread holds.
Location & tenants
- Location reads 70/100 on livability (#433 in FL) — a middle-class / working-renter tenant base. Strengths: cost of living A+, housing A+, crime B; Watch: schools F, amenities F, commute F.
- Lee (suburban): math 47% / reading 50% proficiency, ranked #42 of 73 in FL (top 58%) — families likely to look elsewhere, expect single-tenant / working-renter base with shorter leases.
- Market conditions: Rents soft (-3.0%/yr); 763 active listings in the ZIP; 2 comparable units currently listed for rent nearby; 15,411 units permitted in Lee County in 2024 (4,686 in 5+ unit buildings).
- At $6,495/mo this rent would consume 108% of the median local household income ($72k/yr) (locally 1358% of renters already pay >50% of income on rent) — very limited rent-growth headroom before tenants either downsize or default.
Forward outlook
- Local home prices are declining (-3.0%/yr); year-one equity from $4k of loan paydown is wiped out by about $20k of value loss. Plan a longer hold.
- Lee County population projected at +44% by 2050 — long-run rental-demand tailwind backs the buy-and-hold thesis.
Negotiation context
- It's been on market 104 days — a 9% lower offer ($591k) is reasonable based on typical stale-listing flexibility.
- 8 sale attempts since 10y ago; this cycle's ask has dropped $50k (7%) from the opening price — seller is motivated, your offer sets the floor, not the list.
Risks & watch-outs
- Watch-outs: flood insurance adds $427/mo.
- Climate carrying-cost: in FEMA flood zone AE (mandatory federal flood insurance); severe wind risk, 99% chance of damaging wind over 30y; extreme-heat days projected 7→30/yr by 2055 (HVAC capex compounding) — expect insurance premiums to compound above CPI over the hold.
Questions for the listing agent
- It's been on market 104 days. Have you received any prior offers? Is the seller open to a 9% concession, seller financing, or rate buy-down credit?
- Can we see the unit-by-unit rent roll, current vacancy, and any below-market leases? What's the average tenancy length?
- What capital expenditures (roof, boiler, parking lot, exteriors) have been made in the last 5 years, and what's planned in the next 2?
- Built in 1971 — when were the roof, HVAC, electrical panel, plumbing, and water heater last replaced?
- What's the actual annual flood-insurance premium (NFIP or private), and is the property in a SFHA with mandatory coverage?
- Why hasn't it sold? Are there any deal-killer items the seller is aware of (foundation, flood, title, zoning, code violations)?
- Is there a deadline driving the sale (1031 exchange, divorce, estate, relocation)? That informs how much negotiation room exists.
- Schools are F-rated, which usually means shorter tenancies and higher turnover. Who's the typical renter profile here, and what's been the actual vacancy rate?
- What's the average days-on-market for RENTAL listings here right now (not sales)? A rising rental-DOM trend means longer vacancies and softer asking-rent achievability than the comps imply.
- What's the recent tenant-quality profile in this submarket — average credit score on applications, eviction rate, late-payment / NSF rate, and stable-employment percentage? A property-management company in the area should have these aggregated.
- How much new apartment / multifamily construction is in the pipeline within 1–3 miles? Heavy new supply (>2% of stock underway) typically softens rents 12–24 months out; light construction supports rent growth.
Investment metrics
- 1% rule
- 1.00% ✗
- Cap rate
- 8.46%
- Cash-on-cash
- 7.74%
- DSCR
- 1.34
- GRM
- 8.3
CMA / ARV
No comps found within radius.
Projected returns pro-forma
-3.0% appreciation · 0.0% rent growth · sell at horizon
- IRR
- -12.0%
- Equity multiple
- 0.58×
- Total profit
- $-76,751
- Equity at exit
- $96,916
- IRR
- -8.0%
- Equity multiple
- 0.57×
- Total profit
- $-79,000
- Equity at exit
- $56,199
Cash invested: $181,997 (down + closing). Projections, not guarantees.
Landlord ↔ Tenant lean methodology
- Overall (STATE)
- 87 Strongly Landlord-Friendly
- State Florida
- 87 Strongly Landlord-Friendly · R+3
- County
- — inherits STATE
- City
- — inherits STATE
ZIP-level market 33905
- Home prices YoY
- -31.4%
- Rents YoY
- -3.0%
- Active inventory
- 763
- Price-to-rent
- 33.4×
Monthly cashflow live
- Estimated rent
- $6,495 medium interval (Pro) →
- Mortgage (P&I)
- −$3,409
- Tax from tax record
- −$278 /mo · $3,336/yr
- Insurance
- −$271
- Flood insurance flood zone
- −$427 /mo · $5,118/yr
- HOA
- −$0
- Vacancy / Maint / Mgmt
- −$1,364
- Net cashflow
- $747
Break-even live
4-unit breakdown (identical units grouped — click to expand)
| Units | Beds | Baths | Est. rent |
|---|---|---|---|
| 4× units | 2 | 1 | $6,496 |
| #1 | 2 | 1 | $1,624 |
| #2 | 2 | 1 | $1,624 |
| #3 | 2 | 1 | $1,624 |
| #4 | 2 | 1 | $1,624 |
| Total (4 units) | $6,495 | ||
UW: 25.0% down · 7.5% · 30yr · 1.5% tax · 5.0% vac · 8.0% maint · 8.0% mgmt
Financing live
Cash to close
- Down payment
- $162,498
- Closing costs
- $19,500
- Reserves months
- —
- Total cash needed
- —
Loan-product check · same deal, 3 products live
Conventional
25% down · 7.5% · 30yr
- Down + closing
- —
- Monthly P&I
- —
- Monthly cashflow
- —
- DSCR
- —
- Eligible?
- —
Personal DTI + credit; lowest rate.
DSCR
20% down · 8.5% · 30yr
- Down + closing
- —
- Monthly P&I
- —
- Monthly cashflow
- —
- DSCR
- —
- Eligible?
- —
No personal income docs; deal must DSCR.
Hard money
10% down · 12.0% · 12mo
- Down + closing
- —
- Monthly P&I
- —
- Monthly cashflow
- —
- DSCR
- —
- Eligible?
- —
Short-term bridge; refi at stabilization.
Rent comps 2 comps
| Address | Beds | Baths | Sqft | Rent | $/sqft | DOM | Units | Dist |
|---|---|---|---|---|---|---|---|---|
| 14200 Duke Hwy Alva, FL | 4.0 | 2.0 | 2546 | $4,995 | $1.96 | 23d | 1 | 0.73mi |
| 2463 Nature Pointe Loop Fort Myers, FL | 4.0 | 3.0 | 2384 | $2,400 | $1.01 | 19d | 1 | 0.99mi |
Listing history 38 events
-
2026-06-17days on market $649,990 Active 104 DOM
-
2026-06-16days on market $649,990 Active 103 DOM
-
2026-06-15days on market $649,990 Active 102 DOM
-
2026-06-13days on market $649,990 Active 100 DOM
-
2026-06-10days on market $649,990 Active 97 DOM
-
2026-06-09days on market $649,990 Active 96 DOM
-
2026-06-07days on market $649,990 Active 94 DOM
-
2026-06-02days on market $649,990 Active 89 DOM
-
2026-06-01days on market $649,990 Active 88 DOM
-
2026-06-01days on market $649,990 Active 87 DOM
-
2026-05-06price $649,990
-
2026-04-08price $674,990
-
2026-03-05$699,990 Active
-
2025-07-16historical $1,200
-
2025-07-05price $1,200
-
2025-06-18price $1,250
-
2025-05-28price $1,350
-
2025-05-16price $1,400
-
2025-05-01historical $1,450
-
2025-04-23price $1,450
-
2025-04-23price $1,450
-
2025-04-01$1,500
-
2025-04-01historical $1,500
-
2025-03-30$1,500
-
2025-03-30$1,500
-
2024-07-03historical $1,500
-
2024-05-12$1,500
-
2023-08-18$1,175,000 Active
-
2021-10-19soldstatus $575,000
-
2021-10-15soldstatus $575,000 Closed 380-char remark
Show marketing remark (380 chars)
Waterfront 4 plex with 2 docks. Located in Olga with direct access and river views. Excellent rental history with excellent tenants. This property has been 100% remodeled in the last 5 years. Everything is new, Seawall, docks, roof, tile through out, kitchens and baths. New Septic and drain field. Large side yard with Oaks and storage building which produced additional income.
-
2021-08-27status Pending 380-char remark
Show marketing remark (380 chars)
Waterfront 4 plex with 2 docks. Located in Olga with direct access and river views. Excellent rental history with excellent tenants. This property has been 100% remodeled in the last 5 years. Everything is new, Seawall, docks, roof, tile through out, kitchens and baths. New Septic and drain field. Large side yard with Oaks and storage building which produced additional income.
-
2021-03-12$575,000 Active 380-char remark
Show marketing remark (380 chars)
Waterfront 4 plex with 2 docks. Located in Olga with direct access and river views. Excellent rental history with excellent tenants. This property has been 100% remodeled in the last 5 years. Everything is new, Seawall, docks, roof, tile through out, kitchens and baths. New Septic and drain field. Large side yard with Oaks and storage building which produced additional income.
-
2016-04-25price $251,000
-
2016-04-11soldstatus $251,000
-
2016-04-06soldstatus $251,000 Sold
-
2016-04-06price $269,000
-
2016-04-05status Pending
-
2016-02-09$269,000 Active
ⓘ Source: listings_history table (triggers on properties + properties_extension) + one-shot
backfill from property_details.listing_events for pre-trigger history.
Tax reassessment forecast FL · Resets to sale price
- Current annual tax
- $3,336 · $278/mo
- Projected year-2 tax
- $5,395 · $450/mo
- Expected delta
- +$2,058/yr (+$172/mo · 61.7%)
ⓘ Screening estimate from a state-policy table — verify with the county assessor before closing.
Climate risk First Street
- Flood 7/10 Severe FEMA zone AE · 98% chance over 30 yrs
- Wildfire 4/10 Moderate
- Heat 10/10 Extreme 7 d/yr ≥107°F today · 30 d/yr by 30 yrs out
- Wind 10/10 Extreme 99% chance of damaging wind over 30 yrs
- Air quality 2/10 Low 1 unhealthy d/yr today · 1 by 30 yrs out
Nearby sold comps map
Loading sold comps map…
Walkable amenities ~0.75 mi
Loading nearby amenities…
Taxation est. · year 1
- Rental income
- $77,940
- − Mortgage interest
- −$36,410
- − Property taxes
- −$3,336
- − Insurance
- −$8,368
- − Repairs & maintenance
- −$6,235
- − Management
- −$6,235
- − Depreciation
- −$18,909
- Taxable loss
- −$1,554
- Est. tax savings @ 24.0%
- +$373
- After-tax cash flow
- $9,337/yr
For passive investors: Depreciation is non-cash, so a rental often shows a tax loss while cash-flowing — sheltering income. Rental losses are passive: they offset passive income freely, and up to $25,000/yr can offset ordinary (W-2) income if you actively participate and your MAGI is under $100k (phasing out to $0 by $150k); unused losses carry forward. On sale, claimed depreciation is recaptured at up to 25%, and gains may owe capital-gains tax (a 1031 exchange can defer both). Figures are a year-1 estimate at your 24.0% rate — not tax advice; consult a CPA.
Schools (NCES district)
- District
- Lee
- NCES district ID
- 1201080
- Math proficiency
- 47% ▼ -11.00%
- Reading proficiency
- 50% ▼ -4.00%
- Median HH income
- $49,518
- Composite
- 41.49/100
- National rank
- #3458
- State rank
- #42 of 73 in FL
Livability — Fort Myers Shores
- Score
- 70/100
- State rank
- #433
- US rank
- #7747
Category grades
Schools grade is shown separately in the Schools card above.
Census & demographics
- Census place
- Fort Myers Shores, FL
- County
- Lee County · 788,662 people
- Metro
- Cape Coral-Fort Myers, FL
- Population (ZIP)
- 41,381
- Household income
- $71,987
- Rent vs Own
- Severe rent burden
- 1358.0
Population outlook (Lee County) Hauer SSP2
- Today (2025)
- 871,946 people
- By 2030
- 955,468 · +9.6%
- By 2040
- 1,113,587 · +27.7%
- By 2050
- 1,256,891 · +44.1%
- By 2075
- 1,560,270 · +78.9%
- By 2100
- 1,726,848 · +98.0%
Race, ethnicity, and origin ACS 2023
- Neighborhood character
- Diverse neighborhood (Simpson 0.59)
- Race & ethnicity
- White 53% Hispanic / Latino 34% Two or more races 17% Black 9% Native American 4% Asian 2%
- Hispanic origin (detail)
- Mexican 11% Puerto Rican 5% Cuban 2%
- Common ancestry
- Romanian 2% Slovak 2% Lithuanian 2%
- Foreign-born
- 20% · Canada, Jamaica
- Languages at home
- 68% English-only · Spanish 29% Other Indo-European 1% German/W. Germanic 1%
Political lean MEDSL · Lee
- 2024 margin
- Strong R (+28.4) · D 35.5% · R 63.9%
- 2008→2024 swing
- -18.0pp toward R · 2008: -10.4pp · 2024: -28.4pp
- All cycles
- 2024: R+28.4 2020: R+19.2 2016: R+20.4 2012: R+16.6 2008: R+10.4
Not yet ingested
- Civics
- —
Market trends
- HPI YoY
- ▼ -122.89%
- Current HPI
- 268.4598
- Rent YoY
- ▼ -2.97%
- Metro
- Cape Coral-Fort Myers, FL
- State GDP YoY
- ▲ 3.28%
- F500 in state
- 36
Industry mix (Fortune 500 HQ in FL)
| Industry | F500 HQs | Revenue |
|---|---|---|
| Industrial Technology | 2 | $29B |
|
||
| Insurance | 2 | $17B |
|
||
| Retail | 1 | $60B |
|
||
| Technology Distribution | 1 | $58B |
|
||
| Homebuilding | 1 | $35B |
|
||
| Technology Manufacturing | 1 | $35B |
|
||
Price history
+141.6% since first listed28 events — show timeline
- 2026-05-06 Price Changed $649,990 FORTMLS
- 2026-04-08 Price Changed $674,990 FORTMLS
- 2026-03-05 Listed $699,990 FORTMLS
- 2025-07-16 Rental Removed $1,200 NAPLESMLS
- 2025-07-05 Price Changed $1,200 NAPLESMLS
- 2025-06-18 Price Changed $1,250 NAPLESMLS
- 2025-05-28 Price Changed $1,350 NAPLESMLS
- 2025-05-16 Price Changed $1,400 NAPLESMLS
- 2025-05-01 Rental Removed $1,450 RENT.
- 2025-04-23 Price Changed $1,450 NAPLESMLS
- 2025-04-23 Price Changed $1,450 RENT.
- 2025-04-01 Listed for Rent $1,500 NAPLESMLS
- 2025-04-01 Rental Removed $1,500 SHOWMOJO
- 2025-03-30 Listed for Rent $1,500 RENT.
- 2025-03-30 Listed for Rent $1,500 SHOWMOJO
- 2024-07-03 Rental Removed $1,500 RENT.
- 2024-05-12 Listed for Rent $1,500 RENT.
- 2023-08-18 Listed $1,175,000 Stellar MLS as Distributed by MLS Grid
- 2021-10-19 Sold (Public Records) $575,000 Public Records
- 2021-10-15 Sold (MLS) $575,000 FORTMLS
- 2021-08-27 Pending — FORTMLS
- 2021-03-12 Listed $575,000 FORTMLS
- 2016-04-25 Price Changed $251,000 FORTMLS
- 2016-04-11 Sold (Public Records) $251,000 Public Records
- 2016-04-06 Price Changed $269,000 FORTMLS
- 2016-04-06 Sold (MLS) $251,000 FORTMLS
- 2016-04-05 Pending — FORTMLS
- 2016-02-09 Listed $269,000 FORTMLS
Property tax history
+1.3%/yrLatest (2025): $3,336 · +3.6% YoY. Source: county tax records.
Cash-flow waterfall
monthlySold comps — $/sqft
last 12 mo · ≤1 miLoading sold comps…