100 Snooze · Perezville, TX
Flood risk 6/10 · Moderate
- FEMA flood zone
- X
- Chance of flooding over 30 yrs
- 0.98%
- Est. flood insurance / yr
- $507 – $1,088
Fire risk 7/10 · Major
- Est. fire insurance / yr
- $1,222 – $2,270
Heat risk 9/10 · Severe
- Hot days now (above 112°F)
- 7 days/yr
- Hot days in 30 yrs
- 22 days/yr
Wind risk 8/10 · Major
- Chance of severe wind over 30 yrs
- 95.0%
Air-quality risk 1/10 · Minimal
- Unhealthy air days now
- 0 days/yr
- Unhealthy air days in 30 yrs
- 0 days/yr
Risk factors via First Street. Map © Google.
Why this score? — see what drove the B+ grade
The composite is a weighted blend of 9 inputs, each scored 0–100. Each bar is that input's sub-score; the figure is the points it added to the 100-point composite (weight × sub-score).
- Cash flow +30.0/30.0
- ARV discount +15.0/15.0
- 1% rule +10.0/10.0
- DSCR +10.0/10.0
- Livability +3.2/5.0
- Rent growth +2.7/5.0
- Condition / age +2.5/5.0
- Schools +1.9/10.0
- Appreciation +0.0/10.0
$69,900
🖨 Deal sheet 📄 Offer letter ✓ Due diligence
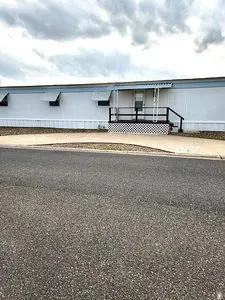
Listing remarks
For Sale: 2 Bedroom-2 Bath Mobile Home. Located in Dream Valley, Mission, Tx & acirc; & euro; & brvbar; Fully furnished, large lot, shed, canopy, new windows and flooring. 55 and over park. $69,900 firm. You own your land in this park. 450.00 a year HOA.
Key facts
- Shed
- New flooring
- Large lot
Tags
Neighborhood map
What this means for you Summary
Snapshot
- This is a 3-bed/1.0-bath manufactured listed at $70k.
Deal economics
- At list price, monthly cash flow is $566 ($7k/yr) — positive.
- The deal already cash-flows at list — no discount required.
- Meets the 1% rule at list price ($1k rent vs $70k).
- Recommended offer: $68k (3.0% below list) — sets the bar for market timing.
- Cap rate 16.0% vs local median 6.9% in Perezville — top-decile yield for the area; either an underpriced asset or a hidden risk that comps aren't pricing in. Stress-test before assuming the spread holds.
Location & tenants
- Location reads 64/100 on livability (#743 in TX) — a middle-class / working-renter tenant base. Strengths: cost of living A+, housing A+, crime A-; Watch: schools F, amenities F, commute F.
- La Joya ISD (suburban): math 18% / reading 29% proficiency, ranked #759 of 826 in TX (top 92%) — low school quality limits family demand, transient renter base, plan for 1-2y turnover.
- Market conditions: Rents flat; 852 active listings in the ZIP; 9 comparable units currently listed for rent nearby; rentals lingering (median 44d on market — plan ~5-8 weeks vacancy on turnover, expect pricing pressure); 67% of comp listings sitting > 30 days — soft ceiling on asking rent; 7,378 units permitted in Hidalgo County in 2024 (641 in 5+ unit buildings).
Forward outlook
- Local home prices are declining (-3.0%/yr); year-one equity from $483 of loan paydown is wiped out by about $2k of value loss. Plan a longer hold.
- Hidalgo County population projected at +28% by 2050 — long-run rental-demand tailwind backs the buy-and-hold thesis.
- At projected returns (-3.0% appreciation + 0.9% rent growth), your $20k cash investment doubles in ~4 years — after that, you're playing with house money.
Negotiation context
- It's been on market 37 days — a 3% lower offer ($68k) is reasonable based on typical stale-listing flexibility.
- 2 sale attempts with the ask held roughly flat each time — persistent listings suggest the price (not the market) is what's stuck; bring a comps-based counter.
Risks & watch-outs
- Climate carrying-cost: major flood risk; severe wind risk, 95% chance of damaging wind over 30y; major wildfire risk; extreme-heat days projected 7→22/yr by 2055 (HVAC capex compounding) — expect insurance premiums to compound above CPI over the hold.
Questions for the listing agent
- It's been on market 37 days. Have you received any prior offers? Is the seller open to a 3% concession, seller financing, or rate buy-down credit?
- Is there a deadline driving the sale (1031 exchange, divorce, estate, relocation)? That informs how much negotiation room exists.
- Schools are F-rated, which usually means shorter tenancies and higher turnover. Who's the typical renter profile here, and what's been the actual vacancy rate?
- What's the average days-on-market for RENTAL listings here right now (not sales)? A rising rental-DOM trend means longer vacancies and softer asking-rent achievability than the comps imply.
- What's the recent tenant-quality profile in this submarket — average credit score on applications, eviction rate, late-payment / NSF rate, and stable-employment percentage? A property-management company in the area should have these aggregated.
- How much new for-sale + rental construction is in the pipeline within 1–3 miles? Heavy new supply typically softens prices + rents 12–24 months out; constrained supply supports both.
Investment metrics
- 1% rule
- 1.85% ✓
- Cap rate
- 16.01%
- Cash-on-cash
- 34.72%
- DSCR
- 2.54
- GRM
- 4.5
CMA / ARV
- ARV (on-the-fly)
- $96,096
- Comps found
- 2
Show comp detail 2 sales within ~0.75 mi
| Address | Dist | Beds/Ba | Sqft | Sold | Price | $/sf | Match |
|---|---|---|---|---|---|---|---|
| 125 Nap St | 0.21mi | 2/2.5 (-1) | 960 (+4%) | 7mo | $70,000 | $73 | 67 |
| 7225 Monroe St | 0.41mi | 2/2.0 (-1) | 816 (-12%) | 10mo | $84,999 | $104 | 44 |
Match score weights: distance 35% · size 25% · config 20% · recency 20%. Top-matched comps best support the ARV.
Projected returns pro-forma
-3.0% appreciation · 0.93% rent growth · sell at horizon
- IRR
- 27.9%
- Equity multiple
- 2.13×
- Total profit
- $22,099
- Equity at exit
- $10,422
- IRR
- 34.2%
- Equity multiple
- 3.83×
- Total profit
- $55,293
- Equity at exit
- $6,044
Cash invested: $19,572 (down + closing). Projections, not guarantees.
Landlord ↔ Tenant lean methodology
- Overall (STATE)
- 87 Strongly Landlord-Friendly
- State Texas
- 87 Strongly Landlord-Friendly · R+5
- County
- — inherits STATE
- City
- — inherits STATE
ZIP-level market 78572
- Home prices YoY
- -22.9%
- Rents YoY
- 0.9%
- Active inventory
- 852
- Price-to-rent
- 4.5×
Monthly cashflow live
- Estimated rent
- $1,295 high interval (Pro) →
- Mortgage (P&I)
- −$367
- Tax from tax record
- −$61 /mo · $736/yr
- Insurance
- −$29
- HOA
- −$0
- Vacancy / Maint / Mgmt
- −$272
- Net cashflow
- $566
Break-even live
UW: 25.0% down · 7.5% · 30yr · 1.5% tax · 5.0% vac · 8.0% maint · 8.0% mgmt
Financing live
Cash to close
- Down payment
- $17,475
- Closing costs
- $2,097
- Reserves months
- —
- Total cash needed
- —
Loan-product check · same deal, 3 products live
Conventional
25% down · 7.5% · 30yr
- Down + closing
- —
- Monthly P&I
- —
- Monthly cashflow
- —
- DSCR
- —
- Eligible?
- —
Personal DTI + credit; lowest rate.
DSCR
20% down · 8.5% · 30yr
- Down + closing
- —
- Monthly P&I
- —
- Monthly cashflow
- —
- DSCR
- —
- Eligible?
- —
No personal income docs; deal must DSCR.
Hard money
10% down · 12.0% · 12mo
- Down + closing
- —
- Monthly P&I
- —
- Monthly cashflow
- —
- DSCR
- —
- Eligible?
- —
Short-term bridge; refi at stabilization.
Rent comps 9 comps
| Address | Beds | Baths | Sqft | Rent | $/sqft | DOM | Units | Dist |
|---|---|---|---|---|---|---|---|---|
| 1908 Kennedy St Mission, TX | 2.0 | 2.0 | 1062 | $1,300 | $1.22 | 23d | 1 | 0.35mi |
| 7220 W Interstate Highway 2 Fl STW 4 WITH PORCH) FRONT UNIT Mission, TX | 2.0 | 2.0 | 1104 | $1,150 | $1.04 | 43d | 1 | 0.64mi |
| 7220 W Interstate Highway 2 Unit 20 Mission, TX | 2.0 | 2.0 | 1104 | $995 | $0.90 | 43d | 1 | 0.68mi |
| 7220 W Interstate Highway 2 Unit 12 Mission, TX | 2.0 | 2.0 | 1104 | $995 | $0.90 | 21d | 1 | 0.68mi |
| 2503 Double Eagle Dr Mission, TX | 2.0 | 2.0 | 840 | $1,300 | $1.55 | 43d | 1 | 0.90mi |
| 3717 Clavel St Unit 8 Palmview, TX | 2.0 | 1.0 | 1005 | $800 | $0.80 | 43d | 1 | 0.90mi |
| 3711 Chapa AVE Palmview, TX | 3.0 | 2.0 | 1050 | $1,300 | $1.24 | 43d | 1 | 0.99mi |
| 3711 Chapa AVE Palmview, TX | 2.0 | 2.0 | 995 | $1,150 | $1.16 | 14d | 1 | 0.99mi |
| 3706 Chapa AVE Palmview, TX | 2.0 | 2.0 | 864 | $1,100 | $1.27 | 43d | 1 | 1.00mi |
Listing history 24 events
-
2026-06-18days on market $69,900 Active 37 DOM
-
2026-06-17days on market $69,900 Active 36 DOM
-
2026-06-16days on market $69,900 Active 35 DOM
-
2026-06-15days on market $69,900 Active 34 DOM
-
2026-06-14days on market $69,900 Active 32 DOM
-
2026-06-13days on market $69,900 Active 31 DOM
-
2026-06-10days on market $69,900 Active 29 DOM
-
2026-06-09days on market $69,900 Active 28 DOM
-
2026-06-08days on market $69,900 Active 27 DOM
-
2026-06-07days on market $69,900 Active 26 DOM
-
2026-06-05days on market $69,900 Active 23 DOM
-
2026-06-03days on market $69,900 Active 22 DOM
-
2026-06-02days on market $69,900 Active 21 DOM
-
2026-06-01days on market $69,900 Active 20 DOM
-
2026-05-31days on market $69,900 Active 19 DOM
-
2026-05-31days on market $69,900 Active 18 DOM
-
2026-05-12$69,900 Active 249-char remark
-
2025-12-20price $77,000
-
2025-11-06price $79,000
-
2025-04-12$79,900 Active
-
2025-03-19soldstatus
-
2011-02-24soldstatus
-
1996-08-09soldstatus
-
1990-12-19soldstatus
ⓘ Source: listings_history table (triggers on properties + properties_extension) + one-shot
backfill from property_details.listing_events for pre-trigger history.
Tax reassessment forecast TX · Resets to sale price
- Current annual tax
- $736 · $61/mo
- Projected year-2 tax
- $1,279 · $107/mo
- Expected delta
- +$543/yr (+$45/mo · 73.7%)
ⓘ Screening estimate from a state-policy table — verify with the county assessor before closing.
Climate risk First Street
- Flood 6/10 Major FEMA zone X · 98% chance over 30 yrs
- Wildfire 7/10 Severe
- Heat 9/10 Extreme 7 d/yr ≥112°F today · 22 d/yr by 30 yrs out
- Wind 8/10 Severe 95% chance of damaging wind over 30 yrs
- Air quality 1/10 Low 0 unhealthy d/yr today · 0 by 30 yrs out
Nearby sold comps map
Loading sold comps map…
Walkable amenities ~0.75 mi
Loading nearby amenities…
Taxation est. · year 1
- Rental income
- $15,544
- − Mortgage interest
- −$3,915
- − Property taxes
- −$736
- − Insurance
- −$350
- − Repairs & maintenance
- −$1,244
- − Management
- −$1,244
- − Depreciation
- −$2,033
- Taxable income
- $6,022
- Est. tax owed @ 24.0%
- −$1,445
- After-tax cash flow
- $5,350/yr
For passive investors: Depreciation is non-cash, so a rental often shows a tax loss while cash-flowing — sheltering income. Rental losses are passive: they offset passive income freely, and up to $25,000/yr can offset ordinary (W-2) income if you actively participate and your MAGI is under $100k (phasing out to $0 by $150k); unused losses carry forward. On sale, claimed depreciation is recaptured at up to 25%, and gains may owe capital-gains tax (a 1031 exchange can defer both). Figures are a year-1 estimate at your 24.0% rate — not tax advice; consult a CPA.
Schools (NCES district)
- District
- La Joya ISD
- NCES district ID
- 4826130
- Math proficiency
- 18% ▼ -35.00%
- Reading proficiency
- 29% ▼ -10.00%
- Median HH income
- $27,845
- Composite
- 18.65/100
- National rank
- #8891
- State rank
- #759 of 826 in TX
Livability — Perezville
- Score
- 64/100
- State rank
- #743
- US rank
- #13748
Category grades
Schools grade is shown separately in the Schools card above.
Census & demographics
- Census place
- Perezville, TX
- County
- Hidalgo County · 623,128 people
- City population
- 78,024
- Metro
- McAllen-Edinburg-Mission, TX
- Population (ZIP)
- 78,024
- Household income
- $54,298
- Rent vs Own
- Severe rent burden
- 1714.0
Population outlook (Hidalgo County) Hauer SSP2
- Today (2025)
- 955,232 people
- By 2030
- 1,009,774 · +5.7%
- By 2040
- 1,120,332 · +17.3%
- By 2050
- 1,225,036 · +28.2%
- By 2075
- 1,439,189 · +50.7%
- By 2100
- 1,533,429 · +60.5%
Race, ethnicity, and origin ACS 2023
- Neighborhood character
- Predominantly Hispanic (85%)
- Race & ethnicity
- Hispanic / Latino 85% Two or more races 47% White 12% Asian 2%
- Hispanic origin (detail)
- Mexican 80%
- Common ancestry
- Slovak 1% Portuguese 0%
- Foreign-born
- 28% · Canada, South Korea
- Languages at home
- 22% English-only · Spanish 76%
Political lean MEDSL · Hidalgo
- 2024 margin
- Toss-up / Even · D 48.1% · R 51.0%
- 2008→2024 swing
- -41.6pp toward R · 2008: 38.7pp · 2024: -2.9pp
- All cycles
- 2024: R+2.9 2020: D+17.1 2016: D+40.5 2012: D+41.8 2008: D+38.7
Not yet ingested
- Civics
- —
Market trends
- HPI YoY
- ▼ -62.35%
- Current HPI
- 209.3573
- Rent YoY
- ▲ 0.93%
- Metro
- McAllen-Edinburg-Mission, TX
- State GDP YoY
- ▲ 3.95%
- F500 in state
- 110
Industry mix (Fortune 500 HQ in TX)
| Industry | F500 HQs | Revenue |
|---|---|---|
| Energy | 16 | $1,198B |
|
||
| Technology | 5 | $198B |
|
||
| Engineering / Construction | 4 | $72B |
|
||
| Energy Services | 3 | $60B |
|
||
| Utilities | 3 | $41B |
|
||
| Healthcare | 2 | $330B |
|
||
Price history
-12.5% since first listed8 events — show timeline
- 2026-05-12 Listed $69,900 FSBO.com
- 2025-12-20 Price Changed $77,000 MCALLENMLS
- 2025-11-06 Price Changed $79,000 MCALLENMLS
- 2025-04-12 Listed $79,900 MCALLENMLS
- 2025-03-19 Sold (Public Records) — Public Records
- 2011-02-24 Sold (Public Records) — Public Records
- 1996-08-09 Sold (Public Records) — Public Records
- 1990-12-19 Sold (Public Records) — Public Records
Property tax history
+5.1%/yrLatest (2025): $736 · +16.9% YoY. Source: county tax records.
Cash-flow waterfall
monthlySold comps — $/sqft
last 12 mo · ≤1 miLoading sold comps…