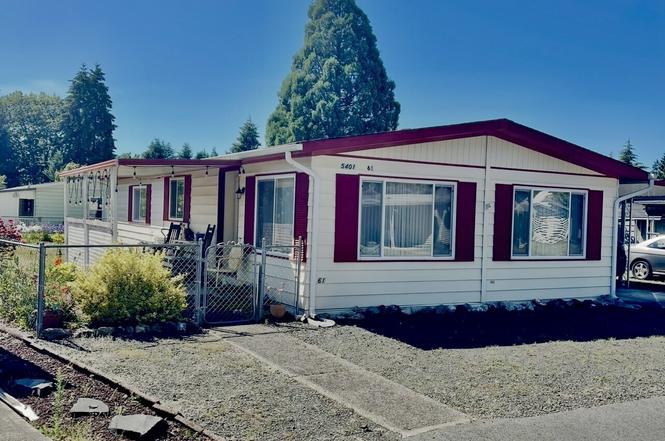
5401 Yakima Ln SE #61 · Lacey, WA
Flood risk 5/10 · Moderate
- FEMA flood zone
- X (unshaded)
- Chance of flooding over 30 yrs
- 0.66%
- Est. flood insurance / yr
- $507 – $1,088
Fire risk 3/10 · Minor
- Est. fire insurance / yr
- $604 – $1,122
Heat risk 3/10 · Minor
- Hot days now (above 88°F)
- 7 days/yr
- Hot days in 30 yrs
- 14 days/yr
Wind risk 1/10 · Minimal
- Chance of severe wind over 30 yrs
- —
Air-quality risk 6/10 · Moderate
- Unhealthy air days now
- 7 days/yr
- Unhealthy air days in 30 yrs
- 8 days/yr
Risk factors via First Street. Map © Google.
Why this score? — see what drove the B+ grade
The composite is a weighted blend of 9 inputs, each scored 0–100. Each bar is that input's sub-score; the figure is the points it added to the 100-point composite (weight × sub-score).
- Cash flow +30.0/30.0
- ARV discount +10.4/15.0
- 1% rule +10.0/10.0
- DSCR +10.0/10.0
- Schools +5.1/10.0
- Livability +4.2/5.0
- Condition / age +3.8/5.0
- Rent growth +3.4/5.0
- Appreciation +0.0/10.0
$110,000
🖨 Deal sheet 📄 Offer letter ✓ Due diligence
Listing remarks
Turn-key Lacey living in Mountain Greens all-age community! This beautifully maintained home features a bright, open-concept layout packed with premium upgrades. Enjoy newer vinyl windows, vinyl flooring, recessed lighting, newer heat-pump & water heater, and an updated kitchen with a new stove, fridge, and dishwasher. Both full bathrooms are completely refreshed. Washer, dryer, and window treatments all stay! Exterior highlights: Fully fenced yard with mature, year-round landscaping, a wonderful covered porch built for BBQs, an extra storage shed, a large carport, and a 120 sq ft insulated & powered Hobby Shop with a built-in workbench. Unbeatable Location: Close to Chehalis We
Key facts
- Vinyl flooring
- Newer heat-pump
- Newer vinyl windows
Tags
Property features AI
Finance
- Other: Buyer brokerage compensation offered: 2.5%
- Financial info: Listing terms: Conventional; Land lease amount applies
- HOA & community: Located in Mountain Greens manufactured home park; Park approved for sale; Clubhouse in the park; Approximately 174 homes in the park; Senior exemption applies; Pets allowed (see remarks); Land lease applicable
Exterior
- Parking: Carport
- Utilities: Electric energy source; Community water (City of Lacey); Sewer (City of Lacey); Power: Puget Sound Energy; Cable: Comcast; Internet: Comcast
- Home design: Manufactured home (double wide); One level; Faces south; Model: Paramount 78 48/24; Make: Bendix; Mobile home remains on site
- Construction: Metal skirt; Metal/vinyl construction materials; Composition and metal roof; Tie-down foundation; Manufactured after 6/15/1976
- Exterior features: Metal/vinyl exterior; Patio/porch/deck; Open space; Paved lot
Interior
- Kitchen: Dishwasher; Microwave; Refrigerator; Stove/Range
- Bedrooms: 2 bedrooms
- Flooring: Vinyl; Carpet
- Bathrooms: 2 full bathrooms; 2 bathtubs; 2 showers; Primary bath access (bath off primary)
- Heating & cooling: Heat pump (heating and cooling)
- Interior features: Dining room; Kitchen with eating space; Living room; Utility room; Double pane windows; Drapes; Patio/porch/deck
- Laundry & utility: Washer; Dryer; Utility room
Neighborhood map
What this means for you Summary
Snapshot
- This is a 2-bed/2.0-bath manufactured listed at $110k. Condition is rated good.
Deal economics
- At list price, monthly cash flow is $899 ($11k/yr) — positive.
- The deal already cash-flows at list — no discount required.
- Meets the 1% rule at list price ($2k rent vs $110k).
- Cap rate 16.1% vs local median 3.0% in Lacey — top-decile yield for the area; either an underpriced asset or a hidden risk that comps aren't pricing in. Stress-test before assuming the spread holds.
Location & tenants
- Location reads 85/100 on livability (#33 in WA, #581 nationally) — a professional / high-income tenant draw. Strengths: amenities A+, commute A+, housing A+; Watch: cost of living D+.
- North Thurston Public Schools (suburban): math 51% / reading 62% proficiency, ranked #80 of 291 in WA (top 28%) — acceptable for families but not a draw, mixed tenant base, ~2y average lease.
- Market conditions: Rents rising (+3.6%/yr); 190 active listings in the ZIP; 15 comparable units currently listed for rent nearby; rentals at typical pace (median 21d on market — plan ~3-4 weeks tenant-placement turnaround); solid renter incomes; 1,222 units permitted in Thurston County in 2024 (508 in 5+ unit buildings).
Forward outlook
- Local home prices are declining (-3.0%/yr); year-one equity from $761 of loan paydown is wiped out by about $3k of value loss. Plan a longer hold.
- Thurston County population projected at +27% by 2050 — long-run rental-demand tailwind backs the buy-and-hold thesis.
- At projected returns (-3.0% appreciation + 3.6% rent growth), your $31k cash investment doubles in ~4 years — after that, you're playing with house money.
Negotiation context
- Only 1 days on market — expect competitive offers; lowballing is unlikely to land.
Risks & watch-outs
- Climate carrying-cost: moderate flood risk — expect insurance premiums to compound above CPI over the hold.
Questions for the listing agent
- Built in 1978 — when were the roof, HVAC, electrical panel, plumbing, and water heater last replaced?
- Is there a deadline driving the sale (1031 exchange, divorce, estate, relocation)? That informs how much negotiation room exists.
- Schools are B-rated — typically a magnet for longer-tenancy family renters. What's the average tenant stay here, and is there a school-zone premium baked into asking?
- What's the average days-on-market for RENTAL listings here right now (not sales)? A rising rental-DOM trend means longer vacancies and softer asking-rent achievability than the comps imply.
- What's the recent tenant-quality profile in this submarket — average credit score on applications, eviction rate, late-payment / NSF rate, and stable-employment percentage? A property-management company in the area should have these aggregated.
- How much new for-sale + rental construction is in the pipeline within 1–3 miles? Heavy new supply typically softens prices + rents 12–24 months out; constrained supply supports both.
Investment metrics
- 1% rule
- 1.91% ✓
- Cap rate
- 16.10%
- Cash-on-cash
- 35.03%
- DSCR
- 2.56
- GRM
- 4.4
CMA / ARV
- ARV (on-the-fly)
- $117,504
- Comps found
- 8
Show comp detail 8 sales within ~0.75 mi
| Address | Dist | Beds/Ba | Sqft | Sold | Price | $/sf | Match |
|---|---|---|---|---|---|---|---|
| 5321 Roslyn Ln SE #10 | 0.08mi | 3/2.0 (+1) | 1,056 (-8%) | 10mo | $89,900 | $85 | 69 |
| 5250 College St SE #14 | 0.32mi | 2/2.0 | 1,056 (-8%) | 5mo | $155,000 | $147 | 67 |
| 5322 Roslyn Ln SE #5 | 0.09mi | 3/2.0 (+1) | 1,056 (-8%) | 12mo | $90,000 | $85 | 66 |
| 5532 Chelan Ln SE #47 | 0.13mi | 2/2.0 | 1,248 (+8%) | 18mo | $87,500 | $70 | 65 |
| 5532 Mountain Greens Ln SE | 0.15mi | 2/2.0 | 1,056 (-8%) | 19mo | $135,000 | $128 | 63 |
| 4500 Ruddell Rd SE #48 | 0.58mi | 3/2.0 (+1) | 1,130 (-2%) | 9mo | $115,000 | $102 | 57 |
| 5215 Mountain Green Ln SE | 0.14mi | 3/2.0 (+1) | 1,248 (+8%) | 24mo | $160,000 | $128 | 55 |
| 4500 Ruddell Rd SE #40 | 0.58mi | 3/2.0 (+1) | 1,296 (+12%) | 6mo | $120,000 | $93 | 42 |
Match score weights: distance 35% · size 25% · config 20% · recency 20%. Top-matched comps best support the ARV.
Projected returns pro-forma
-3.0% appreciation · 3.56% rent growth · sell at horizon
- IRR
- 31.2%
- Equity multiple
- 2.32×
- Total profit
- $40,662
- Equity at exit
- $16,401
- IRR
- 38.7%
- Equity multiple
- 4.71×
- Total profit
- $114,213
- Equity at exit
- $9,511
Cash invested: $30,800 (down + closing). Projections, not guarantees.
Landlord ↔ Tenant lean methodology
- Overall (STATE)
- 28 Tenant-Leaning
- State Washington
- 28 Tenant-Leaning · D+8
- County
- — inherits STATE
- City
- — inherits STATE
ZIP-level market 98503
- Rents YoY
- 3.6%
- Active inventory
- 190
- Price-to-rent
- 4.4×
Monthly cashflow live
- Estimated rent
- $2,100 high interval (Pro) →
- Mortgage (P&I)
- −$577
- Tax est. 1.5%
- −$138 /mo · $1,650/yr
- Insurance
- −$46
- HOA
- −$0
- Vacancy / Maint / Mgmt
- −$441
- Net cashflow
- $899
Break-even live
UW: 25.0% down · 7.5% · 30yr · 1.5% tax · 5.0% vac · 8.0% maint · 8.0% mgmt
Financing live
Cash to close
- Down payment
- $27,500
- Closing costs
- $3,300
- Reserves months
- —
- Total cash needed
- —
Loan-product check · same deal, 3 products live
Conventional
25% down · 7.5% · 30yr
- Down + closing
- —
- Monthly P&I
- —
- Monthly cashflow
- —
- DSCR
- —
- Eligible?
- —
Personal DTI + credit; lowest rate.
DSCR
20% down · 8.5% · 30yr
- Down + closing
- —
- Monthly P&I
- —
- Monthly cashflow
- —
- DSCR
- —
- Eligible?
- —
No personal income docs; deal must DSCR.
Hard money
10% down · 12.0% · 12mo
- Down + closing
- —
- Monthly P&I
- —
- Monthly cashflow
- —
- DSCR
- —
- Eligible?
- —
Short-term bridge; refi at stabilization.
Rent comps 15 comps
| Address | Beds | Baths | Sqft | Rent | $/sqft | DOM | Units | Dist |
|---|---|---|---|---|---|---|---|---|
| 4950 51st Ln SE Unit F-201 Lacey, WA | 2.0 | 2.0 | 975 | $1,650 | $1.69 | 21d | 1 | 0.32mi |
| 5301 Ivy Hill Ln SE Lacey, WA | 2.0 | 2.0 | 1361 | $2,495 | $1.83 | 43d | 1 | 0.35mi |
| 5216 Ivy Hill Ln SE Lacey, WA | 2.0 | 2.0 | 1361 | $2,595 | $1.91 | 13d | 1 | 0.37mi |
| 5649 46th Ln SE Lacey, WA | 3.0 | 3.0 | 1100 | $2,300 | $2.09 | 21d | 1 | 0.47mi |
| 4435 Ruddell Rd SE Lacey, WA | 2.0 | 1.0 | 856 | $2,000 | $2.34 | 13d | 1 | 0.58mi |
| 4625 45th Ave SE Lacey, WA | 1.0–3.0 | 1.0–3.0 | 975 | $2,030 | $2.08 | 13d | 21 | 0.58mi |
| 5323 Rumac St SE Olympia, WA | 2.0 | 1.5 | 1012 | $2,095 | $2.07 | 43d | 1 | 1.06mi |
| 5203 Rumac St SE Unit A Olympia, WA | 2.0 | 1.5 | 1012 | $2,195 | $2.17 | 43d | 1 | 1.08mi |
| 5938 Danials Loop SE Lacey, WA | 2.0 | 1.0 | 800 | $2,000 | $2.50 | 21d | 1 | 1.14mi |
| 3307 College St SE Lacey, WA | 2.0 | 1.0 | 865 | $1,700 | $1.97 | 13d | 3 | 1.28mi |
| 3301 College St SE Lacey, WA | 2.0 | 2.0 | 900 | $1,845 | $2.05 | 21d | 1 | 1.28mi |
| 7317 Fair Oaks Rd SE Olympia, WA | 3.0 | 2.0 | 1248 | $2,400 | $1.92 | 43d | 1 | 1.39mi |
| 3622 57th Ln SE Olympia, WA | 2.0 | 2.0 | 1156 | $1,999 | $1.73 | 13d | 1 | 1.42mi |
| 5701 30th Ave SE Lacey, WA | 2.0 | 2.0 | 899 | $1,503 | $1.67 | 13d | 2 | 1.44mi |
| 3539 Landview Dr SE Olympia, WA | 1.0–3.0 | 1.0–2.0 | 1314 | $2,295 | $1.75 | 13d | 19 | 1.48mi |
Listing history 2 events
-
2026-06-18remarks 691-char remark
-
2026-06-18$110,000 Active 1 DOM
ⓘ Source: listings_history table (triggers on properties + properties_extension) + one-shot
backfill from property_details.listing_events for pre-trigger history.
Climate risk First Street
- Flood 5/10 Major FEMA zone X (unshaded) · 66% chance over 30 yrs
- Wildfire 3/10 Moderate
- Heat 3/10 Moderate 7 d/yr ≥88°F today · 14 d/yr by 30 yrs out
- Wind 1/10 Low
- Air quality 6/10 Major 7 unhealthy d/yr today · 8 by 30 yrs out
Nearby sold comps map
Loading sold comps map…
Walkable amenities ~0.75 mi
Loading nearby amenities…
Taxation est. · year 1
- Rental income
- $25,204
- − Mortgage interest
- −$6,162
- − Property taxes
- −$1,650
- − Insurance
- −$550
- − Repairs & maintenance
- −$2,016
- − Management
- −$2,016
- − Depreciation
- −$3,200
- Taxable income
- $9,610
- Est. tax owed @ 24.0%
- −$2,306
- After-tax cash flow
- $8,483/yr
For passive investors: Depreciation is non-cash, so a rental often shows a tax loss while cash-flowing — sheltering income. Rental losses are passive: they offset passive income freely, and up to $25,000/yr can offset ordinary (W-2) income if you actively participate and your MAGI is under $100k (phasing out to $0 by $150k); unused losses carry forward. On sale, claimed depreciation is recaptured at up to 25%, and gains may owe capital-gains tax (a 1031 exchange can defer both). Figures are a year-1 estimate at your 24.0% rate — not tax advice; consult a CPA.
Condition & rehab AI · 6 photos
This turn-key manufactured home in Mountain Greens is in good condition with recent updates and a well-maintained exterior. It offers a bright, open-concept layout and is ready for a new owner to move in and enjoy.
Value-add opportunities
- Both Paint interior walls — Fresh paint enhances curb appeal and interior aesthetics.
- Both Replace window treatments — New window treatments improve curb appeal and interior aesthetics.
- Both Update flooring in bathrooms — Fresh flooring in bathrooms enhances curb appeal and interior aesthetics.
- Both Replace kitchen cabinets — Newer cabinets improve functionality and aesthetics in the kitchen.
Renovation cost estimate screening
Value-add ROI direction
- Both Paint interior walls — Fresh paint enhances curb appeal and interior aesthetics. ↑
- Both Replace window treatments — New window treatments improve curb appeal and interior aesthetics. ↑
- Both Update flooring in bathrooms — Fresh flooring in bathrooms enhances curb appeal and interior aesthetics. ↑
- Both Replace kitchen cabinets — Newer cabinets improve functionality and aesthetics in the kitchen. ↑
ⓘ Cost ranges are severity-bucket heuristics (US national rule-of-thumb). Get contractor quotes + a written scope before underwriting a rehab budget.
Schools (NCES district)
- District
- North Thurston Public Schools
- NCES district ID
- 5305850
- Math proficiency
- 51% ▬ 0.00%
- Reading proficiency
- 62% ▬ 0.00%
- Median HH income
- $62,338
- Composite
- 51.09/100
- National rank
- #3798
- State rank
- #80 of 291 in WA
Livability — Lacey
- Score
- 85/100
- State rank
- #33
- US rank
- #581
Category grades
Schools grade is shown separately in the Schools card above.
Census & demographics
- Census place
- Lacey, WA
- County
- Thurston County · 269,345 people
- City population
- 108,850
- Metro
- Olympia-Lacey-Tumwater, WA
- Population (ZIP)
- 41,656
- Household income
- $89,002
- Rent vs Own
- Severe rent burden
- 2195.0
Population outlook (Thurston County) Hauer SSP2
- Today (2025)
- 308,239 people
- By 2030
- 326,483 · +5.9%
- By 2040
- 359,890 · +16.8%
- By 2050
- 391,800 · +27.1%
- By 2075
- 468,024 · +51.8%
- By 2100
- 519,890 · +68.7%
Race, ethnicity, and origin ACS 2023
- Neighborhood character
- Diverse neighborhood (Simpson 0.56)
- Race & ethnicity
- White 65% Two or more races 12% Hispanic / Latino 12% Asian 7% Black 5% Pacific Islander 2% Native American 1%
- Hispanic origin (detail)
- Mexican 8% Puerto Rican 1%
- Common ancestry
- Portuguese 4% Slovak 3% Lithuanian 3%
- Foreign-born
- 10% · Canada, Vietnam, South Korea
- Languages at home
- 82% English-only · Spanish 6% German/W. Germanic 3% Other Asian/Pacific 2%
Political lean MEDSL · Thurston
- 2024 margin
- Strong D (+20.4) · D 58.5% · R 38.1% · Other 3.5%
- 2008→2024 swing
- -1.3pp toward R · 2008: 21.7pp · 2024: 20.4pp
- All cycles
- 2024: D+20.4 2020: D+18.6 2016: D+15.4 2012: D+19.0 2008: D+21.7
Not yet ingested
- Civics
- —
Market trends
- HPI YoY
- ▼ -385.93%
- Current HPI
- 361.0974
- Rent YoY
- ▲ 3.56%
- Metro
- Olympia-Lacey-Tumwater, WA
- State GDP YoY
- ▲ 4.65%
- F500 in state
- 22
Industry mix (Fortune 500 HQ in WA)
| Industry | F500 HQs | Revenue |
|---|---|---|
| Retail | 2 | $269B |
|
||
| Technology / Retail | 1 | $638B |
|
||
| Technology | 1 | $245B |
|
||
| Telecommunications | 1 | $38B |
|
||
| Food / Beverage | 1 | $36B |
|
||
| Automotive / Trucks | 1 | $34B |
|
||
Price history
1 event — show timeline
- 2026-06-17 Listed $110,000 NWMLS as Distributed by MLS Grid
Cash-flow waterfall
monthlySold comps — $/sqft
last 12 mo · ≤1 miLoading sold comps…