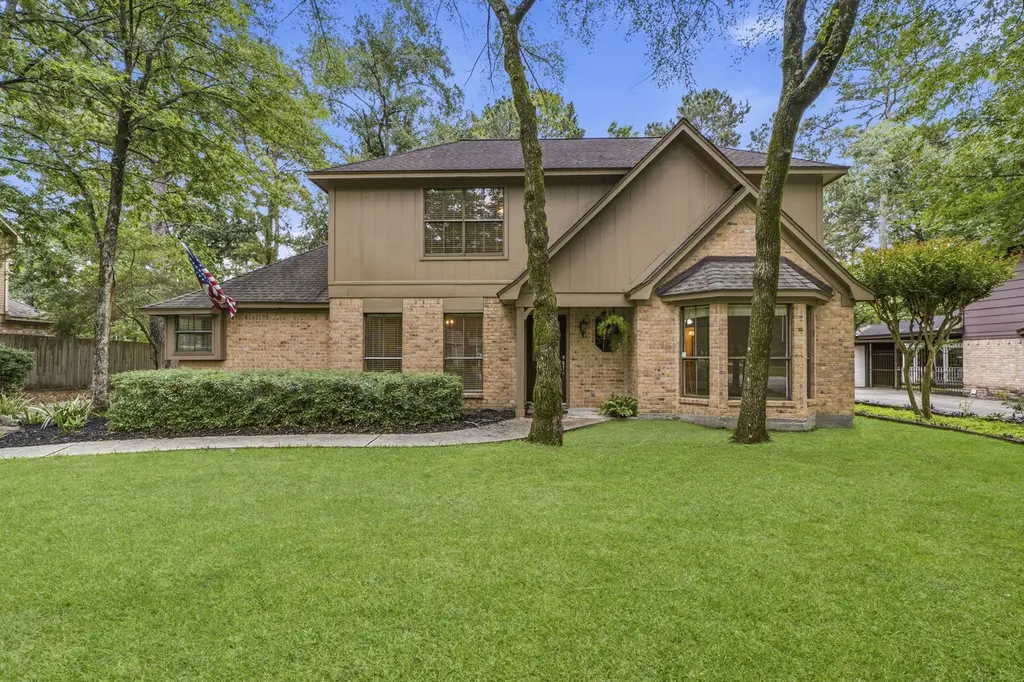
38 Split Rock Rd · The Woodlands, TX
Flood risk 1/10 · Minimal
- FEMA flood zone
- X (unshaded)
- Chance of flooding over 30 yrs
- 0.0%
- Est. flood insurance / yr
- $507 – $1,088
Fire risk 1/10 · Minimal
- Est. fire insurance / yr
- $1,222 – $2,270
Heat risk 8/10 · Major
- Hot days now (above 111°F)
- 7 days/yr
- Hot days in 30 yrs
- 23 days/yr
Wind risk 8/10 · Major
- Chance of severe wind over 30 yrs
- 99.0%
Air-quality risk 3/10 · Minor
- Unhealthy air days now
- 2 days/yr
- Unhealthy air days in 30 yrs
- 3 days/yr
Risk factors via First Street. Map © Google.
Why this score? — see what drove the D grade
The composite is a weighted blend of 9 inputs, each scored 0–100. Each bar is that input's sub-score; the figure is the points it added to the 100-point composite (weight × sub-score).
- ARV discount +14.3/15.0
- Cash flow +8.0/30.0
- Schools +5.1/10.0
- Livability +4.5/5.0
- Rent growth +3.0/5.0
- Condition / age +2.5/5.0
- 1% rule +2.3/10.0
- DSCR +2.0/10.0
- Appreciation +0.0/10.0
$475,000
🖨 Deal sheet (PDF) 📄 Offer letter ✓ Due diligence
Listing remarks MLS
CUSTOM HOME IN BEAUTIFUL WEDGEWOOD FOREST - CLOSE TO THE FRONT OF THE WOODLANDS. LARGE AND ROOMY - 4 BEDROOMS, 2.5 BATHS - MASTER DOWN - Home remodeled in May, 2016 with new stainless appliances, granite counters in kitchen and bathrooms, light fixtures, bath tub in master, new tile surround, fresh paint inside & outside, laminate in entry, dining & family rooms, new carpeting, new roof, sheet rock in the garage. Too much to describe here - must see for yourself. Hurry!
Key facts
- 0.26 acre lot
- 2 garage spots
- Community pool
Property features AI
Finance
- HOA & community: Community pool
Exterior
- Parking: Detached garage; 2 garage spaces
- Utilities: Public water; Public sewer
- Home design: Residential property; Built in 1983; Slab foundation; Composition roof
- Construction: Brick and cement siding exterior
- Exterior features: Fenced backyard; Private yard; Subdivision setting
Interior
- Kitchen: Dishwasher; Electric cooktop; Electric oven; Microwave; Garbage disposal
- Bedrooms: Primary bedroom on the first floor (20 x 12.5); Bedroom on second floor (10.5 x 11.5); Bedroom on second floor (14 x 11.5); Bedroom on second floor (17 x 12.5)
- Flooring: Carpet; Plank; Tile; Vinyl
- Bathrooms: 2 full bathrooms; 1 half bathroom
- Heating & cooling: Central heating (gas); Central electric air conditioning
- Interior features: Ceiling fans; Wood-burning fireplace (1)
- Laundry & utility: Washer and dryer included
Neighborhood map
What this means for you Summary
Snapshot
- This is a 4-bed/2.5-bath single-family listed at $475k.
Deal economics
- At list price, monthly cash flow is $-487 ($-6k/yr) — negative.
- To cash-flow at today's rent, offer at most $389k (18.1% below list).
- To meet the 1% rule (rent ≥ 1% of price), the offer needs to be $347k (27.0% below list).
- Recommended offer: $347k (27.0% below list) — sets the bar for 1% rule.
- Cap rate 5.1% vs local median 2.3% in The Woodlands — top-decile yield for the area; either an underpriced asset or a hidden risk that comps aren't pricing in. Stress-test before assuming the spread holds.
Location & tenants
- Location reads 91/100 on livability (#1 in TX, #47 nationally) — a professional / high-income tenant draw. Strengths: amenities A+, commute A+, employment A+; Watch: cost of living D-.
- Conroe ISD (other): math 57% / reading 57% proficiency, ranked #69 of 826 in TX (top 8%) — acceptable for families but not a draw, mixed tenant base, ~2y average lease.
- Zoned schools: Ride El (math 77% / reading 77%, grade A, #55 of 4,322 statewide, top 1%, 569 students, 32% FRL); Knox J H (math 65% / reading 67%, grade A-, #92 of 1,662 statewide, top 6%, 1,448 students, 31% FRL); Conroe H S (math 32% / reading 51%, grade F, #767 of 1,632 statewide, top 47%, 4,915 students, 61% FRL).
- Market conditions: Rents rising (+2.1%/yr); 261 active listings in the ZIP; 3 comparable units currently listed for rent nearby; rentals at typical pace (median 23d on market — plan ~3-4 weeks tenant-placement turnaround); high-income renter base; 13,259 units permitted in Montgomery County in 2024 (1,402 in 5+ unit buildings).
Forward outlook
- Local home prices are declining (-3.0%/yr); year-one equity from $3k of loan paydown is wiped out by about $14k of value loss. Plan a longer hold.
- Montgomery County population projected at +65% by 2050 — long-run rental-demand tailwind backs the buy-and-hold thesis.
Negotiation context
- Only 13 days on market — expect competitive offers; lowballing is unlikely to land.
- 2 sale attempts since 5y ago with the ask held roughly flat each time — persistent listings suggest the price (not the market) is what's stuck; bring a comps-based counter.
- Current owner paid $145k; list at $475k implies a 227% gain — meaningful room to come down on a strong offer.
Risks & watch-outs
- Climate carrying-cost: severe wind risk, 99% chance of damaging wind over 30y; extreme-heat days projected 7→23/yr by 2055 (HVAC capex compounding) — expect insurance premiums to compound above CPI over the hold.
Questions for the listing agent
- What do current leases actually rent for vs. the listed asking? Can we see a recent rent roll and the last 12 months of T-12 income?
- Is there a deadline driving the sale (1031 exchange, divorce, estate, relocation)? That informs how much negotiation room exists.
- Schools are A-rated — typically a magnet for longer-tenancy family renters. What's the average tenant stay here, and is there a school-zone premium baked into asking?
- The area grade is low — what's the realistic commute time and amenity access for the typical tenant pool here? Any planned neighborhood developments (good or bad) we should know about?
- What's the average days-on-market for RENTAL listings here right now (not sales)? A rising rental-DOM trend means longer vacancies and softer asking-rent achievability than the comps imply.
- What's the recent tenant-quality profile in this submarket — average credit score on applications, eviction rate, late-payment / NSF rate, and stable-employment percentage? A property-management company in the area should have these aggregated.
- How much new for-sale + rental construction is in the pipeline within 1–3 miles? Heavy new supply typically softens prices + rents 12–24 months out; constrained supply supports both.
Investment metrics
- 1% rule
- 0.73% ✗
- Cap rate
- 5.06%
- Cash-on-cash
- -4.39%
- DSCR
- 0.80
- GRM
- 11.4
CMA / ARV
- ARV (median comp)
- $559,620
- List price
- $475,000
- Delta
- -15.12%
- Verdict
- UNDERPRICED
- Comps
- 20 within 1.0 mi
Show comp detail 12 sales within ~0.75 mi
| Address | Dist | Beds/Ba | Sqft | Sold | Price | $/sf | Match |
|---|---|---|---|---|---|---|---|
| 38 Split Rock Rd | 0.00mi | 4/2.5 | 2,316 (0%) | 1mo | $475,000 | $205 | 99 |
| 4 Hickory Oak Dr | 0.38mi | 4/2.5 | 2,367 (+2%) | 6mo | $400,000 | $169 | 74 |
| 3 Ridgeline Ct | 0.48mi | 4/2.5 | 2,394 (+3%) | 4mo | $479,900 | $200 | 68 |
| 6 Fairmeade Bend Dr | 0.37mi | 4/2.5 | 2,150 (-7%) | 6mo | $400,000 | $186 | 66 |
| 14 Ridgeline Ct | 0.50mi | 4/2.5 | 2,464 (+6%) | 1mo | $497,000 | $202 | 66 |
| 16 Terravale Ct | 0.12mi | 4/3.5 | 2,658 (+15%) | 1mo | $515,000 | $194 | 65 |
| 17 Greenridge Forest Dr | 0.47mi | 3/2.0 (-1) | 2,408 (+4%) | 1mo | $535,000 | $222 | 64 |
| 11 Feather Branch Ct | 0.46mi | 3/2.0 (-1) | 2,507 (+8%) | 1mo | $590,000 | $235 | 57 |
| 110 S Mill Trace Dr | 0.64mi | 3/2.5 (-1) | 2,221 (-4%) | 1mo | $525,000 | $236 | 57 |
| 19 Hickory Oak Dr | 0.44mi | 5/2.5 (+1) | 2,508 (+8%) | 6mo | $498,000 | $199 | 56 |
| 12 Dunlin Meadow Dr | 0.50mi | 4/2.5 | 2,575 (+11%) | 4mo | $585,000 | $227 | 55 |
| 18 Mayfair Grove Ct | 0.66mi | 4/2.5 | 2,544 (+10%) | 2mo | $575,000 | $226 | 52 |
Match score weights: distance 35% · size 25% · config 20% · recency 20%. Top-matched comps best support the ARV.
Projected returns pro-forma
-3.0% appreciation · 2.09% rent growth · sell at horizon
- IRR
- -24.7%
- Equity multiple
- 0.16×
- Total profit
- $-111,095
- Equity at exit
- $70,824
- IRR
- -23.2%
- Equity multiple
- -0.12×
- Total profit
- $-149,260
- Equity at exit
- $41,069
Cash invested: $133,000 (down + closing). Projections, not guarantees.
Landlord ↔ Tenant lean methodology
- Overall (STATE)
- 87 Strongly Landlord-Friendly
- State Texas
- 87 Strongly Landlord-Friendly · R+5
- County
- — inherits STATE
- City
- — inherits STATE
ZIP-level market 77381
- Home prices YoY
- -31.0%
- Rents YoY
- 2.1%
- Active inventory
- 261
- Price-to-rent
- 11.4×
Monthly cashflow live
- Estimated rent
- $3,470 medium interval (Pro) →
- Mortgage (P&I)
- −$2,491
- Tax from tax record
- −$539 /mo · $6,466/yr
- Insurance
- −$198
- HOA
- −$0
- Vacancy / Maint / Mgmt
- −$729
- Net cashflow
- $-487
Break-even live
Sensitivity live
| Price | -10% $-218 | -5% $-352 | +0% $-487 | +5% $-621 | +10% $-756 |
|---|---|---|---|---|---|
| Rent | -10% $-761 | -5% $-624 | +0% $-487 | +5% $-350 | +10% $-213 |
| Rate | -1.0pp $-247 | -0.5pp $-366 | base $-487 | +0.5pp $-610 | +1.0pp $-735 |
UW: 25.0% down · 7.5% · 30yr · 1.5% tax · 5.0% vac · 8.0% maint · 8.0% mgmt
Financing live
Cash to close
- Down payment
- $118,750
- Closing costs
- $14,250
- Reserves months
- —
- Total cash needed
- —
Loan-product check · same deal, 3 products live
Conventional
25% down · 7.5% · 30yr
- Down + closing
- —
- Monthly P&I
- —
- Monthly cashflow
- —
- DSCR
- —
- Eligible?
- —
Personal DTI + credit; lowest rate.
DSCR
20% down · 8.5% · 30yr
- Down + closing
- —
- Monthly P&I
- —
- Monthly cashflow
- —
- DSCR
- —
- Eligible?
- —
No personal income docs; deal must DSCR.
Hard money
10% down · 12.0% · 12mo
- Down + closing
- —
- Monthly P&I
- —
- Monthly cashflow
- —
- DSCR
- —
- Eligible?
- —
Short-term bridge; refi at stabilization.
Rent comps 3 comps
| Address | Beds | Baths | Sqft | Rent | $/sqft | DOM | Units | Dist |
|---|---|---|---|---|---|---|---|---|
| 1950 Hughes Landing Blvd Spring, TX | 1.0–3.0 | 1.0–2.0 | 1162 | $4,613 | $3.97 | 0d | 39 | 1.32mi |
| 1956 Hughes Landing Blvd The Woodlands, TX | 3.0 | 2.0 | 1645 | $3,865 | $2.35 | 45d | 1 | 1.34mi |
| 15 Thorn Berry Pl Spring, TX | 4.0 | 2.5 | 2100 | $2,595 | $1.24 | 22d | 1 | 1.49mi |
Listing history 8 events
-
2026-05-17status Pending 845-char remark
-
2026-05-12$475,000 Active 845-char remark
-
2026-04-29historical $475,000 845-char remark
-
2021-04-28soldstatus
-
2021-04-27soldstatus Sold 486-char remark
Show marketing remark (486 chars)
CUSTOM HOME IN BEAUTIFUL WEDGEWOOD FOREST - CLOSE TO THE FRONT OF THE WOODLANDS. LARGE AND ROOMY - 4 BEDROOMS, 2.5 BATHS - MASTER DOWN - Home remodeled in May, 2016 with new stainless appliances, granite counters in kitchen and bathrooms, light fixtures, bath tub in master, new tile surround, fresh paint inside & outside, laminate in entry, dining & family rooms, new carpeting, new roof, sheet rock in the garage. Too much to describe here - must see for yourself. Hurry!
-
2021-02-09status Pending 486-char remark
Show marketing remark (486 chars)
CUSTOM HOME IN BEAUTIFUL WEDGEWOOD FOREST - CLOSE TO THE FRONT OF THE WOODLANDS. LARGE AND ROOMY - 4 BEDROOMS, 2.5 BATHS - MASTER DOWN - Home remodeled in May, 2016 with new stainless appliances, granite counters in kitchen and bathrooms, light fixtures, bath tub in master, new tile surround, fresh paint inside & outside, laminate in entry, dining & family rooms, new carpeting, new roof, sheet rock in the garage. Too much to describe here - must see for yourself. Hurry!
-
2021-02-09$320,000 Active 486-char remark
Show marketing remark (486 chars)
CUSTOM HOME IN BEAUTIFUL WEDGEWOOD FOREST - CLOSE TO THE FRONT OF THE WOODLANDS. LARGE AND ROOMY - 4 BEDROOMS, 2.5 BATHS - MASTER DOWN - Home remodeled in May, 2016 with new stainless appliances, granite counters in kitchen and bathrooms, light fixtures, bath tub in master, new tile surround, fresh paint inside & outside, laminate in entry, dining & family rooms, new carpeting, new roof, sheet rock in the garage. Too much to describe here - must see for yourself. Hurry!
-
1993-07-01soldstatus $145,435
ⓘ Source: listings_history table (triggers on properties + properties_extension) + one-shot
backfill from property_details.listing_events for pre-trigger history.
Tax reassessment forecast TX · Resets to sale price
- Current annual tax
- $6,466 · $539/mo
- Projected year-2 tax
- $8,692 · $724/mo
- Expected delta
- +$2,226/yr (+$186/mo · 34.4%)
ⓘ Screening estimate from a state-policy table — verify with the county assessor before closing.
Climate risk First Street
- Flood 1/10 Low FEMA zone X (unshaded) · 0% chance over 30 yrs
- Wildfire 1/10 Low
- Heat 8/10 Severe 7 d/yr ≥111°F today · 23 d/yr by 30 yrs out
- Wind 8/10 Severe 99% chance of damaging wind over 30 yrs
- Air quality 3/10 Moderate 2 unhealthy d/yr today · 3 by 30 yrs out
Nearby sold comps map
Loading sold comps map…
Walkable amenities ~0.75 mi
Loading nearby amenities…
Taxation est. · year 1
- Rental income
- $41,637
- − Mortgage interest
- −$26,607
- − Property taxes
- −$6,466
- − Insurance
- −$2,375
- − Repairs & maintenance
- −$3,331
- − Management
- −$3,331
- − Depreciation
- −$13,818
- Taxable loss
- −$14,292
- Est. tax savings @ 24.0%
- +$3,430
- After-tax cash flow
- $-2,410/yr
For passive investors: Depreciation is non-cash, so a rental often shows a tax loss while cash-flowing — sheltering income. Rental losses are passive: they offset passive income freely, and up to $25,000/yr can offset ordinary (W-2) income if you actively participate and your MAGI is under $100k (phasing out to $0 by $150k); unused losses carry forward. On sale, claimed depreciation is recaptured at up to 25%, and gains may owe capital-gains tax (a 1031 exchange can defer both). Figures are a year-1 estimate at your 24.0% rate — not tax advice; consult a CPA.
Schools (NCES district)
- District
- Conroe ISD
- NCES district ID
- 4815000
- Math proficiency
- 57% ▼ -6.00%
- Reading proficiency
- 57% ▼ -1.00%
- Median HH income
- $71,541
- Composite
- 50.65/100
- National rank
- #1833
- State rank
- #69 of 826 in TX
Livability — The Woodlands
- Score
- 91/100
- State rank
- #1
- US rank
- #47
Category grades
Schools grade is shown separately in the Schools card above.
Census & demographics
- Census place
- The Woodlands, TX
- County
- Montgomery County · 663,713 people
- City population
- 106,505
- Metro
- Houston-The Woodlands-Sugar Land, TX
- Population (ZIP)
- 36,139
- Household income
- $143,565
- Rent vs Own
- Severe rent burden
- 530.0
Population outlook (Montgomery County) Hauer SSP2
- Today (2025)
- 713,896 people
- By 2030
- 805,263 · +12.8%
- By 2040
- 992,708 · +39.1%
- By 2050
- 1,179,590 · +65.2%
- By 2075
- 1,628,084 · +128.1%
- By 2100
- 1,937,880 · +171.5%
Race, ethnicity, and origin ACS 2023
- Neighborhood character
- Predominantly White (73%)
- Race & ethnicity
- White 73% Hispanic / Latino 16% Two or more races 11% Asian 5% Black 2%
- Hispanic origin (detail)
- Mexican 8%
- Common ancestry
- Italian 4% Lithuanian 3% Serbian 3%
- Foreign-born
- 18% · Canada, China, Dominican Republic
- Languages at home
- 81% English-only · Spanish 11% Other Indo-European 2% Chinese 2%
Political lean MEDSL · Montgomery
- 2024 margin
- Solid R (+45.5) · D 26.8% · R 72.3%
- 2008→2024 swing
- +7.2pp toward D · 2008: -52.7pp · 2024: -45.5pp
- All cycles
- 2024: R+45.5 2020: R+43.8 2016: R+51.4 2012: R+60.7 2008: R+52.7
Not yet ingested
- Civics
- —
Market trends
- HPI YoY
- ▼ -122.06%
- Current HPI
- 271.7165
- Rent YoY
- ▲ 2.09%
- Metro
- Houston-The Woodlands-Sugar Land, TX
- State GDP YoY
- ▲ 3.95%
- F500 in state
- 110
Industry mix (Fortune 500 HQ in TX)
| Industry | F500 HQs | Revenue |
|---|---|---|
| Energy | 16 | $1,198B |
|
||
| Technology | 5 | $198B |
|
||
| Engineering / Construction | 4 | $72B |
|
||
| Energy Services | 3 | $60B |
|
||
| Utilities | 3 | $41B |
|
||
| Healthcare | 2 | $330B |
|
||
Price history
+226.6% since first listed11 events — show timeline
- 2026-06-02 Sold (Public Records) — Public Records
- 2026-06-02 Sold (MLS) — HARMLS
- 2026-05-26 Pending — HARMLS
- 2026-05-17 Pending — HARMLS
- 2026-05-12 Listed $475,000 HARMLS
- 2026-04-29 Coming Soon $475,000 HARMLS
- 2021-04-28 Sold (Public Records) — Public Records
- 2021-04-27 Sold (MLS) — HARMLS
- 2021-02-09 Pending — HARMLS
- 2021-02-09 Listed $320,000 HARMLS
- 1993-07-01 Sold (Public Records) $145,435 Public Records
Property tax history
+4.2%/yrLatest (2025): $6,466 · +9.5% YoY. Source: county tax records.
Cash-flow waterfall
monthlySold comps — $/sqft
last 12 mo · ≤1 miLoading sold comps…