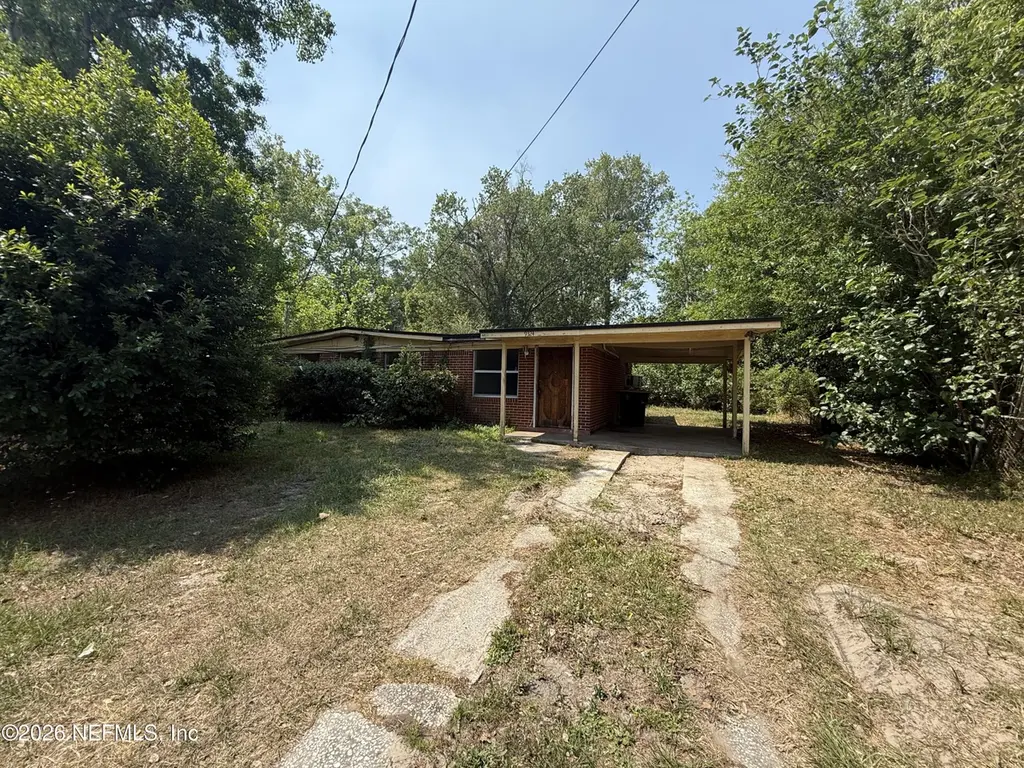
9324 Norfolk Blvd · Jacksonville, FL
Flood risk 3/10 · Minor
- FEMA flood zone
- X (unshaded)
- Chance of flooding over 30 yrs
- 0.07%
- Est. flood insurance / yr
- $507 – $1,088
Fire risk 3/10 · Minor
- Est. fire insurance / yr
- $947 – $1,759
Heat risk 9/10 · Severe
- Hot days now (above 107°F)
- 7 days/yr
- Hot days in 30 yrs
- 19 days/yr
Wind risk 9/10 · Severe
- Chance of severe wind over 30 yrs
- 99.0%
Air-quality risk 4/10 · Minor
- Unhealthy air days now
- 6 days/yr
- Unhealthy air days in 30 yrs
- 6 days/yr
Risk factors via First Street. Map © Google.
Why this score? — see what drove the B+ grade
The composite is a weighted blend of 9 inputs, each scored 0–100. Each bar is that input's sub-score; the figure is the points it added to the 100-point composite (weight × sub-score).
- Cash flow +30.0/30.0
- ARV discount +15.0/15.0
- 1% rule +10.0/10.0
- DSCR +10.0/10.0
- Livability +4.2/5.0
- Schools +3.9/10.0
- Condition / age +2.5/5.0
- Rent growth +2.2/5.0
- Appreciation +0.0/10.0
$75,000
🖨 Deal sheet 📄 Offer letter ✓ Due diligence
Listing remarks
Investor Special!! Cash or hard money only. No sight unseen offers. Full rehab needed (roof replaced in 2019). Full brick home featuring 3 bedrooms, 1.5 baths, and 925 sq ft on a 0.19-acre lot. You get what you see. Property sold as-is. Seller and agent have no knowledge of the property history, buyer to perform all due diligence. Home was purchased through a foreclosure auction, cleaned out, and brought back to market.
Key facts
- 8,276 sq ft lot
- Parking
- Built 1961
Property features AI
Exterior
- Parking: Carport (1 space)
- Utilities: Public sewer; Electricity available; Natural gas available; Sewer available; Water available
- Home design: Single Family Residence; One story; Entry level is 1
- Construction: Brick construction
- Exterior features: Shingle roof; Shed(s) on the property; City street frontage; Paved road access
Interior
- Bedrooms: 3 bedrooms
- Bathrooms: 1 full bathroom; 1 half bathroom
- Heating & cooling: No heating specified; No cooling specified
- Interior features: No built-in appliances listed
Neighborhood map
What this means for you Summary
Snapshot
- This is a 3-bed/2.0-bath single-family listed at $75k.
Deal economics
- At list price, monthly cash flow is $490 ($6k/yr) — positive.
- The deal already cash-flows at list — no discount required.
- Meets the 1% rule at list price ($1k rent vs $75k).
- Recommended offer: $73k (3.0% below list) — sets the bar for market timing.
- Cap rate 14.1% vs local median 4.0% in Jacksonville — top-decile yield for the area; either an underpriced asset or a hidden risk that comps aren't pricing in. Stress-test before assuming the spread holds.
Location & tenants
- Location reads 83/100 on livability (#50 in FL, #911 nationally) — a professional / high-income tenant draw. Strengths: amenities A+, commute A+, housing A+.
- Duval (urban): math 46% / reading 45% proficiency, ranked #48 of 73 in FL (top 66%) — families likely to look elsewhere, expect single-tenant / working-renter base with shorter leases.
- Market conditions: Rents soft (-1.4%/yr); 291 active listings in the ZIP; 14 comparable units currently listed for rent nearby; rentals at typical pace (median 17d on market — plan ~3-4 weeks tenant-placement turnaround); lower-income renter base — watch delinquency; 6,503 units permitted in Duval County in 2024 (1,131 in 5+ unit buildings).
- This rent runs 39% of the median local income ($41k/yr) — at the standard rent-burdened threshold; future hikes will face affordability resistance.
Forward outlook
- Local home prices are declining (-3.0%/yr); year-one equity from $519 of loan paydown is wiped out by about $2k of value loss. Plan a longer hold.
- Duval County population projected at +19% by 2050 — long-run rental-demand tailwind backs the buy-and-hold thesis.
- At projected returns (-3.0% appreciation + 0.0% rent growth), your $21k cash investment doubles in ~5 years — after that, you're playing with house money.
Negotiation context
- It's been on market 57 days — a 3% lower offer ($73k) is reasonable based on typical stale-listing flexibility.
- Current owner paid $10k; list at $75k implies a 643% gain — meaningful room to come down on a strong offer.
Risks & watch-outs
- Climate carrying-cost: severe wind risk, 99% chance of damaging wind over 30y; extreme-heat days projected 7→19/yr by 2055 (HVAC capex compounding) — expect insurance premiums to compound above CPI over the hold.
Questions for the listing agent
- It's been on market 57 days. Have you received any prior offers? Is the seller open to a 3% concession, seller financing, or rate buy-down credit?
- Built in 1961 — when were the roof, HVAC, electrical panel, plumbing, and water heater last replaced?
- Is there a deadline driving the sale (1031 exchange, divorce, estate, relocation)? That informs how much negotiation room exists.
- Schools are B-rated — typically a magnet for longer-tenancy family renters. What's the average tenant stay here, and is there a school-zone premium baked into asking?
- What's the average days-on-market for RENTAL listings here right now (not sales)? A rising rental-DOM trend means longer vacancies and softer asking-rent achievability than the comps imply.
- What's the recent tenant-quality profile in this submarket — average credit score on applications, eviction rate, late-payment / NSF rate, and stable-employment percentage? A property-management company in the area should have these aggregated.
- How much new for-sale + rental construction is in the pipeline within 1–3 miles? Heavy new supply typically softens prices + rents 12–24 months out; constrained supply supports both.
Investment metrics
- 1% rule
- 1.78% ✓
- Cap rate
- 14.13%
- Cash-on-cash
- 27.99%
- DSCR
- 2.25
- GRM
- 4.7
CMA / ARV
- ARV (on-the-fly)
- $135,050
- Comps found
- 12
Show comp detail 12 sales within ~0.75 mi
| Address | Dist | Beds/Ba | Sqft | Sold | Price | $/sf | Match |
|---|---|---|---|---|---|---|---|
| 5114 Roanoke Blvd | 0.26mi | 3/1.5 | 936 (+1%) | 1mo | $149,900 | $160 | 83 |
| 4637 Williamsburg Ave | 0.28mi | 3/1.0 | 942 (+2%) | 8mo | $88,000 | $93 | 74 |
| 5115 Locksley Ave | 0.44mi | 3/1.5 | 936 (+1%) | 2mo | $110,000 | $118 | 73 |
| 9504 Flechette Ave | 0.45mi | 3/1.5 | 932 (+1%) | 5mo | $133,500 | $143 | 71 |
| 4656 Colchester Rd | 0.23mi | 3/1.0 | 887 (-4%) | 11mo | $148,000 | $167 | 69 |
| 9604 Flechette Ave | 0.48mi | 3/1.5 | 868 (-6%) | 7mo | $57,000 | $66 | 59 |
| 9715 Flechette Ave | 0.52mi | 3/1.5 | 988 (+7%) | 4mo | $144,500 | $146 | 59 |
| 4620 Bristol Ave | 0.23mi | 3/2.0 | 1,050 (+14%) | 12mo | $198,000 | $189 | 57 |
| 9926 Frankella Rd | 0.51mi | 2/1.0 (-1) | 866 (-6%) | 1mo | $135,000 | $156 | 55 |
| 4242 Turton Ave | 0.63mi | 3/1.0 | 912 (-1%) | 11mo | $120,000 | $132 | 55 |
| 5015 Portsmouth Ave | 0.28mi | 3/2.0 | 1,056 (+14%) | 11mo | $168,000 | $159 | 54 |
| 3915 Beverly Ave | 0.75mi | 2/1.0 (-1) | 828 (-10%) | 3mo | $55,000 | $66 | 36 |
Match score weights: distance 35% · size 25% · config 20% · recency 20%. Top-matched comps best support the ARV.
Projected returns pro-forma
-3.0% appreciation · 0.0% rent growth · sell at horizon
- IRR
- 18.6%
- Equity multiple
- 1.72×
- Total profit
- $15,184
- Equity at exit
- $11,183
- IRR
- 24.7%
- Equity multiple
- 2.83×
- Total profit
- $38,487
- Equity at exit
- $6,485
Cash invested: $21,000 (down + closing). Projections, not guarantees.
Landlord ↔ Tenant lean methodology
- Overall (STATE)
- 87 Strongly Landlord-Friendly
- State Florida
- 87 Strongly Landlord-Friendly · R+3
- County
- — inherits STATE
- City
- — inherits STATE
ZIP-level market 32208
- Home prices YoY
- -33.6%
- Rents YoY
- -1.4%
- Active inventory
- 291
- Price-to-rent
- 4.7×
Monthly cashflow live
- Estimated rent
- $1,333 high interval (Pro) →
- Mortgage (P&I)
- −$393
- Tax from tax record
- −$139 /mo · $1,668/yr
- Insurance
- −$31
- HOA
- −$0
- Vacancy / Maint / Mgmt
- −$280
- Net cashflow
- $490
Break-even live
UW: 25.0% down · 7.5% · 30yr · 1.5% tax · 5.0% vac · 8.0% maint · 8.0% mgmt
Financing live
Cash to close
- Down payment
- $18,750
- Closing costs
- $2,250
- Reserves months
- —
- Total cash needed
- —
Loan-product check · same deal, 3 products live
Conventional
25% down · 7.5% · 30yr
- Down + closing
- —
- Monthly P&I
- —
- Monthly cashflow
- —
- DSCR
- —
- Eligible?
- —
Personal DTI + credit; lowest rate.
DSCR
20% down · 8.5% · 30yr
- Down + closing
- —
- Monthly P&I
- —
- Monthly cashflow
- —
- DSCR
- —
- Eligible?
- —
No personal income docs; deal must DSCR.
Hard money
10% down · 12.0% · 12mo
- Down + closing
- —
- Monthly P&I
- —
- Monthly cashflow
- —
- DSCR
- —
- Eligible?
- —
Short-term bridge; refi at stabilization.
Rent comps 14 comps
| Address | Beds | Baths | Sqft | Rent | $/sqft | DOM | Units | Dist |
|---|---|---|---|---|---|---|---|---|
| 9348 Culpeper Ave Jacksonville, FL | 3.0 | 1.0 | 882 | $1,195 | $1.35 | 23d | 1 | 0.10mi |
| 4662 Roanoke Blvd Jacksonville, FL | 3.0 | 2.0 | 1104 | $1,195 | $1.08 | 14d | 1 | 0.18mi |
| 4935 Portsmouth Ave Jacksonville, FL | 3.0 | 1.0 | 894 | $1,163 | $1.30 | 10d | 1 | 0.20mi |
| 9561 Norfolk Blvd Jacksonville, FL | 3.0 | 1.5 | 934 | $1,350 | $1.45 | 1d | 1 | 0.24mi |
| 9436 Gisborne Dr Jacksonville, FL | 3.0 | 1.5 | 950 | $1,440 | $1.52 | 20d | 1 | 0.33mi |
| 9206 Greenleaf Rd Jacksonville, FL | 3.0 | 1.5 | 888 | $1,400 | $1.58 | 17d | 1 | 0.51mi |
| 9658 Gibson Ave Jacksonville, FL | 3.0 | 1.5 | 977 | $1,225 | $1.25 | 23d | 1 | 0.63mi |
| 8119 Siskin Ave Jacksonville, FL | 2.0 | 2.0 | 1102 | $1,650 | $1.50 | 17d | 1 | 1.07mi |
| 8119 Siskin Ave Jacksonville, FL | 2.0 | 2.0 | 1102 | $1,650 | $1.50 | 23d | 1 | 1.07mi |
| 4655 Ken Knight Dr N Jacksonville, FL | 2.0 | 1.0 | 646 | $600 | $0.93 | 23d | 1 | 1.15mi |
| 4440 Ken Knight Dr N Jacksonville, FL | 2.0 | 1.0 | 716 | $650 | $0.91 | 14d | 1 | 1.22mi |
| 4543 Moncrief Rd W Jacksonville, FL | 2.0 | 1.0 | 950 | $1,075 | $1.13 | 7d | 1 | 1.33mi |
| 4177 Lorenzo Ct Unit 4 Jacksonville, FL | 2.0 | 1.0 | 840 | $945 | $1.12 | 1d | 1 | 1.43mi |
| 4253 Moncrief Rd W Unit 2 Jacksonville, FL | 2.0 | 1.0 | 840 | $975 | $1.16 | 23d | 1 | 1.46mi |
Listing history 18 events
-
2026-06-18days on market $75,000 Active 57 DOM
-
2026-06-17days on market $75,000 Active 56 DOM
-
2026-06-16days on market $75,000 Active 55 DOM
-
2026-06-15days on market $75,000 Active 54 DOM
-
2026-06-13pricedays on market $75,000 Active 51 DOM
-
2026-06-10days on market $78,890 Active 48 DOM
-
2026-06-08days on market $78,890 Active 47 DOM
-
2026-06-07pricedays on market $78,890 Active 46 DOM
-
2026-06-05days on market $79,890 Active 43 DOM
-
2026-06-03days on market $79,890 Active 42 DOM
-
2026-06-02days on market $79,890 Active 41 DOM
-
2026-06-01days on market $79,890 Active 40 DOM
-
2026-05-31days on market $79,890 Active 39 DOM
-
2026-05-21price $79,990
-
2026-05-14price $84,990
-
2026-05-06price $89,990
-
2026-04-21$99,990 Active
-
1971-05-29soldstatus $10,100
ⓘ Source: listings_history table (triggers on properties + properties_extension) + one-shot
backfill from property_details.listing_events for pre-trigger history.
Tax reassessment forecast FL · Resets to sale price
- Current annual tax
- $1,668 · $139/mo
- Projected year-2 tax
- $1,668 · $139/mo
- Expected delta
- $0/yr ($0/mo · 0.0%)
ⓘ Screening estimate from a state-policy table — verify with the county assessor before closing.
Climate risk First Street
- Flood 3/10 Moderate FEMA zone X (unshaded) · 7% chance over 30 yrs
- Wildfire 3/10 Moderate
- Heat 9/10 Extreme 7 d/yr ≥107°F today · 19 d/yr by 30 yrs out
- Wind 9/10 Extreme 99% chance of damaging wind over 30 yrs
- Air quality 4/10 Moderate 6 unhealthy d/yr today · 6 by 30 yrs out
Nearby sold comps map
Loading sold comps map…
Walkable amenities ~0.75 mi
Loading nearby amenities…
Taxation est. · year 1
- Rental income
- $16,000
- − Mortgage interest
- −$4,201
- − Property taxes
- −$1,668
- − Insurance
- −$375
- − Repairs & maintenance
- −$1,280
- − Management
- −$1,280
- − Depreciation
- −$2,182
- Taxable income
- $5,015
- Est. tax owed @ 24.0%
- −$1,204
- After-tax cash flow
- $4,674/yr
For passive investors: Depreciation is non-cash, so a rental often shows a tax loss while cash-flowing — sheltering income. Rental losses are passive: they offset passive income freely, and up to $25,000/yr can offset ordinary (W-2) income if you actively participate and your MAGI is under $100k (phasing out to $0 by $150k); unused losses carry forward. On sale, claimed depreciation is recaptured at up to 25%, and gains may owe capital-gains tax (a 1031 exchange can defer both). Figures are a year-1 estimate at your 24.0% rate — not tax advice; consult a CPA.
Schools (NCES district)
- District
- Duval
- NCES district ID
- 1200480
- Math proficiency
- 46% ▼ -11.00%
- Reading proficiency
- 45% ▼ -4.00%
- Median HH income
- $48,987
- Composite
- 38.97/100
- National rank
- #4076
- State rank
- #48 of 73 in FL
Livability — Jacksonville
- Score
- 83/100
- State rank
- #50
- US rank
- #911
Category grades
Schools grade is shown separately in the Schools card above.
Census & demographics
- Census place
- Jacksonville, FL
- County
- Duval County · 1,015,274 people
- City population
- 979,034
- Metro
- Jacksonville, FL
- Population (ZIP)
- 32,699
- Household income
- $41,324
- Rent vs Own
- Severe rent burden
- 1765.0
Population outlook (Duval County) Hauer SSP2
- Today (2025)
- 1,013,010 people
- By 2030
- 1,059,228 · +4.6%
- By 2040
- 1,141,439 · +12.7%
- By 2050
- 1,205,258 · +19.0%
- By 2075
- 1,324,282 · +30.7%
- By 2100
- 1,319,620 · +30.3%
Race, ethnicity, and origin ACS 2023
- Neighborhood character
- Predominantly Black (77%)
- Race & ethnicity
- Black 77% White 16% Two or more races 4% Hispanic / Latino 3%
- Common ancestry
- Italian 1%
- Foreign-born
- 2% · Canada
- Languages at home
- 97% English-only · Spanish 2%
Political lean MEDSL · Duval
- 2024 margin
- Toss-up / Even · D 48.7% · R 50.1% · Other 1.2%
- 2008→2024 swing
- +0.4pp no change · 2008: -1.9pp · 2024: -1.5pp
- All cycles
- 2024: R+1.5 2020: D+3.8 2016: R+1.5 2012: R+3.6 2008: R+1.9
Not yet ingested
- Civics
- —
Market trends
- HPI YoY
- ▼ -110.56%
- Current HPI
- 217.9706
- Rent YoY
- ▼ -1.36%
- Metro
- Jacksonville, FL
- State GDP YoY
- ▲ 3.28%
- F500 in state
- 36
Industry mix (Fortune 500 HQ in FL)
| Industry | F500 HQs | Revenue |
|---|---|---|
| Industrial Technology | 2 | $29B |
|
||
| Insurance | 2 | $17B |
|
||
| Retail | 1 | $60B |
|
||
| Technology Distribution | 1 | $58B |
|
||
| Homebuilding | 1 | $35B |
|
||
| Technology Manufacturing | 1 | $35B |
|
||
Price history
+692.0% since first listed5 events — show timeline
- 2026-05-21 Price Changed $79,990 realMLS
- 2026-05-14 Price Changed $84,990 realMLS
- 2026-05-06 Price Changed $89,990 realMLS
- 2026-04-21 Listed $99,990 realMLS
- 1971-05-29 Sold (Public Records) $10,100 Public Records
Property tax history
+9.0%/yrLatest (2025): $1,668 · -20.2% YoY. Source: county tax records.
Cash-flow waterfall
monthlySold comps — $/sqft
last 12 mo · ≤1 miLoading sold comps…